Gene expression and the transcriptome II SAGE SAGE


 • Several hundred intermediate-frequency transcripts, each making")
 • Further 50% of m. RNA is")
 Get some feel for the numbers (can")
 • This means that most of the")
 Fraction of all transcripts 1.")


 where red is the test expression level,")


In the yeast two-hybrid system, the known gene encoding X, is cloned")


. Vector is made containing transcription factor DBD plus")

- Slides: 40
Gene expression and the transcriptome II
SAGE • SAGE = Serial Analysis of Gene Expression • Based on serial sequencing of 15 -bp tags that are unique to each and every gene • SAGE is a method to determine absolute abundance of every transcript expressed in a population of cells
SAGE • 15 -bp gene-specific tags are produced by elegant series of molecular biology manipulations and then concatenated into a single molecule (string) for automated sequencing • By sequencing the concatenated fragments, the number of copies of each tag can be counted • A list of each unique tag and its abundance in the population is assembled
SAGE • At least 50, 000 tags are required per sample to approach saturation, the point where each expressed gene (eukaryotic cell) is represented at least twice • SAGE costs about $5000 per sample • Too expensive to do replicated comparisons like is done with microarrays
Transcript abundance in typical eukaryotic cell • <100 transcripts account for 20% of of total m. RNA population, each being present in between 100 and 1000 copies per cell • These encode ribosomal proteins and other core elements of transcription and translation machinery, histones and further taxon-specific genes General, basic and most important cellular mechanisms
Transcript abundance in typical eukaryotic cell (2) • Several hundred intermediate-frequency transcripts, each making 10 to 100 copies, make up for a further 30% of m. RNA • These code for housekeeping enzymes, cytoskeletal components and some unusually abundant cell-type specific proteins Pretty basic housekeeping things
Transcript abundance in typical eukaryotic cell (3) • Further 50% of m. RNA is made up of tens of thousands low-abundance transcripts (<10), some of which may be expressed at less than one copy per cell (on average) • Most of these genes are tissue-specific or induced only under particular conditions Specific or special purpose products
Transcript abundance in typical eukaryotic cell (4) Get some feel for the numbers (can be a factor 2 off but order of magnitude about right) If • ~80 transcripts * ~400 copies = 32, 000 (20%) • ~600 transcripts * ~75 copies = 45, 000 (30%) • 25, 000 transcripts * ~3 copies = 75, 000 (50%) • Then Total =150, 000 m. RNA molecules
Transcript abundance in typical eukaryotic cell (5) • This means that most of the transcripts in a cell population contribute less than 0. 01% of the total m. RNA • Say 1/3 of higher eukaryote genome is expressed in given tissue, then about 10, 000 different tags should be detectable • Taking into account that half the transcriptome is relatively abundant, at least 50, 000 different tags should be sequenced to approach saturation (at least 10 copies per transcript on average)
SAGE analysis of yeast (Velculesco et al. , 1997) Fraction of all transcripts 1. 0 17% 38% 45% 0. 75 0. 25 0 100 10 1 Number of transcripts per cell 0. 1
SAGE quantitative comparison • A tag present in 4 copies in one sample of 50, 000 tags, and in 2 copies in another sample, may be twofold expressed but is not going to be significant • Even 20 to 10 tags might not be statistically significant given the large numbers of comparisons • Often, 10 -fold over- or under-expression is taken as threshold
SAGE quantitative comparison • A great advantage of SAGE is that method is unbiased by experimental conditions • Direct comparison of data sets is possible • Data produced by different groups can be pooled • Web-based tools for performing comparisons of samples all over the world exist (e. g. SAGEnet and x. Profiler)
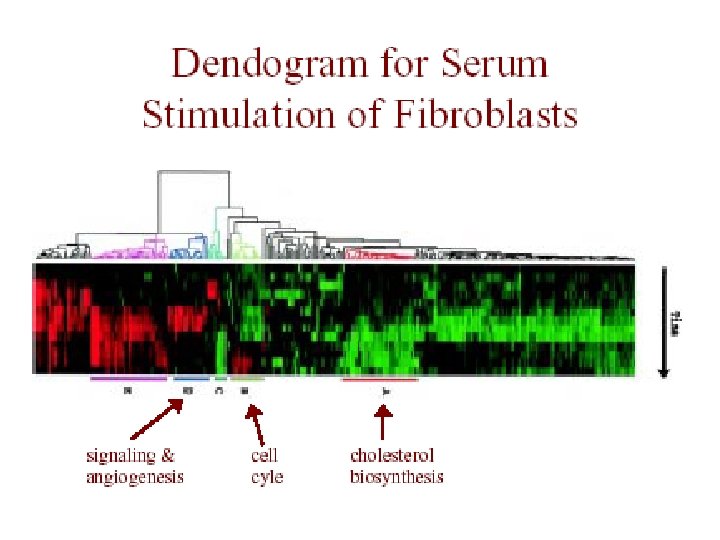
Genome-Wide Cluster Analysis Eisen dataset • Eisen et al. , PNAS 1998 • S. cerevisiae (baker’s yeast) – all genes (~ 6200) on a single array – measured during several processes • human fibroblasts – 8600 human transcripts on array – measured at 12 time points during serum stimulation
The Eisen Data • 79 measurements for yeast data • collected at various time points during – diauxic shift (shutting down genes for metabolizing sugars, activating those for metabolizing ethanol) – mitotic cell division cycle – sporulation – temperature shock – reducing shock
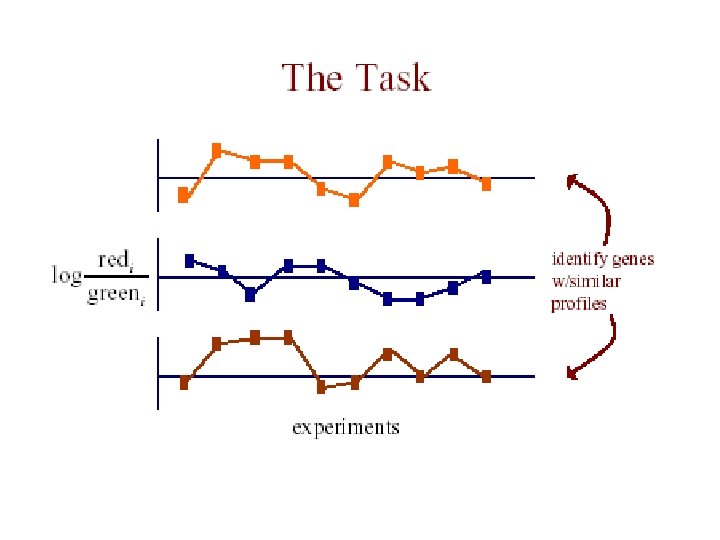
The Data • each measurement represents Log(Redi/Greeni) where red is the test expression level, and green is the reference level for gene G in the i th experiment • the expression profile of a gene is the vector of measurements across all experiments [G 1. . Gn]
The Data • m genes measured in n experiments: g 1, 1 ……… g 1, n g 2, 1 ………. g 2, n gm, 1 ………. gm, n Vector for 1 gene
Eisen et al. Results • redundant representations of genes cluster together – but individual genes can be distinguished from related genes by subtle differences in expression • genes of similar function cluster together – e. g. 126 genes strongly down-regulated in response to stress
Eisen et al. Results • 126 genes down-regulated in response to stress – 112 of the genes encode ribosomal and other proteins related to translation – agrees with previously known result that yeast responds to favorable growth conditions by increasing the production of ribosomes
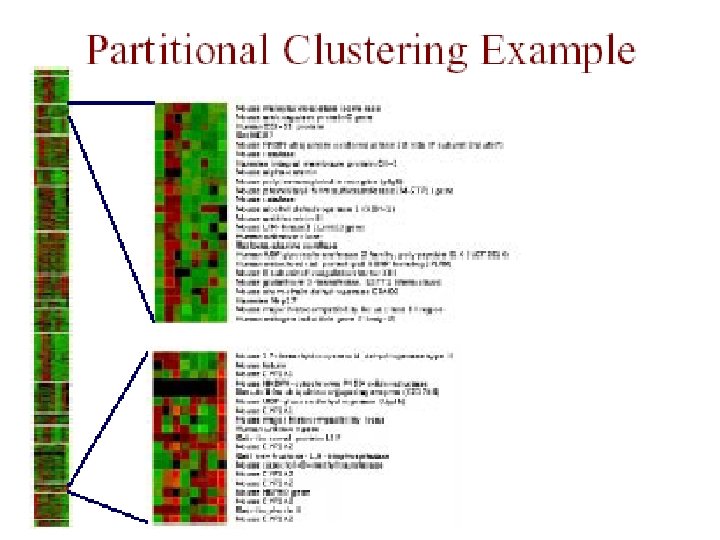
Partitional Clustering • divide instances into disjoint clusters – flat vs. tree structure • key issues – how many clusters should there be? – how should clusters be represented?
Partitional Clustering from a Hierarchical Clustering we can always generate a partitional clustering from a hierarchical clustering by “cutting” the tree at some level
K-Means Clustering • assume our instances are represented by vectors of real values • put k cluster centers in same space as instances • now iteratively move cluster centers
K-Means Clustering • each iteration involves two steps: – assignment of instances to clusters – re-computation of the means
K-Means Clustering • in k-means clustering, instances are assigned to one and only one cluster • can do “soft” k-means clustering via Expectation Maximization (EM) algorithm – each cluster represented by a normal distribution – E step: determine how likely is it that each cluster “generated” each instance – M step: move cluster centers to maximize likelihood of instances
Protein-protein interactions
Protein-protein interaction If you want to know whether any particular proteins bound to protein X. Then such proteins can be found by the yeast two-hybrid system. The two-hybrid system allows in vivo detection of protein interactions as well as the analysis of the affinity of these interactions.
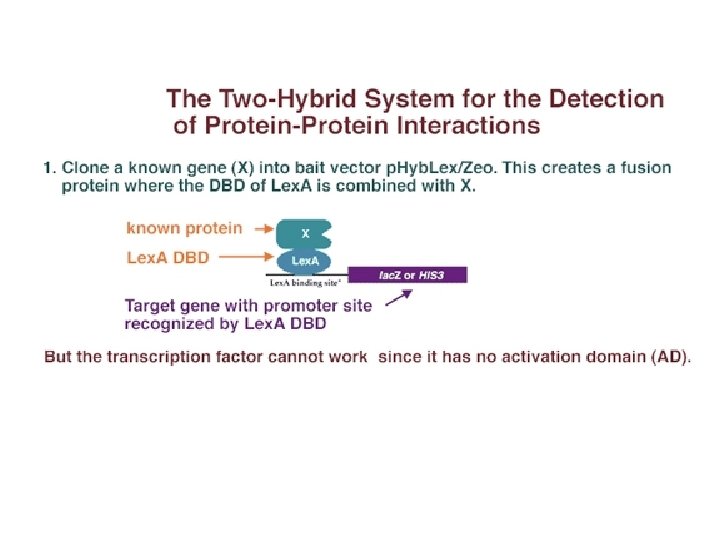
Protein-protein interaction Two-hybrid technology exploits the fact that transcriptional activators are modular in nature. Two physically distinct functional domains are necessary to get transcription: (1) a DNA binding domain (DBD) that binds to the DNA of the promoter and (2) an activation domain (AD) that binds to the basal transcription apparatus and activates transcription.
Protein-protein interaction (1)In the yeast two-hybrid system, the known gene encoding X, is cloned into the "bait" vector. (2)In this way, the gene for X is placed into a plasmid next to the gene encoding a DNA-binding domain from some transcription factor. (3)For instance, if the gene for X is cloned into the p. Hyb. Lex/Zeo vector, X would be expressed as a fusion protein containing bacterially-derived Lex. A DBD.
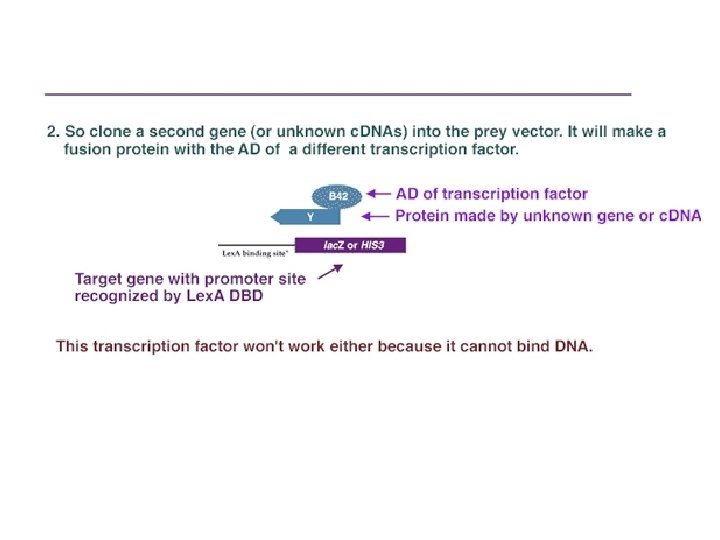
Protein-protein interaction Separately, a second gene (or a library of c. DNAs encoding potential interactors), Y, is cloned in frame adjacent to an activation domain of a different transcription factor. For instance, it could be inserted next to the DNA encoding the B 42 activation domain (AD) in a "prey" vector such as p. YESTrp 2.
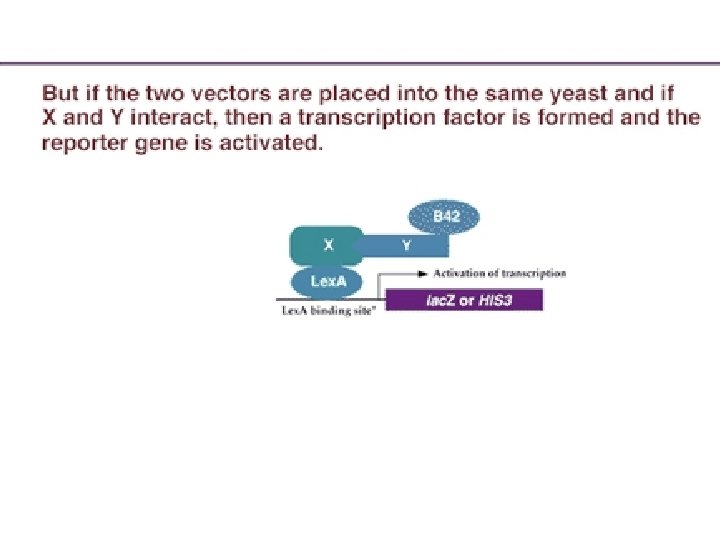
Protein-protein interaction Thus, in one strain of yeast, a known protein X is fused to the DNA binding domain of a transcription factor; and in another strain, unknown proteins are fused to the activation domain of another transcription factor. If one of the unknown proteins combines with X, it will bring the AD over to the DBD, and transcription will be activated. So the plasmids containing the "bait" (known protein/DBD) and "prey" (unknown protein/AD) are then placed into a yeast strain, where a marker gene has a promoter containing the sequence bound by the bait protein DBD.
Protein-protein interaction However, in order to form a working transcription factor, it needs the AD provided by the "prey. " The only way that it can get this activation domain is if the known protein X combines with some unknown protein Y that is carrying the AD. If the X and Y proteins interact, the B 42 AD is brought into proximity of the Lex. A DBD and transcription of the reporter gene is activated. The activation of the reporter gene can be screened by enzyme activity, light release, or cell growth, depending on the type of reporter gene activated.
Schematic of the two-hybrid system. (A). Vector is made containing transcription factor DBD plus protein X. When placed into a yeast with a reporter gene, this fusion protein can bind to the reporter gene promoter, but it cannot activate transcription. (B) A second vector is made where unknown c. DNAs are placed adjacent to the activation domain of a transcription factor. When placed into a yeast strain containing the reporter gene, it cannot activate transcription, since it has no DNA binding domain. (C) When the two vectors are placed into the same yeast, a transcription factor is formed that can activate the reporter gene –if the protein made by the second plasmid binds to the X protein.
Literature two-hybrid systems 1. Fields, S and Song, O. 1989. A novel genetic system to detect protein-protein interactions. Nature 340: 245 -246. 2. Gyuris, J. , Golemis, E. , Chertkov, H. , and Brent, R. 1993. Cdi 1, a human G 1 and S phase protein phosphatase that associates with Cdk 2. Cell. 75: 791 -803.