De 1994 a 1997 ele participava da instalao


 for analysis of")
 : Измерение плотности (air) - Density of air, (w) -")

 Conditions: Forced vibration frequency, supplied to the specimen,")
 Equipments: DRON-2 (at room temperature) DRON-2 X-ray cooper Kα-radiation (λ of")
 The electrical resistivity is very sensitive to")
 The structure of")
 Structure B 19´+ (T 2 Ni)")
 a b c Fig. 3. 3.")
 When initial Ti. Ni alloy is")
 Ist Interval: 20 -60 o. C.")
 2 Interval: 60 -100 o C.")
 3 Interval: above 100 o to")
 4 Interval: above 700. Interval: above")
 In the process of cooling, the")

")

 Fase B 2 (b) Fase R")


 A-B")
")


 Equipments: DRON-3 M Conditions: Cu-K radiations 2 angle from 25 to")


- Slides: 90
De 1994 a 1997, ele participava da instalação das prensas de alta pressão para a síntese de diamante sintético e no planejamento do setor de Materiais Superduros do LAMAV/UENF.
Модуль упругости и структурные изменения в сплавах Ti. Ni и Cu-Al-Ni при деформации и реализации неупругих эффектов 1 - State University of Northern of Rio de Janeiro (UENF), Campos, Brazil 2 - A. A. Baikov Institute of Metallurgy (IMET), Moscow, Russia
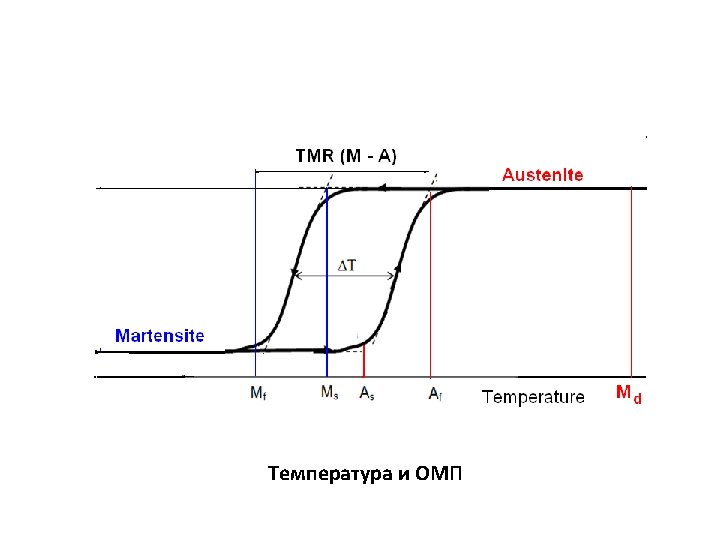
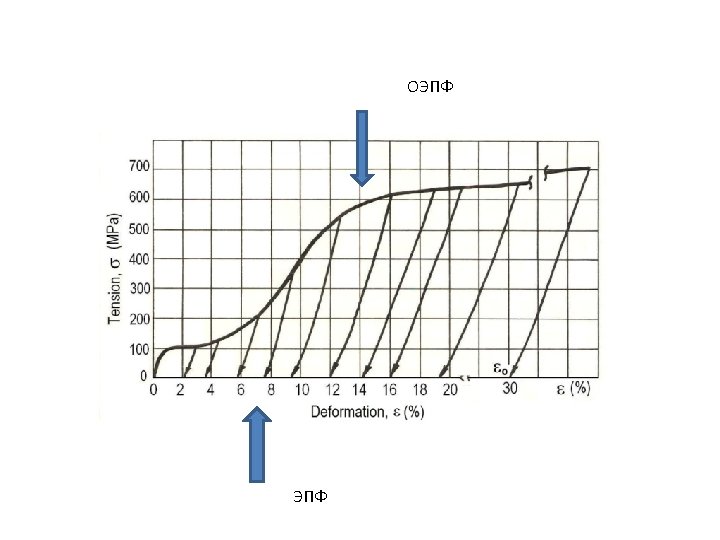
ОМП и ЭПФ Scheme of RMT - Tipical curve of deformation of SMA. Otsuka e Wayman, 1998
Figure 3. Temperature dependence of moduli E and G, Poisson’s ratio and adiabatic compressibility Ks of Ti. Ni alloy quenched from 980 o. C: (1) • - on heating and (2) o - on cooling (2) [Белоусов О. К. ].
Деформация сплавов с ОМП Martensitic transformation, and/ or martensite reorientation, acompanied by the acumulation of recuverable deformation (SME) Plastic and elastic deformation, up to fracture Elastic Deformation Elastic deformation. Hardening Типичная кривая деформации сплавов с ОМП (Otsuka e Wayman, 1998), (Huang et al. , 2005).
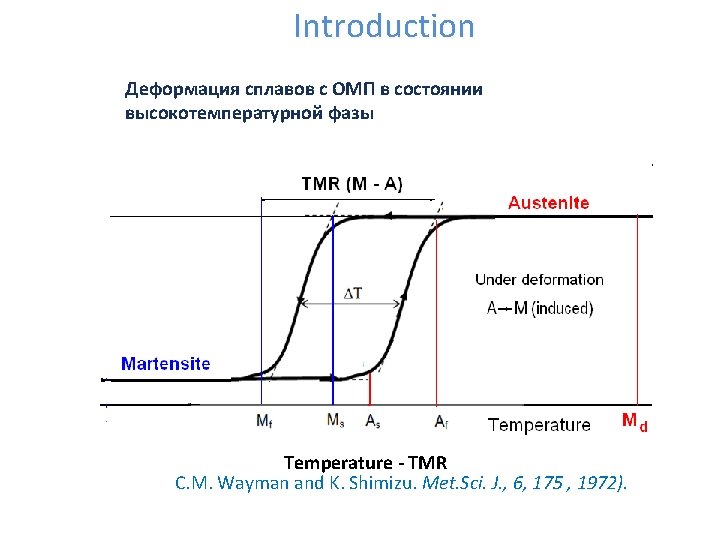
Деформация сплавов с ОМП в состоянии высокотемпературной фазы A M induced Plastic and elastic deformation, up to fracture Elastic Deformation Elastic deformation. Hardening Типичная кривая деформации сплавов с ОМП (Otsuka e Wayman, 1998), (Huang et al. , 2005).
Introduction Деформация сплавов с ОМП в состоянии мартенситной фазы M? Plastic and elastic deformation, up to fracture Elastic Deformation Elastic deformation. Hardening Типичная кривая деформации сплавов с ОМП (Otsuka e Wayman, 1998), (Huang et al. , 2005).
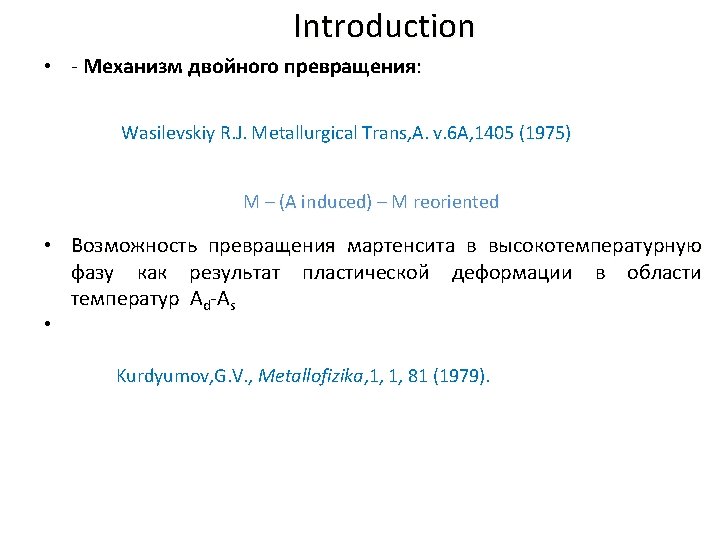
• Различные механизмы деформации сплавов с ОМП в исходном мартенситном состоянии: • - Reorientation of the martensite plates, • - Microtwinning, C. M. Wayman and K. Shimizu. Met. Sci. J. , 6, 175 , 1972). J. Perkins. Scripta Met. , 9, 121 (1975). K. N. Melton, J. Mercier, Met. Trans. (A), 9 A, 1487(1978). -Martensite-martensite transformations : -Martensite-martensite transformations Borisova, Monasevich and Paskal’, Metallofizika, 5, 2, 66 (1983).
Introduction Wasilevskiy: “under stress in the temperature range Ad-Mf the martensite can transform to a transitional high temperature phase, since that phase is unstable in the absence of stress, it transforms to martensite of a new, favorable orientation” M – (A induced) – M reoriented Temperature - TMR
2 - Material and Methods Ti-54%mass%Ni Пруток 20 mm Ti-54%mass%Ni rod произведенный в ВИЛС и обработанный в ИМЕТ (1 hr at 500 o. C и охлаждение на воздухе) Chemical composition of Ti. Ni rod 20 mm (wt. %) Ni Fe Co Si O C N H Ti 54, 0 0, 12 0, 04 0, 05 0, 15 0, 003 0, 01 0, 003 Res. Fig. 2. 1. Samples of Ti. Ni for a deformation testing at room temperature.
Деформация Ti. Ni Fig. 2. 3. Generalized curve of tensioning for Ti-54 wt. %Ni alloy, during plastic deformation at room temperature with controlled unloaded up to state without any elastic component and initial deformation ( o) varied from 2% to 30%.
Fig. 2. 6. Scheme of cutting of the test specimens: (1) for analysis of modulus of elongation, (2) X-ray thermal analysis, (3) dilatometric analysis and (4) structure analysis
Измерение плотности ( ) : Измерение плотности (air) - Density of air, (w) - Density of distillated water, P (air) - weight of sample in the air P (w) weight of sample in the water
Дилатометрия The SME and RSME of Ti. Ni were studied by dilatometry during heating/cooling cycles between – 150 o. C and + 300 o. C. Equipment: Dilatometer UIP-70 M Conditions: heating at the rate of 0. 08 o. C/sec Дифференциальный термический анализ (DTA) DTA was used to determining the critical temperatures of the RMT occurring in the Ti. Ni alloy, in its initial state and deformed states. Equipment: ATVU-10 A machine (Russia) Conditions: heating at the rate of 0. 08 o. C/sec, TG 00 titanium as a standard.
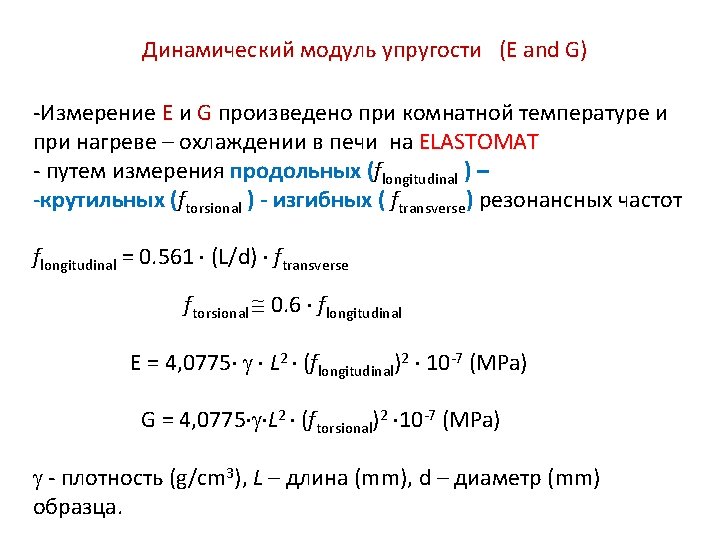
Измерение динамического модуля (E and G) Conditions: Forced vibration frequency, supplied to the specimen, were tens : k. Hz maximum tension within 10 -1 MPa relative deformation of the order of 10 -3 -10 -5 %. The frequency range of the equipment is 0. 6 -26 k. Hz. -
Дифракция X-Ray (XRD) Equipments: DRON-2 (at room temperature) DRON-2 X-ray cooper Kα-radiation (λ of 0. 154178 nm), Angular range 2 = 36 -48 o o C and cooling to -160 o C ) URS-50 -IM (heating to +250 URS-50 -IM with the low-temperature attachment KRN-190, with a high temperature attachment for heating to 400 o. C Angular range 2 = 36 -46 o in filtered copper K -radiation with isothermal holding of about 10 min.
Measuring of the Electrical Resistivity ( ) The electrical resistivity is very sensitive to phase changes in materials The resistivity ( ) of samples of the Ti. Ni alloy was determined using a Wheatstone bridge circuit with a constant current source (A), resistance box and a standard resistor (N). Measuring a voltage drop on the sample (Vx), the area of its cross section (S) and a length of measured section (L), was determined by equation : L -length of a measured section. S- area of cross section Fig. 2. 5. Scheme of measuring of electrical resistivity
3 - Results Ti. Ni alloy - Initial annealed state (no-deformed) The structure of the Ti. Ni alloy, at room temperature, in its initial annealed state, was a martensite B 19´ and fine inclusions of a intermetalic Ti 2 Ni. (a) 20μm (b) 10μm Fig. 3. 1. Microstructure of the Ti. Ni alloy in initial state The surface after polishing suffered chemical attack by the solution (HF+ HNO 3+H 2 O). NEOPHOT-32. Differential interference. Magnification 320 X (a) and 500 X (b)
Ti-54 wt. %Ni alloy. Initial annealed state (no-deformed) Structure B 19´+ (T 2 Ni) Modulus E, GPa G, GPa 59 -61 21 -23 Electrical resistivity, , . cm Density g/cm 3 As - Af, o. C Ms-Mf o. C (82 -84). 10 -6 6, 4 55 -95 53 -38 Fig. 3. 2. Dilatomentric analysis (heating and cooling) (a) and DTA (heating) (b) of Ti-54 wt. %Ni alloy, in the initial non deformed state.
Ti-54 wt. %Ni alloy. Initial annealed state (no-deformed) a b c Fig. 3. 3. XRD of the non-deformed Ti-54 wt. %Ni alloy during heating (a) and cooling (c), and the graphic presentation of RMT (from DRX) (b)
Ti-54 wt. %Ni alloy. Initial annealed state (no-deformed) When initial Ti. Ni alloy is heated, E and G are changing abnormally 96 GPa Increasing Rising to 85 GPa Going down to 49 GPa 25 GPa 31, 5 GPa 20, 3 GPa Fig. 3. 4. Moduli E and G of the non-deformed Ti-54 wt. %Ni alloy during heating.
Ti-54 wt. %Ni alloy. Initial annealed state (no-deformed) Ist Interval: 20 -60 o. C. Lower modulus of elongation at the first stage is due to “softening” of the martensite lattice, according to Fedotov and Nakanishi (Fedotov 1964; Nakanishi 1979). Fig. 3. 5. Comparison of the DRX and Moduli E and G of the non-deformed Ti-54 wt. %Ni alloy, during heating.
Ti-54 wt. %Ni alloy. Initial annealed state (no-deformed) 2 Interval: 60 -100 o C. DTA and DRX show that in these temperature range , the martensite lattice B 19’ is rearranged into B 2 phase; E is rising abruptly Fig. 3. 5. Comparison of the DRX and Moduli E and G of the non-deformed Ti-54 wt. %Ni alloy, during heating.
Ti-54 wt. %Ni alloy. Initial annealed state (no-deformed) 3 Interval: above 100 o to 700 o C. The material that had undergone MT (B 19’ B 2) is strengthened when the temperature increases. In spite of the lattice of B 2 being softened under the influence of heating, E continues to grow when the material is heated to 700 o Fig. 3. 5. Comparison of the DRX and Moduli E and G of the non-deformed Ti-54 wt. %Ni alloy, during heating.
Ti-54 wt. %Ni alloy. Initial annealed state (no-deformed) 4 Interval: above 700. Interval: above 700. At higher temperatures, E begins to decrease, indicating complete stabilization of the crystal lattice of B 2 and its resistance to MT. B 2 phase will not suffer MT under stress. Fig. 3. 5. Comparison of the DRX and Moduli E and G of the non-deformed Ti-54 wt. %Ni alloy, during heating.
Ti-54 wt. %Ni alloy. Initial annealed state (no-deformed) In the process of cooling, the moduli E and G are changed in a reverse, with temperature hysteresis equal to the same of RMT. гистерезис Fig. 3. 6. Temperature changes of the modulus E
Ti-54 wt. %Ni alloy. Deformed state Fig. 3. 7. Deformation of Ti. Ni alloy to different initial strain ( o) Fig. 3. 8. DRX. Structural changes of Ti. Ni under deformation in initial state (a), and deformed to o 2, 2% (2), 5 -7% (3), 12, 2% (4) 19% (5) and 30% (6)
Table 3. 1. XRD analyses of Ti-54. 0 wt. %Ni alloy ( o=6. 9%) DRON-2, cupper Kα-radiation 2 o * Intensity (relative) 39. 55 41. 45 42. 50 m. m. s. s. 45. 33 48, 27 60, 25 61, 58 m. w. w. v. w. 77, 75 w. , diffuse 80, 75 87, 08 89, 20 94, 67 v. w. w. d, nm HKL ** 0, 2278 0, 21799 (002) B 19’ 0, 21269 0, 19982 0, 18872 0, 15371 0, 15055 (300)R (404)R (125)R (400)R 0, 12285 0, 11902 0, 11192 0, 10979 0, 10484 (125)R (404)R
Ti-54 wt. %Ni alloy. Deformed state • Measured in the interval 2 o =35 -100º • R-phase (trigonal structure, P 3) ** Interplanar spacings of the transitional R-phase were identified according to date in: "Structure studies of the R-phase using X-ray diffraction methods". Morawiec, H. , Goryczka, T. J. Alloys Compds. 367, 137 (2004) (01 -072 -3504). Martensite B 19´ (monoclinic structure, P 2 Martensite B 19´ (monoclinic structure, 1/m) Interplanar spacings of the martensitic B 19’-phase were identified according to date in: “Crustal structure and internal defects of equiatomic Ti. Ni martensite”, Otsuka K. , Savamura T. , Shimizu K. Physics Status Solidi (A) (1971) v. 5, n 2, p. 457 -460 High temperature B 2 phase (BCC ordered Cs. Cl, ) Interplanar spacings of the B 2 -phase were identified according to date in: “Gitterkonstantantes der kubisch raumzentrien phasen Fe. Ti, Co. Ti, Ni. Ti” Stuewe H. -P. , Shimomura, Y. Z. Metallkd. 51, 180 (1960) ( 03 -065 -4572)
Ti-54 wt. %Ni alloy. Deformed state R-phase (a) Fase B 2 (b) Fase R Fig. 3. 9. R phase Trigonal structure, P 3. a. R = 0, 738 nm, c. R = 0, 532 nm. is caracterizade by highes velues of eletrical resistivity is coherent with B 2 and B 19’ phases
Cooling Ti-54 wt. %Ni alloy. Deformed state Fig. 3. 10. Structural changes of Ti. Ni alloy under deformation (a), XRD of deformed Ti. Ni alloy ( o=6, 9%) during cooling (b)
Ti-54 wt. %Ni alloy. Deformed state The new lines that appeared after deformation were identified as distorted high-temperature R-phase (Morawiec, H. , Goryczka, 2004) The appearance of a transition R-phase is characterized by : • an increase in resistivity, • and splitting in two lines near Ms • anomalous change in other physical parameters Dautovich and Pardy, 1965; Mukerdzhi, M. Chandresieren and F. Milillo 1979; Fedotov, Matlakhova at all, 1988; Morawiec, H. , Goryczka, 2004.
Ti-54 wt. %Ni alloy. Deformed state The modulus E measured at room temperature (E 20), first falls ( o=2 -3%) and then grows, even though the degree of deformation is increased to o=5 -7%. An increase in the modulus is typical for the formation of intermediate phases, such as the -phase in titanium alloys. The value of E returns to fall as the plastic component builds up with o >7% In Ti. Ni based alloys the Rphase is considered to be intermediate, but the unstable B 2 phase is distinguished by a lower value of the modulus E. (Kovneristyy, Fedotov and Matlakhova, 1984, 1985) Fig. 3. 11. Influence of the initial deformation ( o) on the modulus E of deformed Ti. Ni
Ti-54 wt. %Ni alloy. Deformed state Within the “pseudoyield” plateau and the initial stage of hardening up to o=7%, the deformation caused an increase in a resistivity of Ti. Ni, increasing in proportion to the degree of deformation from (82 -84)x 10 -8 . m to (98100)x 10 -8 . m, but changes very little with further rise of . m o to 19%. Higher deformation, to 30%, caused more increase of electrical resistivity , up to (107 2). 10 -6 . cm, . cm due to plastic deformation and phase changes. Fig. 3. 12. Variations of electrical resistivity ( )as a function of o (1) and after SME (e). (2)
Ti-54 wt. %Ni alloy. Deformed state After heating to 300 o C and cooling to room temperature, as a result of the removal of lattice distortion and realization of SME, the resistivity of specimens deformed to o=7% is almost restored to the value of the undeformed material. The structure of this material is phase B 19’. With larger initial deformation, the resistivity ( ) also falls because of the realization of the SME (with removal of lattice distortion), but there is a residual increase in proportional to retained deformation o, and R-phase is observed in addition to the B 19’martensite. Fig. 3. 12. Variations of electrical resistivity ( )as a function of o (1) and after SME (e). (2)
Ti-54 wt. %Ni alloy. Deformed state Fig. 3. 13. Variations of electrical resistivity ( ) (1), modulo E(20 C) (2) and E(min) (3) in function of o, and after SME (4)
Ti-54 wt. %Ni alloy. Deformed state Dilatometric analysis of annealed Ti-54 wt. %Ni alloy RMT are evidenced on the dilatation curves of the undeformed Ti. Ni alloy in the form of very slight inflexions. Fig. 3. 14. Dilatomentric analysis of the Ti. Ni alloy. Initial non-deformed state.
Ti-54 wt. %Ni alloy. Deformed state Dilatometric analysis of deformed Ti-54 wt. %Ni alloy Fig. 3. 15. Dilatometric curves of Ti. Ni initially deformed to different degree of initial deformation ( o): 2, 2% (a), 4, 2% (b), 7, 3% (c), 11% (d), 19% (e), 30 (f)
Ti-54 wt. %Ni alloy. Deformed state SME can be picked out: Stages (A-B) A-B and (C-D), C-D where the extended specimen contracts slightly E Stage (B-C) - where there is intensive shortening and the accumulated strain is recovered, characterizing the SME Stage (D-E) where thermal expansion takes place. The ordinate of the point D corresponds to the largest value of the SME for the given strain - h/ho (ho is the size of the deformed specimen, and h – the change in size) Fig. 3. 16. Curves of recovery of SME, accumulation of deformation of RSME (a), DTA (b) and volume fraction of B 2 -phase (c) in alloy Ti-54. wt. %Ni after tension of o 12, 3% during two heating and cooling cycles. ( Kovneristyy, Fedotov, Matlakhova& Oleinikova, 1986)
Ti-54 wt. %Ni alloy. Deformed state RSME During cooling after SME, the specimens 1) at first become slightly shorter, due to thermal contraction, and 2) when Ms is attained, the direct MT is accompanied by an anomalous increase in length of the specimen. During repeat heating, there is an intensive endothermal reaction and contraction, associated with the RSME and RMT, However the critical temperatures fall for largest initial deformations (20 -30%). Fig. 3. 16. Curves of recovery of SME, accumulation of deformation of RSME (a), DTA (b) and volume fraction of B 2 -phase (c) in alloy Ti-54. wt. %Ni after tension of o 12, 3% during two heating and cooling cycles. ( Kovneristyy, Fedotov, Matlakhova& Oleinikova, 1986)
Ti-54 wt. %Ni alloy. Deformed state Deformation and SME – RSME. Ti-54 wt. %Ni alloy When o rises to 7%, coinciding with the end of the “pseudo- plateau ”, SME max exhibit 4, 8 -4, 9% and after then falls. When o rises to 12%, coinciding with the end of the hardening stage (above the second yield point), the RSME reaches its the highest value (1, 8 -1, 9%), and falls with further growth of o. Fig. 3. 17. Values of SMEmax, SME 20 C and RSME of the Ti. Ni alloy in a function of o
Ti-54 wt. %Ni alloy. Deformed state Deformation raises the starting and finishing points of the intensive endothermic reaction (As-Af)(DTA), and intensive recovery of the accumulated deformation (As-Af)(SME). Up to o=7%, all three stages of recovery (A-D) are completed at the temperature corresponding to the peak of the endothermal reaction (A f(DTA)). Fig. 3. 18. Comparison of the Dilatometric results and DTA
Ti-54 wt. %Ni alloy. Deformed state While at o >7%, the temperature, at which SME is complete, continues to rise, so that by Af (DTA) only 2 first stages (A-B, B-C) have had time to take place; the stage (C-D) is included in the temperature range of the ascending branch of the DTA curve. Figure 3. 19. Influence of the initial deformation ( o) of the Ti-54. wt. %Ni alloys on the critical temperatures of SME, RSME and DTA.
Ti-54 wt. %Ni alloy. Deformed state Plastic deformation does not alter the original pattern of the temperature dependence of E, but caused the E min. to shift towards higher temperatures and to come down at the stage of “softening”. Deformation up to 7% shifts E min noticeably, at higher deformation it changes but slightly. It can be noted that, depending on a o, critical temperatures of E min , DTA and dilatomentric analyses change similarly. Fig. 3. 20. Мodulus E of initially deformed specimens of Ti-54. wt. %Ni alloy, during primary heating (when SME is realized).
Ti-54 wt. %Ni alloy. Deformed state Cooling, as well as reheating of once heated specimens showed that the value of E min. goes down when the initial deformation o grows. Cooling 2 -st Heating Cooling Figure 3. 21 Changes in the modulus E of Ti-54. wt. %Ni alloy, during cooling and secondary heating and (when the RSME is realized).
Ti-54 wt. %Ni alloy. Deformed state The course of changing of the values of E on the 2 -st heating follows the same rout as during the first heating, but shifting of Emin. with temperature is less significant. 1 -st Heating 2 -st Heating Figure 3. 22. Changes in the modulus E of Ti-54. wt. %Ni alloy, during prime and secondary heating (when SME and RSME are realized).
Ti-54 wt. %Ni alloy. Deformed state Notable shifting of Emin. results from the SME deformation” , while the absolute value of the E is due to the residual plastic deformation, retained by the material, causing by internal oriented micro-stresses. 1 -st Heating 2 -st Heating Figure 3. 22. Changes in the modulus E of Ti-54. wt. %Ni alloy, during prime and secondary heating (when SME and RSME are realized).
Ti-54 wt. %Ni alloy. Deformed state Depending on o , the density of the deformed Ti. Ni alloy changes due to micro defects in its structure, more noticeably after o >12%. Fig. 3. 23. Influence of initial deformation ( o ) on the density of Ti-Ni alloy.
• Сплав Cu-Al-Ni • structural changes, modulus of elongation and deformation behavior, during cyclic deformation by compression of a monocrystalline Cu-Al-Ni alloy • Сritical temperatures: Ms=51 o. C, Mf=20 o. C, As=40 o. C, Af=65 o. C • The monocrystalline Cu-13, 7%Al-4, 2%Ni alloy was fabricated in the form of a cylindrical bar 4 mm (at the “Memory Crystals Group”, Russia) and was studied in initial state. Fig. 2. 2. Monocrystalline Cu-13. 7 Al-4. 2 Ni (wt. %) alloy in as-received state
Monocrystalline Cu-13. 7%Al-4. 2%Ni. Initial state Fig. 3. 24. Microstructure of the monocrystalline Cu-13. 7%Al-4. 2%Ni alloy in a initial state Initial state : two metastable phases: Martensite ´ 1 + R phase Martensite phase ´ 1, (with 18 R orthorhombic structure) Rhombohedral ordered Al 7 Cu 4 Ni phase, called here as R phase.
X-Ray Diffraction (XRD) Equipments: DRON-3 M Conditions: Cu-K radiations 2 angle from 25 to 75º scanning steps of 0. 03º per 3 s, operating at room temperature Differential Scanning Calorimetry (DSC) DSC was used to determining the critical temperatures and intervals of the RMT occurring in the Cu-Al-Ni alloy Equipment: TA-INSTRUMENTS - DSC-2010 Conditions: heating at the rate of 0. 08 o. C/sec
Monocrystalline Cu-13. 7%Al-4. 2%Ni. Initial state Нагрев - КТ Охлаждение - КТ Исходное состояние Fig. 3. 24. XRD of the Cu-13. 7%Al-4. 2%Ni alloy After a ½ cooling cycle: the structure changes and displays the martensite ´ 1, the type Cu 3 Ti ordered martensite ´ 1, the rhombohedric R phase, and R traces of the type DO 3 high temperature β 1 ordered phase. ordered After a ½ heating cycle, the martensite ´ 1, as the main, the high temperature 1 and traces of ´ 1 and R phase
Monocrystalline Cu-13. 7%Al-4. 2%Ni. Initial state. DSC During heating Reversive MT ( 1+ ´ 1) 1 takes place from +38. 2 o. C (As) to +68 o. C (Af) This is an endothermic process associated with a phase transformation, Enthalpy of 9 J/g. with an “onset” at +51. 4 o. C (Ao) and an endothermic peak at +54. 7 o. C (Ap), which corresponds to a maximum heat flow. Upon cooling, the direct 1 ( 1+ ´ 1) MT takes place from +51. 4 o. C (Ms) to 20 o. C (Mf) an “onset” at +47. 7 o. C (Mo) and exothermic peak at +42 o. C (Mp). Enthalpy of 8. 8 J/g. Fig. 3. 25. DSC analysis of the Cu-13. 7%Al-4. 2%Ni alloy
Deformation of Cu-Al-Ni by Compression Monocrystalline Cu-Al-Ni alloy was submitted to compression cycles, succeeded by determination of Young modulus, E, from the curves and analysis of structure. Optical Microscopy and XRD displayed the evolution of the structure and the existence of phase transformations during cycling tests. Fig. 2. 4. Generalized curve of cyclic deformation by compression of Cu-Al-Ni alloy, at room temperature with controlled unloaded up to state without any elastic component and initial deformation ( o) varied from 1% to 9%.
Monocrystalline Cu-13. 7%Al-4. 2%Ni. Compression Cyclic Tests The curves were consecutively shifted by the value of residual strain, obtained in the previous compression cycle of the sample. Fig. 3. 26. Stress-strain curves of monocrystalline Cu-Al-Ni alloy obtained in each of the 7 test cycles
Monocrystalline Cu-13. 7%Al-4. 2%Ni Compression Cyclic Tests Deformation curves of the first 5 cycles are characterized by the elastic region and pseudo-yield plateau, that corresponds to the compression stress of 70 -90 MPa. Moreover, with stress increasing up to 113 MPa, the second, elastic region appears in the 5 -th cycle (b). In the 6 -th and 7 -th cycles (compression stress being 412 and 830 MPa, respectively) the elastic mechanism governs the alloy deformation. Fig. 3. 26. Stress-strain curves of monocrystalline Cu-Al-Ni alloy obtained in each of the 7 test cycles
Monocrystalline Cu-13. 7%Al-4. 2%Ni Compression Cyclic Tests Values of the elastic modulus E was calculated for each test cycle at the compression of the alloy. This data is in good agreement with evolution of microstructure that take place at the pseudo-yield plateau, due to the martensite reorientation and undergoing reversible martensitic transformation (RMT). Fig. 3. 27. Variations of the Modulus E of the Cu-13. 7%Al-4. 2%Ni alloy as a function of deformation.
Monocrystalline Cu-13. 7%Al-4. 2%Ni Compression Cyclic Tests Fig. 3. 28. Comparison of the modulus E and structure (DRX) of the Cu-13. 7%Al-4. 2%Ni alloy as a function of accumulated formation during compression cyclic tests.
Monocrystalline Cu-13. 7%Al-4. 2%Ni Compression cyclic tests Structure of the original alloy : martensitic 1 and high temperature 1 phases , with the traces of martensitic 1 and R (Al 7 Cu 4 Ni) phases. After 4 cycles of deformation the amount of β 1 and R (Al 7 Cu 4 Ni) phases increases significantly. RMT under deformation: 1+ 1+(( 1+R)) β 1+R This process is accompanied by a decrease in the elastic modulus of the alloy to 63 GPa. In subsequent cycles of deformation, phase composition of the alloy is not changed; it is represented by R and 1 phases, however, the elastic modulus rises sharply up to 190 GPa due to the increase of the R-phase volume fraction.
Monocrystalline Cu-13. 7%Al-4. 2%Ni Compression cyclic tests The microstructure of the alloy in the initial state (Fig. 4 a) has a typical martensite relief that changes drastically after the 7 th compression cycle (Fig. X b, c) a b c Fig. 3. 28. Relief of the monocrystalline Cu-13. 7%Al-4. 2%Ni alloy - in initial state (a) and after 7 th compression cycle (b, c)
Conclusions • Accumulation of the reversible deformation in SMA-s (recoverable upon heating in the course of SME) occurs providing low lattice stability of the initial phase, and exhibits low values of moduli (E and G), they become very small at the critical points of RMT. • During deformation, within the “pseudo-yield” plateau, the initial phase is distorted to its limit until the appearance of a new coherent phase been preferentially oriented, thus accumulating a “memory“ deformation in the material. • When martensite is deformed, the recoverable deformation is caused by its lattice distortion and transformation to a high-temperature (or transitional) phase, with preferential lattice orientations. • Changes in properties and the effect of SME itself are associated with the specific distorted structure, formed in the material at the stage of the “pseudo-yield” plateau. After heating to the temperature exceeding Af for the first time already distortions disappear.
Conclusions • Reversible deformation of the SME retains in unloaded alloys due to its accommodation and this requires additional energy for its recovery, causing the temperatures, at which RMT occurs and the shape begins to get restored, to grow. It also promotes the increase in resistivity and the value of the SME deformation, being restored in proportion to initial deformation o until the ultimate extent ( o =7 -8%) is reached. • While the distortions causing the SME are caused by the applied stress, for the RSME similar lattice distortions are due to internal oriented stress, arising as a result of plastic deformation involving the dislocation mechanism, at the strengthening stage (up to 12 -13%, for Ti. Ni). • The dislocation component of plastic deformation, which grows strongly in polycrystalline Ti. Ni material beyond the “pseudo-yield” plateau, is accumulated to various degrees in individual grains because of their different orientations relative to the applied force, This has an effect of the shift of Af (SME) and Mf (RSME), in deformed alloy with initial deformation o more than 12%.