Computer Science and Social Science Paradigms for deriving


 • Identifying relationships (Eagle et")


…")

 + correction for previous miss by")


 For Google Flu and CDC Time Series")


- Slides: 68
Computer Science and Social Science • Paradigms for deriving insights from data
Big data and the social sciences
There has been a fundamental shift in the opportunities in data collection about humans.
Our digital breadcrumbs… • • E-mail Twitter Instant messaging Text messaging Call data records (from cell phones) Link structure among websites (google algorithm) Google searches What can data like these tell us?
Phones • Mapping societies (Onnela et al PNAS 2007) • Identifying relationships (Eagle et al PNAS 2009) • Identifying behavioral change associated with the flu (Madan et al Ubicomp 2010) • Emergency-related behaviors (Altshuler et al 2013 Jnl Stat Physics; Margolin et al ICWSM 2013) • Macro-economic change (Toole et al 2015)
Social Media • Real time tracking of opinions during debates (Lin et al WWW 2013) • Studying dynamics of competing hashtags on Twitter (Lin et al ICWSM 2013) • Studying unstructured text to detect “invisible” networks (JAIST 2015) • Detecting political spin (Tsur et al ACL 2015)
Internet as experimental platform • Online field experiments with Members of Congress (various papers with Neblo, Esterling and others in APSR, POQ, PNAS etc) • Experimenting with personalization with Google, Travelocity, etc • Volunteer. Science. com
There has been a fundamental shift in the opportunities in data collection about humans. But: the social sciences have been slow in getting on the boat
We need a new synthesis
Computer Science Create features from large, messy data Apply algorithms, iterate to best parameters Evaluate fit
Social Science Collect ‘small’ datasets Apply social theory and inferential statistics Evaluate fit
Computational Social Science Make population-level inferences Apply models, iterate to best parameters Create features using social theory Search for representative data hidden in big data
Social science issues • Static • Small scale, not system level • Decontextualizes behavior re social networks/time/space • Little emphasis on prediction (and often does badly) • (Largely) ignores vast majority of existing data on humans
Computer science issues • Often ignores “validity” issues re data • Underemphasis on curation of data/producing powerful subsamples • Emphasis on prediction over interpretability • Ignores emergent social part of sociotechnical systems • Ignores algorithmic biases
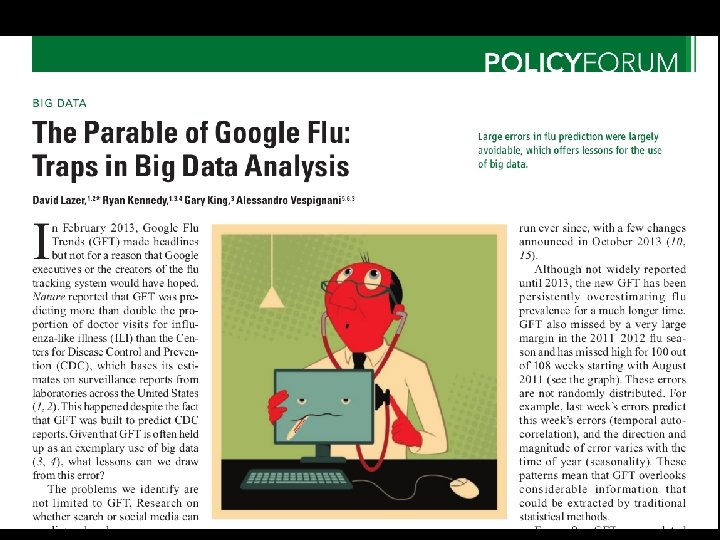
Google flu trends
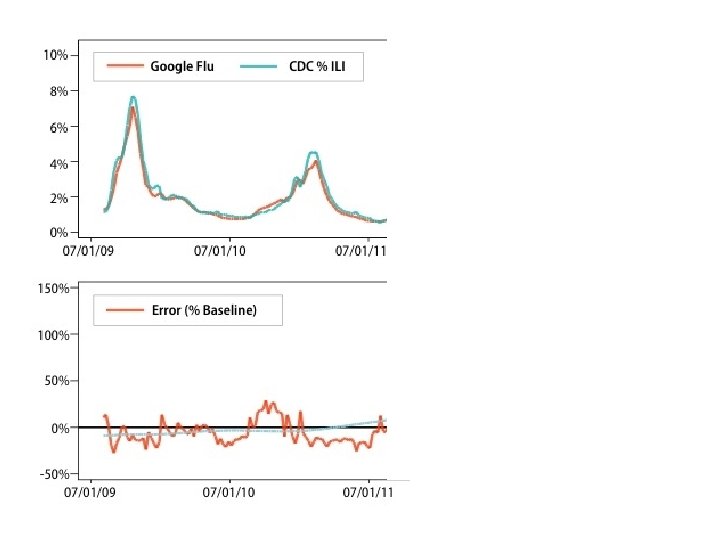
Google flu trends • Examine 50 m search terms • Which ones are most heavily correlated with flu prevalence, as measured by CDC regional data?
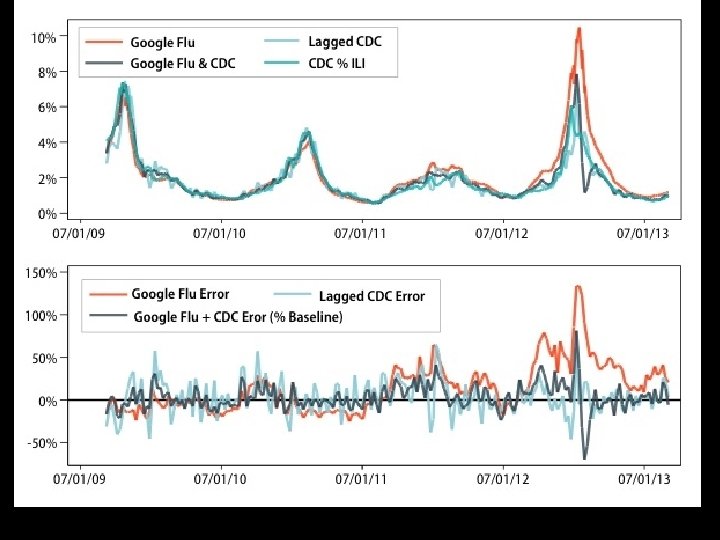
Why did google flu miss? Big data hubris. And it was the algorithm’s fault.
Big data hubris
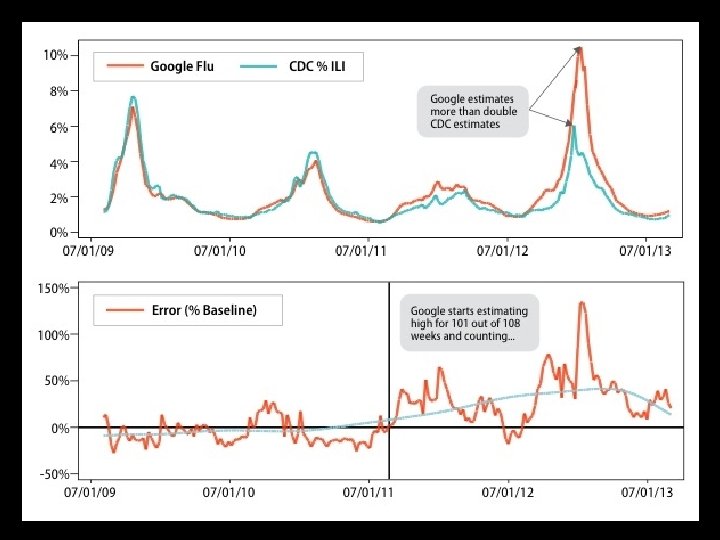
The hubris • Google flu is promoted as more up to date than CDC data • The search terms were identified through brute force “what correlates with CDC data” (50 m search terms against 1152 data points) initially leading to some spurious relationships, and then changed once (and then again in Oct 2013)
Overfitting (in 2008 paper)…
The hubris • Google flu is promoted as more up to date than CDC data • The search terms were identified through brute force “what correlates with CDC data” (50 m search terms against 1152 data points) initially leading to some spurious relationships, and then changed once (and then again in Oct 2013) • But lagged model based on t-3 does better than Google flu
Modified model… • GFT + lagged CDC (t-2) + correction for previous miss by GFT
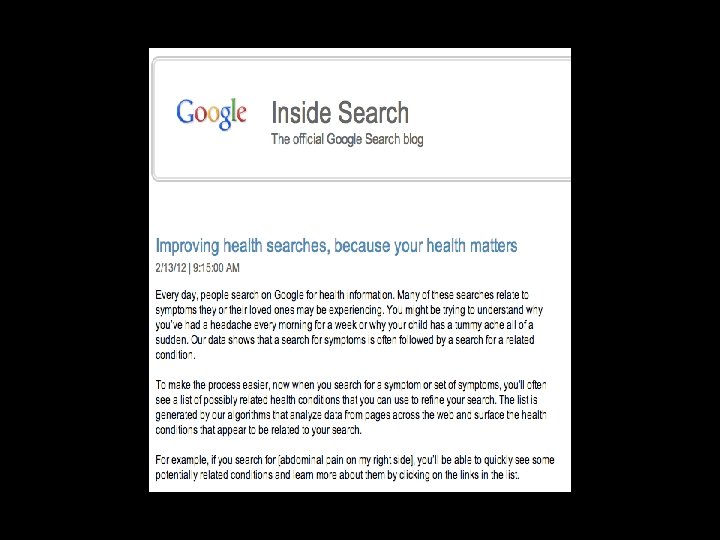
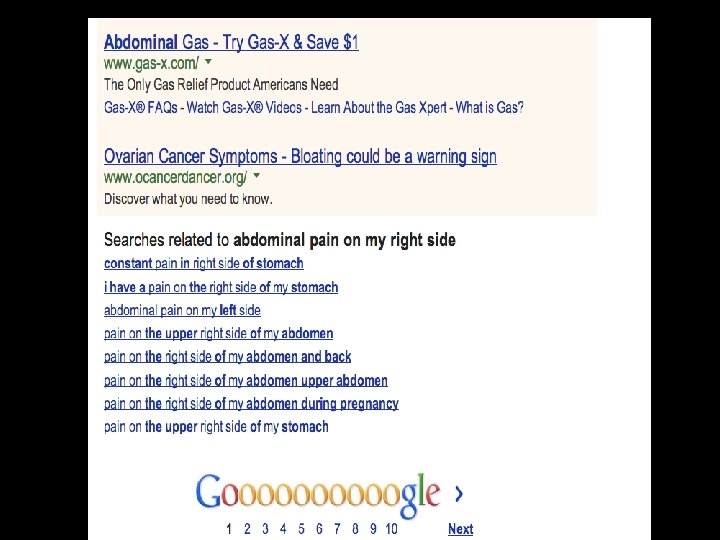
The algorithm
Trends: abdominal pain on my right side
Getting Google Flu’s Search Terms • Google Correlate has a link labeled “…match the pattern of actual flu activity (this is how we built Google Flu!)” • We conducted four Google Correlate searches based on the following time-series: – The CDC % ILI data from 2003 to present. – The CDC % ILI data from 2003 to 2009 (the training period for Google Flu). – The actual Google Flu national time-series. – The Google Flu national time-series post-2010 (when it went off the rails).
Search Prevalence (Top 50 From Google Correlate) For Google Flu and CDC Time Series GFT is heavily tilted toward remedies
Catching the Google flu: lessons learned • Signals from sociotechnical systems are constantly in flux, to not build that into analyses is statistical hubris. • Big data can overwhelm “small” data • Focus big data on what we don’t know (spatial granularity) • We need to understand behaviors cultivated on sociotechnical systems • The technical part of sociotechnical is worthy of study
Catching the Google flu: lessons learned • There needs to be more transparency in the methods • Big data requires multidisciplinary teams • Train computational social scientists • Develop appropriate infrastructures for 21 st century social science
Work in progress… • Using Twitter to predict polls
Twitter • The good: – Runs 24/7 – Rich source of opinions, discussion, networks • The bad: – Unrepresentative of the voting public – Bots and organizations – Skews young, urban, Democrat
Overview • Goal: a barometer of public opinion that runs in real time, provides a polling signal at fractional cost. • Challenges: validity, representativeness of the signal. • Our approach: matching, smoothing, reweighting. • Takeaways: Potential to complement traditional polls.
Matching Twitter to Voter data • Collaboration with vendor to gain access to voter records for Iowa and New Hampshire • Objective: link voter data to Twitter handles • Method: start with unique names in voter data, and link to data in Twitter accounts.
Creating Predictive Features using Tweets • Goal: create predictive features from Twitter data that are not biased vis-a-vis voters. • Challenge: registered voters are diverse, and Twitter skews young, urban, Democrat. Old, rural, and conservative voters may be sparse. • Our approach: multilevel regression with poststratification (Wang et al 2014)
Example: Clinton in IA Raw Twitter Mentions Smoothed and Weighted Twitter Mentions Note: variables are only scaled to mean zero and standard deviation 1.
Example: Trump in IA Raw Twitter Mentions Smoothed and Weighted Twitter Mentions Note: variables are only scaled to mean zero and standard deviation 1.
Predictors • Mentions in tweets • Partisanship of user * partisanship of candidate • Sentiment (using crowd-sourced dictionary) • Retweets • Prior polls (7 day lag)
Modeling • Strategy: use features created by multilevel regression with poststratification to predict polling margins. • Gradient stochastic boosting • Tried: least squares, boosted least squares, random forests, partial least squares.
Data • • • IA: 1, 212 voters NH: 382 voters Democrats-580, Republicans-514, Ind-500 Men-871, Women-708 Race: Asian-12, Black-16, Hispanic-11, White 1545
Model Performance w/o polls • Predicts ~80% of the variance out of sample • Improves error of null model by ~55%
Determining a Benchmark Model • What is the appropriate benchmark model? • Challenges: – poll aggregation produces very high day-to-day autocorrelation by design, ~98% – difficult to make improvement over short intervals • Our Approach: – Use naïve AR 1 model (w/ week-long lags) as a benchmark
Benchmark Model •
Clinton in IA: Benchmark Model
Clinton in IA: Our Model
Trump in IA: Benchmark Model
Trump in IA: Our Model
Sanders in IA: Benchmark Model
Sanders in IA: Our Model
Comparison: Our Model vs. Benchmark •
Model Performance • Reduces error of benchmark models by ~8% • Average error 3. 81 points in out of sample contest compared to 4. 14 in benchmark • Captures variance in polls without relying on prior polls. • Applications: – Fill in where polls less dense – Provide real-time complement to polls
Next Steps • Reducing sparsity: using free text mentions rather than @mentions only. • Increase sample size through more powerful matching • Better features: ensembles of sentiment • Expand to other states and national sample • Predict opinion across interesting subgroups (e. g. women, latinos). • Use same panel to predict other things
Key ingredients • Development of tiny subsample of Twitter data, but to homogeneous sample of individuals with known attributes • Develop a panel • Extract features using computational methods • Application of advanced applied stat methods from social sciences • Predictive models from machine learning methods
Mobilization ecosystem
Query name-words Names 1. No match 2. One match 3. Multiple matches Voter Profiles Twitter Profiles Locations 1. To US location 2. To foreign location 3. To unknown location Example 1: 25 K voters with unique names -2300 with one match -1300 to unknown location -474 to foreign locations -342 exact match to listed state 1. To same state 2. To other state
Multilevel Regression with Poststratification • Poststratification: multiply smoothed estimate by weights based on occurrence of each person-type in the population of interest. Unrepresentative Twitter data Urban Population weights Rural Urban Young Old Rural
Directed tweets • Democratic voters –> Democratic candidates: – 1896 • Democratic voters –> Republican candidates: – 404 • Republican voters –> Republican candidates: – 2509 • Republican voters –> Democratic candidates: – 262
Polling Data – Raw
How to aggregate the Polls? • Challenge: Polls are noisy and intermittent, with high density closer to election. • Approach: Weighted daily averages as compromise between: – recency of poll – sample size