Color Inserts Introduction of Surface Chemistry and Catalysis

 An astronaut representing the")


 and C 8")

 A scanning tunneling microscope image of the hydrogen pretreated diamond")
, (110),")
 crystal face obtained from LEED")
 stepped surface. The relative displacements (in Angstrom)")
 surface. The red arrows")
, sulfur-chemisorption-induced restructuring of the Fe(110) surface. The red arrows")
 surface obtained by LEED surface crystallography.")
 The O surface structure on Ni(100); (b) the O chemisorption")
 crystal face. Note the expansion of")

. The structure at (a) one-half")

 Scheme of the adsorption structure of CO on the Cu(110)")


 Scheme of the detection of ballistic charge carriers in the")

 surface. The Pt atoms move inward")
 Elastic and (b) plastic deformation during an indentation process.")
")
 prepared on a polyurethane surface")

 Proposed adsorption structures of HPF at the silica–buffer interface at")

 the")
 Schematic of a high-pressure SFG system, a vibrational spectroscopic tool")
, (211),")
 Evolution of Rh and Pd atomic fractions in the near-surface")
 The reaction scheme for pyrrole hydrogenation. (Bottom) The nanoparticle size")
 The reaction intermediates detected by SFG during cyclohexene hydrogenation and")
- Slides: 41
Color Inserts Introduction of Surface Chemistry and Catalysis Somorjai and Li
Figure 1. 2. Interfaces are ever-present in our lives. (a) An astronaut representing the solid–vacuum interface; (b) a jumping basketball player representing the solid–gas interface; (c) a sailboat representing the solid–liquid interface; and (d) a tire representing the solid–solid interface.
Figure 1. 4. The intricate folds of the human brain expose the large interface area of this remarkable organ. The brain may be viewed as a device with enormous solid–liquid interface area.
Figure 1. 5. The coleus leaf. Photosynthesis involves the absorption of sunlight and the reactions of H 2 O and CO 2 to produce organic molecules and oxygen. High-surface-area systems (e. g. , the plant leaf) are most efficient to carry out photosynthesis. (Courtesy of Stefan Eberhard, Complex Carbohydrate Research Center, The University of Georgia, Athens, GA. )
Figure 1. 10. Intercalation compounds of graphite: C 24 K (top) and C 8 K (bottom). The color changes from black (graphite) are due to the transfer of electrons from the metal-to-carbon layers. (Courtesy of Tom Weller, Mark Ellerby and Neal Skipper, Department of Physics & Astronomy, London’s Global University. )
Figure 1. 11. Microporous molecular sieve. There are many alumina silicates in nature that have pores with molecular dimensions. These are called zeolites. Synthetic zeolites are also produced in large numbers, mostly from silicates, phosphates, and borates. They are used as selective absorbers of gases or liquids, and are the catalysts utilized in the largest volume in chemical and petroleum technologies.
Figure 2. 4. (a) A scanning tunneling microscope image of the hydrogen pretreated diamond (100)-2× 1 surface observed are steps and kinks. The image area is 400 × 400Å2. (Courtesy of Jose Perez, Department of Physics, University of North Texas. ) (b) A three-dimensional (3 D) STM picture of the (0001) face of graphite over a 10 × 10 Å2 area.
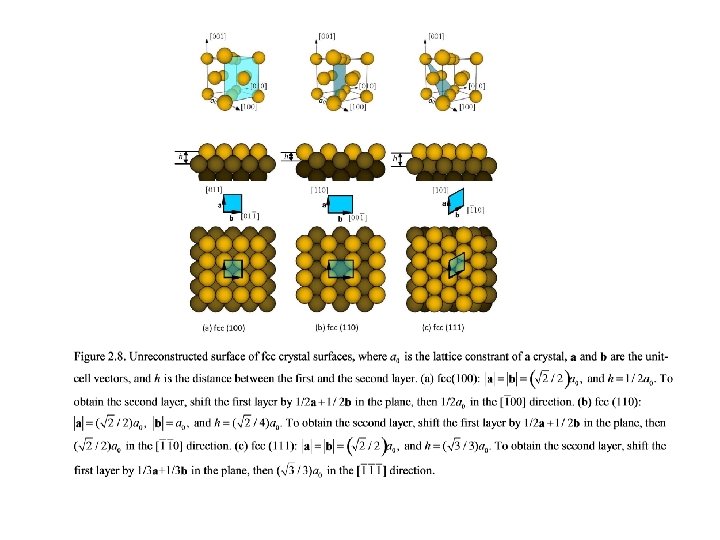
Figure 2. 11. Commonly observed unit cells of adsorbate surface structures on fcc(100), (110), and (111) surfaces.
Figure 2. 17. The structure of the reconstructed Ir(100) crystal face obtained from LEED surface crystallography. The first layer is indicated by a lighter color. Hexagonal packing in the surface layer induces buckling. The second layer retains its square unit cell.
Figure 2. 20. Relaxation at a Cu(410) stepped surface. The relative displacements (in Angstrom) of atoms are shown in the side view of the bulk surface. Atoms in the first row at the each step become adatoms that are pointed out in the side view of the reconstructed surface.
Figure 2. 22. Carbon chemisorption induced restructuring of the Ni(100) surface. The red arrows on the ideal fcc(100)-c(2 × 2)-C surface indicate how the four Ni atoms surrounding each C atom rotate to form reconstructed substrate.
Figure 2. 23. The S-Fe(110), sulfur-chemisorption-induced restructuring of the Fe(110) surface. The red arrows on the ideal fcc(110)-(2 × 2)-S surface indicate how the four Fe atoms surrounding each S atom move to form reconstructed substrate.
Figure 2. 25. Sulfur-chemisorption-induced restructuring of the Ir(110) surface obtained by LEED surface crystallography.
Figure 2. 26. (a) The O surface structure on Ni(100); (b) the O chemisorption induced surface structure on Cu(110); (c) the N surface structure on Ti(0001); (d) the bonding structure for N on Ti (0001). All of these structures were obtained by LEED surface crystallography.
Figure 2. 32. Ethylidyne-chemisorption-induced restructuring of the Rh(111) crystal face. Note the expansion of metal atoms around the hcp adsorption site, which is indicated by red arrows.
Figure 2. 34. The surface structure of C 6 H 6 in a disordered monolayer on Pt(111). The chemisorbed C 6 H 6 layer remains disordered in the absence of coadsorbed CO. (a) A 3 D schematic picture; (d) an STM image of a disordered C 6 H 6 monolayer on Rh(111); (b) and (c) are the side and top views of a single C 6 H 6 on the Pt(111) surface. Note the bending of the C 6 H 6 molecule into a boat-like surface structure. The unit of distance is Angstroms.
Figure 2. 36. Ordered CO surface structures on Pt(111). The structure at (a) one-half monolayer coverage and (b) at higher coverages. While the bridge and top site occupancy predominate at the lower coverages, repulsion forces the molecules to relocate at higher coverages.
Figure 2. 37. Schematic representation of CO–C 6 H 6 coadsorbed surface structures on the Rh(111) and Pd(111) surfaces.
Figure 4. 31. (a) Scheme of the adsorption structure of CO on the Cu(110) surface. (b) The probability for CO desorption and diffusion in different directions after the laser-induced substrate electronic excitation.
Figure 5. 16. Extinction spectra of Pt for a range of nominal disk diameters from 38 to 530 nm. The extinction is defined as E =1 - (I/I 0), where I 0 is the intensity of the incident laser and I is the intensity of the laser after scattering through samples.
Figure 5. 31. Schematic of an STM setup.
Figure 5. 34. (a) Scheme of the detection of ballistic charge carriers in the catalytic metal–semiconductor Schottky diode (in this case, Pt-Ti. O 2 diode). (b) Energy diagram of the generation process of hot electrons during the exothermic reaction.
Figure 6. 15. The XES spectra for CO in the gas phase and adsorbed on Ni(001). The red solid line is for the O–K spectra, and the blue dashed line is for the C–K spectra.
Figure 6. 20. Ethylene chemisorption restructures the Pt(111) surface. The Pt atoms move inward around the bonding site, the next-nearest-neighbor metal atom moves downward, and the Pt atom in the second layer moves upward.
Figure 7. 8. (a) Elastic and (b) plastic deformation during an indentation process.
Figure 8. 19. Comparison of a blood clot developed on the balloon surface (a) without surface modifiers, and (b) with surface modifiers. (Courtesy of Dr. Keith R. Mc. Crea, DSM Polymer Technology Group. )
Figure 8. 21. Antimicrobial self-assembling monolayer end group (SAME) prepared on a polyurethane surface to kill bacteria. (Courtesy of Dr. Keith R. Mc. Crea, DSM Polymer Technology Group. )
Figure 8. 22. Molecular structure of HPF. Two D domains are connected to the central E domain by a triple-stranded a-helical coiled coil. Two a. C domains are connected to two D domains by a. C chains, respectively. At a near neutral p. H, the D and E domains are negatively charged; the a. C domains and a. C chains are positively charged.
Figure 8. 23. (a) Proposed adsorption structures of HPF at the silica–buffer interface at p. H 8. 0 (left) and p. H 8. 0 after cycling to p. H 3. 2 (right), respectively. (b) The AFM images of a single HPF molecule with the two adsorption structures. (c) The SFG spectra of silica surfaces coated by HPF molecules with different adsorption structures.
Figure 8. 29. Ideal structure of the a-helical LK 14 peptide in solution. Width across the helical barrel and total width including the side chains were calculated using ideal helical bond angles and van der Waals radii.
Figure 8. 30. The SFG spectra of a LK 14 peptide at (a) the solution–d 8 -PS and (b) the solution–Si. O 2 interface, respectively. The proposed adsorption structures of a LK 14 peptide on (c) the hydrophobic d 8 -PS substrate and (d) the hydrophilic silica substrate.
Figure 9. 13. (a) Schematic of a high-pressure SFG system, a vibrational spectroscopic tool for probing the adsorbed species during the catalytic reaction. (b) The frequency wvis of the visible (vis) laser beam is kept fixed, and the infrared (IR)-beam frequency w. IR is varied. When w. IR coincides with a vibrational transition from |0> to |1> of an adsorbed molecule, the molecule is excited to a virtual state |n> and emits the sum frequency w. SFG. (c) Because of selection rules, the SFG signal is forbidden from a centrosymmetric medium.
Figure 9. 30. Schematic representations of the idealized surface structures of the (111), (211), (100), (210), and (110) orientation of Fe single crystals. The coordination of each surface atom is indicated.
Figure 9. 61. (Top) Evolution of Rh and Pd atomic fractions in the near-surface region of the Rh 0. 5 Pd 0. 5 NPs with the size 15 nm at 300°C under oxidizing conditions (100 m. Torr NO or O 2) and catalytic conditions (100 m. Torr NO and 100 m. Torr CO) denoted in the x-axis. (Bottom) Evolution of the fraction of the oxidized Rh (left y-axis) and Pd atoms (right y-axis) in the examined region under the same reaction conditions as the top part of the figure. All atomic fractions in this figure were obtained with an X-ray energy of 645 e. V for Rh 3 d and Pd 3 d, which generates photoelectrons with a MFP of 0. 7 nm. Schematic diagrams above the top of the figure show the reversible segregation of Rh and Pd under alternating oxidizing and catalytic conditions.
Figure 9. 66. (Top) The reaction scheme for pyrrole hydrogenation. (Bottom) The nanoparticle size dependence of selectivity to the reaction products of pyrrole hydrogenation.
Figure 9. 68. (a) The reaction intermediates detected by SFG during cyclohexene hydrogenation and dehydrogenation over Pt(111) at different temperatures. The reaction conditions are 1. 5 Torr for cyclohexene and 15 Torr for hydrogen. (b) The turnover rates for benzene and cyclohexane at different temperatures. Correlation between surface intermediates and formed reaction products may help identifying the reactive intermediates for the products.