Chapter 9 Accounting for Depreciation and Income Taxes


 + Freight $62, 500 725")

 • Salvage")


 Without switching n Depreciation 1 2 3 4")


 reflects the true cost")


 for Project Evaluation Example: Both companies")


 Taxable income Tax rate 0 -$50, 000")
 18. 000 TL’ye kadar % 15 40. 000")
 Tax Rate for a Taxable Income of $16, 000 Taxable")
 Gross Sales revenue Expenses:")
 (depreciation) (leasing expense) Taxable")


 + 0. 34($15, 000/$20, 000) = 31. 75% Before Taxable")


 Develop the project’s cash flows over its project life. • (b)")

 Step 1: Depreciation Calculation – Cost Base = $125, 000 N")
 Step 2: Gains (Losses) associated with Asset Disposal • Salvage value = $50,")


: n Is this investment justifiable at a MARR of 15%? $104, 950")

 Amount financed: $62, 500, or 50% of total")

 means")


=23441>0 (compare with 31420 without inflation) 20. 75%=0. 15+0. 05+(0. 15)(0. 05)")


 Costs: the expenses associated with issuing stock Types")

 – Opportunity cost associated with")

 Cost")

")


- Slides: 89
Chapter 9 Accounting for Depreciation and Income Taxes n n n Asset Depreciation Book Depreciation Tax Depreciation How to Determine “Accounting Profit” Corporate Taxes 1
Depreciation • Definition: Loss of value for a fixed asset • Example: You purchased a car worth $15, 000 at the beginning of year 2005. Market Value Loss of Value 0 1 2 3 4 5 $15, 000 10, 000 8, 000 6, 000 5, 000 4, 000 $5, 000 2, 000 1, 000 Depreciation End of Year 2
Why Do We Need to Consider Depreciation? Business Expense: Depreciation is viewed as part of business expenses that reduce taxable income. Gross Income -Expenses: (Cost of goods sold) (Depreciation) (operating expenses) Taxable Income - Income taxes Net income (profit) 3
Depreciation Concept • Economic Depreciation Purchase Price – Market Value (Economic loss due to both physical deterioration and technological obsolescence) • Accounting Depreciation A systematic allocation of cost basis over a period of time. 4
Cost Basis Cost of new holepunching machine (Invoice price) + Freight $62, 500 725 + Installation labor 2, 150 + Site preparation 3, 500 Cost basis to use in depreciation calculation $68, 875 5
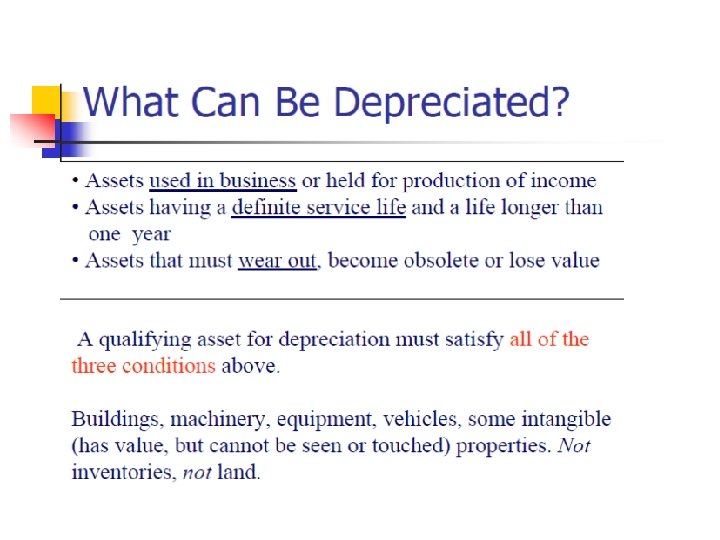
Matching Concept Allocate costs such that pattern of costs roughly matches pattern of service or in other words, A fraction of the cost of the asset is chargeable as an expense in each of the accounting periods in which the asset provides service to the firm, and each charge is meant to be a percentage of the whole cost which “matches” the percentage of the value utilized in the given period. suggests that accounting depreciation allowance generally reflects to some extent the actual economic depreciation of the asset 6
Factors to Consider in Asset Depreciation • Depreciable life (how long? ) • Salvage value (disposal value) • Cost basis (depreciation basis) • Method of depreciation (how? ) 7
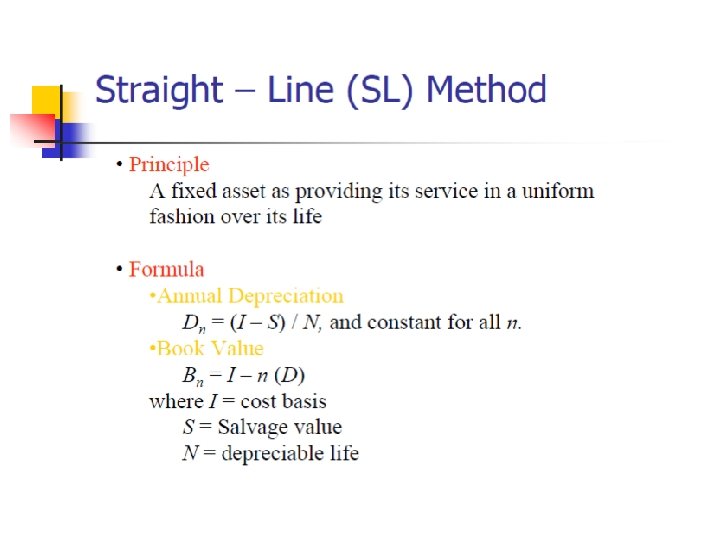
Depreciation Methods
Declining Balance Method • Principle: A fixed asset as providing its service in a decreasing fashion • Formula • Annual Depreciation • Book Value where 0 < < 2(1/N) Note: if is chosen to be the upper bound, = 2(1/N), we call it a 200% DB or double declining balance method. 12
Example – Declining Balance Method Annual Depreciation Book Value $10, 000 Total depreciation at end of life D 1 $8, 000 $6, 000 B 1 D 2 $4, 000 B 2 $2, 000 00 D 3 B 3 1 2 3 D 4 B 4 4 D 5 B 5 5 α=(1/5)(2)=40% n n 0 1 2 3 4 5 Dn $4, 000 2, 400 1, 440 864 518 Bn $10, 000 6, 000 3, 600 2, 160 1, 296 778 13
n n Salvage value must be estimated in the beginning of depreciation analysis. Previous example: BN=S. What if not? 14
Example DB Switching to SL Asset: Invoice Price Freight Installation Depreciation Base Salvage Value Depreciation Depreciable life $9, 000 500 $10, 000 0 200% DB 5 years • SL Dep. Rate = 1/5 • (DDB rate) = (200%) (SL rate) = 0. 40 15
Case 1: S = 0 (a) Without switching n Depreciation 1 2 3 4 5 10, 000(0. 4) = 4, 000 6, 000(0. 4) = 2, 400 3, 600(0. 4) = 1, 440 2, 160(0. 4) = 864 1, 296(0. 4) = 518 (b) With switching to SL Book Value N $6, 000 3, 600 2, 160 1, 296 778 1 2 3 4 5 Book Depreciation Value 10, 000/5 = 2000 < 4, 000 $6, 000/4 = 1, 500 < 2, 400 3, 600/3 = 1, 200 < 1, 440 2, 160/2 = 1, 080 > 864 1, 080/1 = 1, 080 > 518 0 Note: Without switching, we haven’t depreciated the entire cost of the asset thus have not taken full advantage of depreciation’s tax deferring benefits. 16
Case 2: S = $2, 000 End of Year Depreciation Book Value 1 0. 4($10, 000) = $4, 000 $10, 000 - $4, 000 = $6, 000 2 0. 4(6, 000) = 2, 400 6, 000 – 2, 400 = 3, 600 3 0. 4(3, 600) = 1, 440 3, 600 – 1, 440 = 2, 160 4 0. 4(2, 160) = 864 > 160 2, 160 – 160 = 2, 000 5 0 2, 000 – 0 = 2, 000 Note: Tax law does not permit us to depreciate assets below their salvage values. 17
Units-of-Production Method • Principle Service units will be consumed in a non time-phased fashion • Formula • Annual Depreciation Dn = Service units consumed for year (I - S) total service units 18
n n Example: Pizza Company buys oven for $10000 Estimated life 7 years (500, 000 pizzas) Salvage value: $3000 Depreciation per unit = (10000 -3000)/500000=0. 014 If 75000 pizzas are cooked this year, depreciation expense for this year is 75000*0. 014=1050 19
Depreciation Rates in Turkey http: //www. gib. gov. tr/sites/default/files/fi leadmin/user_upload/Yararli_Bilgiler/amor tisman_oranlari. pdf 20
After-Tax Cash Flow n n n Investment decisions are based on net project cash flows (that is, cash flows after taxes). If project revenues exceed project costs, then the project generates profit or income. Otherwise the project results in a loss. Any profit generated will be taxed. After tax profit is called net income. 21
After-Tax Cash Flow n n Project revenue is the income earned by a business as a result of providing products or services to customers (Note that the cash may be received in a different accounting period). Project expenses are the cost of doing business to generate the revenues of the specified operating period (Note that the cash may be paid in a different accounting period). n n n Cost of goods sold (labor, material, inventory, supplies) Depreciation Salaries Operating costs (cost of renting buildings, cost of insurance) Income taxes 22
Treatment of Depreciation Expenses n n n The cost of capital assets are part of your business expenses. The accounting treatment of capital expenditures differs from the treatment of operating expenses. That is: Capital expenditures must be capitalized: they must be systematically allocated as expenses over their depreciable lives. So, When you acquire a property with productive life extending over several years, you cannot deduct the total costs from profits in the year the asset was purchased. A depreciation allowance is established over the life of the asset. 23
Taxable Income and Income Taxes Item Gross Income Expenses Cost of goods sold Depreciation Operating expenses Taxable income Income taxes Net income 24
Example: Net Income Calculation • A company buys a NC machine for $28000 and uses it for 5 years. The depreciation deduction for the first year is $4000. Net income during the first year? Item Amount Gross income (revenue) $50, 000 Expenses Cost of goods sold Depreciation Operating expenses 20, 000 4, 000 6, 000 Taxable income 20, 000 Taxes (40%) Net income 8, 000 $12, 000 26
Example Cont’d n n n The inclusion of depreciation ($4000) reflects the true cost of doing business. That expense is meant to match the amount of the total cost of the machine ($28000) that has been used up during the first year. Inclusion of total cost would lead to dramatic variations in net income. Hence, net income would be a less accurate measure of the company performance. On the other hand, if this cost is omitted, we would have a “false profit”. 27
Cash Flow vs. Net Income Certain expenses are not really cash outflows. Example: Depreciation. Deducted from revenue for tax purposes on a yearly basis, but no cash is paid to anyone, except when the asset was purchased. Net income: Net income is an accounting means of measuring a firm’s profitability based on the matching concept. Costs become expenses as they are matched against revenue. The actual timing of cash inflows and outflows are ignored. Cash flow: Given the time value of money, it is better to receive cash now than later, because cash can be invested to earn more money. 28
Capital Expenditure versus Depreciation Expenses 0 $28, 000 0 1 2 3 4 5 6 7 8 4 7 6 7 8 Capital expenditure (actual cash flow) 1 2 3 $1, 250 $4, 000 $6, 850 $4, 900 $3, 500 $2, 500 Allowed depreciation expenses (not cash flow) 29
Cash Flows are more important (than Net Income) for Project Evaluation Example: Both companies (A & B) have the same amount of net income and cash sum over 2 years, but Company A returns $1 million cash yearly, while Company B returns $2 million at the end of 2 nd year. Company A can invest $1 million in year 1, while Company B has nothing to invest during the same period. Company A Company B Year 1 Net income Cash flow $1, 000 $1, 000 0 Year 2 Net income Cash flow 1, 000, 000 1, 000 2, 000 30
Example: Cash Flow versus Net Income Previous example: Assuming all sales are cash and all expenses except depreciation were paid during year one, how much cash would be generated from operations? Item Income Cash Flow Gross income (revenue) $50, 000 Expenses Cost of goods sold Depreciation Operating expenses 20, 000 4, 000 6, 000 -20, 000 Taxable income 20, 000 Taxes (40%) Net income Net cash flow 8, 000 -6, 000 -8, 000 $12, 000 $16, 000 31
Net income versus net cash flow Assuming that revenues are received and expenses are paid in cash: Net cash flows = Net income + noncash expense (i. e. , depreciation) $50, 000 $40, 000 $30, 000 $20, 000 $10, 000 $0 Net cash flow Net income $12, 000 Depreciation $4, 000 Income taxes $8, 000 Operating expenses Cost of goods sold $6, 000 Gross revenue $20, 000 32
Corporate Taxes (U. S. Corporate Tax Rates) Taxable income Tax rate 0 -$50, 000 15% $50, 001 -$75, 000 25% $75, 001 -$100, 000 34% $100, 001 -$335, 000 39% $335, 001 -$10, 000 34% $10, 001 -$15, 000 35% $15, 000, 001 -$18, 333 38% $18, 333, 334 and Up 35% Tax computation $0 + 0. 15(D) $7, 500 + 0. 25 (D) $13, 750 + 0. 34(D) $22, 250 + 0. 39 (D) $113, 900 + 0. 34 (D) $3, 400, 000 + 0. 35 (D) $5, 150, 000 + 0. 38 (D) $6, 416, 666 + 0. 35 (D) denotes the taxable income in excess of the lower bound of each tax bracket 33
TURKISH INCOME TAXES (GELİR VERGİSİ TARİFESİ) 18. 000 TL’ye kadar % 15 40. 000 TL’nin 18. 000 TL’si çin 2700 TL, fazlası % 20 98. 000 TL'nin 40. 000 TL'si için 7. 100 TL, (ücret gelirlerinde 148. 000 TL'nin % 27 40. 000 TL'si için 7. 100 TL), fazlası 98. 000 TL'den fazlasının 98. 000 TL'si için 22. 760 TL, (ücret gelirlerinde 148. 000 TL'den fazlasının 148. 000 TL'si için 36. 260 TL), fazlası % 35 Kurumlar vergisi oranı gelir miktarına bağlı olmaksızın, sabit %22 oranındadır. 34
Marginal and Effective (Average) Tax Rate for a Taxable Income of $16, 000 Taxable income Marginal Tax Rate Amount of Taxes Cumulative Taxes First $50, 000 15% $7, 500 Next $25, 000 25% 6, 250 13, 750 Next $25, 000 34% 8, 500 22, 250 Next $235, 000 39% 91, 650 113, 900 Next $9, 665, 000 34% 3, 286, 100 3, 400, 000 Next $5, 000 35% 1, 750, 000 5, 150, 000 Remaining $1, 000 38% 380, 000 $5, 530, 000 35
Example - Corporate Income Taxes Facts: Capital expenditure (allowed depreciation) Gross Sales revenue Expenses: Cost of goods sold Depreciation Leasing warehouse Question: Taxable income? $100, 000 $58, 000 $1, 250, 000 $840, 000 $58, 000 $20, 000 36
Taxable income: Gross income - Expenses: (cost of goods sold) (depreciation) (leasing expense) Taxable income • Income taxes: First $50, 000 @ 15% $25, 000 @ 25% $25, 000 @ 34% $232, 000 @ 39% Total taxes $1, 250, 000 $840, 000 $58, 000 $20, 000 $332, 000 $7, 500 $6, 250 $8, 500 $90, 480 $112, 730 37
• Average tax rate: Total taxes = $112, 730 Taxable income = $332, 000 • Marginal tax rate: Tax rate that is applied to the last dollar earned 39% 38
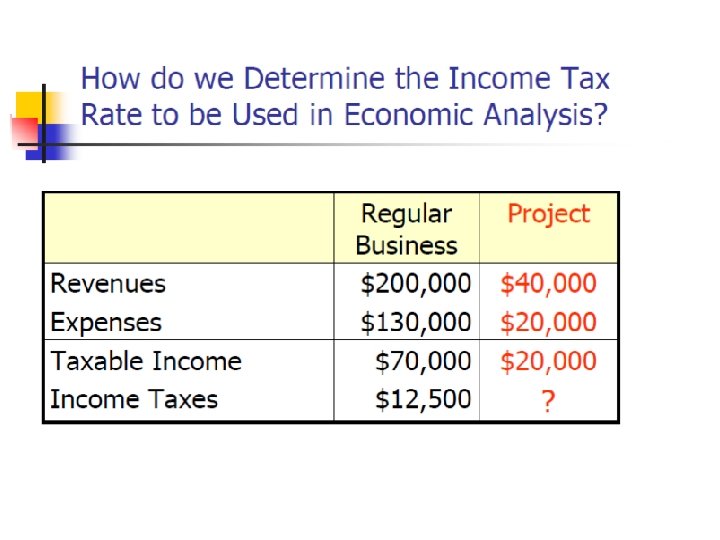
Incremental Income Tax Rate Before After The Effect Undertaking of Project Gross revenue $200, 000 $240, 000 $40, 000 Expenses 130, 000 150, 000 20, 000 Taxable income $70, 000 $90, 000 $20, 000 Income taxes $12, 500 $18, 850 $6, 350 Average tax rate 17. 86% 20. 94% 6350/20000=31. 75% This is the rate we should use in evaluating the project in isolation from the rest of the operations 31. 75% 40
0. 25($5, 000/$20, 000) + 0. 34($15, 000/$20, 000) = 31. 75% Before Taxable income Incremental $70, 000 $90, 000 $20, 000 12, 500 18, 850 6, 350 17. 86% 20. 94% Income taxes Average tax rate After Incremental tax rate 31. 75% $20, 000 incremental taxable income due to undertaking project Regular income from operation $5, 000 at 25% Marginal tax rate 15% $0 $20, 000 25% $40, 000 $60, 000 $15, 000 at 34% $80, 000 $100, 000 41
Example 1: Consider the following data on an asset: Purchase cost of the asset: $25, 000 Installation Cost: $5000 Useful Life: 4 years Salvage Value: $1000 Compute the annual depreciation allowances and the resulting book values by using the DDB method switching to SL. 42
Example 2: Compute the 150% DB depreciation schedule for an asset with the following data: Cost = 12000 Useful Life = 5 years Salvage Value = 3000 a)What is the value of alpha? b)What is the amount of depreciation for the first full year of use? c)What is the book value of the asset at the end of the fourth year? 43
Example 3: Quick Printing Company had the following data during tax year one. Sales revenue: $1, 250, 000 Labor expenses: 550, 000 Material Costs: 150, 000 Depreciation Expenses: 30, 000 Interest Income on deposits: 10, 000 Bond Interest Income: 5, 000 Interest Expenses: 12, 000 Rental Expenses: 45, 000 Proceeds from the sale of old equipment : 23000 (that had a book value of 20, 000) a) b) c) Find the taxable income for the company What is the marginal and effective(average) tax rate? What is the net cash flow after tax? 44
Chapter 10 – Cash Flow Analysis Elements of Investment Decision • • • Identification of Investment Opportunities Generation of Cash Flows Measures of Investment Worth Our focus in this Project Selection chapter is to develop the format Project Implementation of after-tax cash flow statements. Project-Control/Post-Audit
Types of Cash Flow Elements in Project Analysis
Cash Flows from Operating Activities Approach 1 Income Statement Approach Operating revenues Cost of goods sold Depreciation Operating expenses Interest expenses Taxable income Income taxes Net income + Depreciation Approach 2 Direct Cash Flow Approach Operating revenues - Cost of goods sold - Operating expenses - Interest expenses - Income taxes Cash flow from operation
A Typical Format used for Presenting Cash Flow Statement Cash flow statement + Net income +Depreciation Income statement Revenues Expenses Cost of goods sold Depreciation Debt interest Operating expenses Taxable income Income taxes Net income -Capital investment + Proceeds from sales of depreciable assets - Gains tax - Investments in working capital + Working capital recovery + Borrowed funds -Repayment of principal Net cash flow Operating activities + Investing activities + Financing activities
Example: When Projects Require only Operating and Investing Activities • Project Nature: Installation of a new computer control system • Financial Data: – Investment: $125, 000 – Project life: 5 years – Working capital investment: $23, 331 – Sale value at the 5 th year: $50, 000 – Annual labor savings: $100, 000 – Annual additional expenses: • Labor: $20, 000 • Material: $12, 000 • Overhead: $8, 000 – Income tax rate: 40% – MARR: 15%
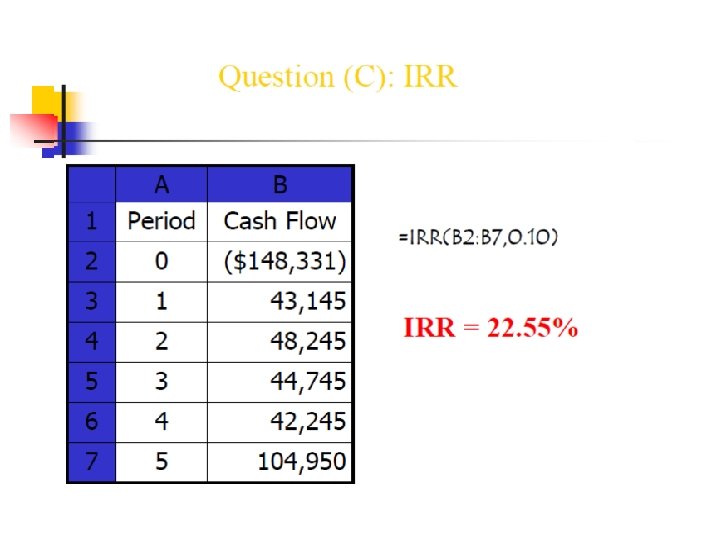
Questions • (a) Develop the project’s cash flows over its project life. • (b) Is this project justifiable at a MARR of 15%? • (c) What is the internal rate of return of this project?
When Projects Require Working Capital Investments • Working capital means the amount carried in cash, accounts receivable, and inventory that is available to meet day-to -day operating needs. • How to treat working capital investments: just like a capital expenditure except that no depreciation is allowed.
• (a) Step 1: Depreciation Calculation – Cost Base = $125, 000 N Depreciation Rates Amount Allowed Depreciation Amount 1 14. 29% $17, 863 2 24. 49% $30, 613 3 17. 49% $21, 863 4 12. 49% $15, 613 5 8. 93% $11, 150 $5, 575 6 8. 92% $11, 150 0 7 8. 93% $11, 150 0 8 4. 46% $5, 575 0
(a) Step 2: Gains (Losses) associated with Asset Disposal • Salvage value = $50, 000 • Book Value (year 5) = Cost Base – Total Depreciation = $125, 000 - $ 91, 525 = $ 33, 475 • Taxable gains = Salvage Value – Book Value = $50, 000 - $ 33, 475 = $16, 525 • Gains taxes = (Taxable Gains)(Tax Rate) = $16, 525 (0. 40) = $6, 610
Step 3 – Create an Income Statement Revenues 0 1 2 3 4 5 $100, 000 $100, 000 Expenses: Labor 20, 000 20, 000 Material 12, 000 12, 000 8, 000 8, 000 17, 863 30, 613 21, 863 15, 613 5, 581 $42, 137 $29, 387 $38, 137 $44, 387 $54, 419 16, 855 11, 755 15, 255 17, 755 21, 768 $25, 282 $17, 632 $22, 882 $26, 632 $32, 651 Overhead Depreciation Taxable Income Taxes (40%) Net Income
Step 4 – Develop a Cash Flow Statement 0 1 2 3 4 5 $25, 282 $17, 632 $22, 882 $26, 632 $32, 651 17, 863 30, 613 21, 863 15, 613 5, 581 Operating Activities: Net Income Depreciation Investment Activities: Investment (125, 000) Salvage Value 50, 000 Gains Tax (6, 610) Working capital Net Cash Flow (23, 331) ($148, 331) 23, 331 $43, 145 $48, 245 $44, 745 $42, 245 $104, 950
Excel Worksheet
Example - Net Cash Flow Table A B C D E F G H I J Year End Investment & Salvage Value Revenue Labor Expenses Materials Overhead Depreciation Taxable Income Taxes Net Cash Flow 0 -$125, 000 -23, 331 1 $100, 000 20, 000 12, 000 8, 000 $17, 863 42, 137 16, 855 $43, 145 2 100, 000 20, 000 12, 000 8, 000 30, 613 29, 387 11, 755 $48, 245 3 100, 000 20, 000 12, 000 8, 000 21, 863 38, 137 15, 255 $44, 745 4 100, 000 20, 000 12, 000 8, 000 15, 613 44, 387 17, 755 $42, 245 100, 000 20, 000 12, 000 8, 000 5, 581 54, 419 16, 525 21, 678 6, 613 $38, 232 43, 387 23, 331 5 50, 000* 23, 331 *Salvage value Note that H = C-D-E-F-G I = 0. 4 * H J= B+C-D-E-F-I Information required to calculate the income taxes
Cash Flow Diagram including Working Capital $23, 331 $43, 145 0 1 $48, 245 $44, 745 2 $125, 000 Investment in physical assets $23, 331 Investment in working capital 3 Working capital recovery $81, 619 $42, 245 4 5 $23, 331 0 $23, 331 1 2 3 4 Years Working capital recovery cycles 5
Question (b): n Is this investment justifiable at a MARR of 15%? $104, 950 $48, 245 $43, 145 PW(15%) = -$148, 331 + +$43, 145(P/F, 15%, 1) +. . + $104, 950 (P/F, 15%, 5) = $31, 420 > 0 n Yes, Accept the Project ! n $44, 745 $42, 245 0 1 2 3 4 5 Years $148, 331
When Projects are Financed with Borrowed Funds n n Key issue: Interest payment is a taxdeductible expense. What Needs to Be Done: Once loan repayment schedule is known, separate the interest payments from the annual installments. n What about Principal Payment? As the amount of borrowing is NOT viewed as income to the borrower, the repayment of principal is NOT viewed as expenses either– NO tax effect.
Loan Repayment Schedule (Example 9. 2) Amount financed: $62, 500, or 50% of total capital expenditure Financing rate: 10% per year Annual installment: $16, 487 or, A = $62, 500(A/P, 10%, 5) End of Year Beginning Balance Interest Payment Principal Payment Ending Balance 1 $62, 500 $6, 250 $10, 237 $52, 263 2 52, 263 5, 226 11, 261 41, 002 3 41, 002 4, 100 12, 387 28, 615 4 28, 615 2, 861 13, 626 14, 989 5 14, 989 1, 499 14, 988 0 $16, 487
Table Additional entries related to debt financing
When Projects Result in Negative Taxable Income n Negative taxable income (project loss) means you can reduce your taxable income from regular business operation by the amount of loss, which results in a tax savings. n Handling Project Loss Regular Project Combined Business Operation Taxable income Income taxes (35%) $100 M (10 M) $90 M $35 M ? $31. 5 M Tax savings Tax Savings = $35 M - $31. 5 M = $3. 5 M Or (10 M)(0. 35) = -$3. 5 M
Effects of Inflation on Project Cash Flows Item Depreciation expense Effects of Inflation Depreciation expense is charged to taxable income in dollars of declining values; taxable income is overstated, resulting in higher taxes Note: Depreciation expenses are based on historical costs and always expressed in actual dollars
Item Salvage value Effects of Inflation Inflated salvage value combined with book values based on historical costs results in higher taxable gains.
Item Loan repayments Effects of Inflation Borrowers repay historical loan amounts with dollars of decreased purchasing power, reducing the debtfinancing cost.
Item Effects of Inflation Working capital Known as working capital requirement drain, the cost of working capital increases in an inflationary environment.
PW(20. 75%)=23441>0 (compare with 31420 without inflation) 20. 75%=0. 15+0. 05+(0. 15)(0. 05)
n ROR based on actual dollars: 22. 2% n 22. 2%>20. 75% justifiable project n Real (inflation-free) ROR: n 16. 38%>15% justifiable project
Example: Applying Specific Inflation Rates
Ex: The following table shows the relevant data for two mutually exclusive alternative machines. Assume that if you buy one of the machines you will use it until the end of its service life and then replace it with a new one. Both machines will be depreciated using straight line depreciation method over their service lives. The costs given in the table are actual dollars unless stated otherwise. The marginal income tax rate is 40%, market interest rate is 20% compounded quarterly and the inflation rate is 10%. Determine which machine should be chosen assuming an infinite analysis period. Machine A Machine B First cost 50, 000 80, 000 Life 7 years 11 years Terminal book value (and salvage value) 6, 000 14, 000 Annual revenue for year n 15, 000(1. 1)n-1 20, 000 Annual expense for year n 2, 000 5, 000+500(n-1) 72
Cost of Capital – What is it? Cost of capital is the risk-adjusted discount rate (k) to be used in computing a project’s NPV. Used for selection of an appropriate MARR
Methods of Financing n n n Equity Financing – Capital is coming from either retained earnings or funds raised from an issuance of stock Debt Financing – Money raised through loans or by an issuance of bonds Capital Structure – Well managed firms establish a target capital structure and strive to maintain the debt ratio
Equity Financing n n Flotation (discount) Costs: the expenses associated with issuing stock Types of Equity Financing: n n n Retained earnings Common stock Preferred stock Retained earnings + Preferred stock + Common stock
Debt Financing n Bond Financing: n n Incur floatation cost Pay only interests at the end of each period (usually semi-annually) Pay the entire principal (face value) in a lump sum when the bond matures Term Loan: n n n Involve an equal repayment arrangement. May incur origination fee Allow terms to be negotiated directly between the borrowing company and a financial institution Bond Financing + Term Loans
Cost of Capital n n Cost of Equity (ie) – Opportunity cost associated with using shareholders’ capital Cost of Debt (id) – Cost associated with borrowing capital from creditors Cost of Capital (k) – Weighted average of ie and id Cost of Debt Cost of Capital n Cost of Equity
1. Calculating the after-tax Cost of Debt
2. Calculating the Cost of Equity n n Cost of Retained Earnings (kr) Cost of issuing New Common Stock(ke) Cost of Preferred Stock (kp) Cost of equity: weighted average of kr ke, and kp
Calculating Cost of Equity Based on Financing Sources Where Cr = amount of equity financed from retained earnings, Cc = amount of equity financed from issuing new stock, Cp = amount of equity financed from issuing preferred stock, and Ce = Cr + Cc + Cp
3. Calculating the Weighted after-tax Cost of Capital Cd= Total debt capital(such as bonds) in dollars, Ce=Total equity capital in dollars, V = Cd+ Ce, ie= Average equity interest rate period considering all equity sources, id = After-tax average borrowing interest rate period considering all debt sources, and k = Tax-adjusted weighted-average cost of capital.
Practice Problem n n Alpha Corporation needs to raise $10 million and has decided to finance $4 million by securing a term loan and issuing a 20‑year $1, 000 par bonds for the following condition. The remaining funds would be raised through equity financing as in the table Alpha’s marginal tax rate is 38%, and it is expected to remain constant in the future. What is the after- Source Amount Fraction Interest rate Term Loan $1. 33 M 0. 333 12% Bond $2. 67 M 0. 667 10. 74% Source Amou nt Interest Fraction Rate of Total Equity Retained earnings $1 M 20. 50% 0. 167 New common stock $4 M 22. 27% 0. 666 Preferred stock $1 M 10. 08% 0. 167
Marginal Cost of Capital Comments: This 14. 74% would be the marginal cost of capital that a company with this financial structure would expect to pay to raise $10 million.
Summary • Identifying and estimating relevant project cash flows is perhaps the most challenging aspect of engineering economic analysis. All cash flows can be organized into one of the following three categories: 1. Operating activities 2. Investing activities 3. Financing activities
• Cash Items 1. New investment and disposal of existing assets 2. Salvage value (or net selling price) 3. Working capital 4. Working capital release 5. Cash revenues/savings 6. Manufacturing, operating, and maintenance costs. 7. Interest and loan payments 8. Taxes and tax credits
• Non-cash items Depreciation expenses • The income statement approach is typically used in organizing project cash flows. This approach groups cash flows according to whether they are operating, investing, or financing functions.
• Methods of financing: 1. Equity financing uses retained earnings or funds raised from an issuance of stock to finance a capital. 2. Debt financing uses money raised through loans or by an issuance of bonds to finance a capital investment.
• • The selection of an appropriate MARR depends generally upon the cost of capital —the rate the firm must pay to various sources for the use of capital. The cost of the capital formula is a composite index reflecting the cost of funds raised from different sources. The formula is
n The marginal cost of capital is defined as the cost of obtaining another dollar of new capital. The marginal cost rises as more and more capital is raised during a given period.