DEPRECIATION AND INCOME TAXES CHAPTER 9 v Asset


 Assets Used Lower Limit Midpoint Life Upper Limit Office")
![Types of Depreciation v Book Depreciation [financial report] v Firms report depreciation and net](https://slidetodoc.com/presentation_image_h/07aefb6ece5a57e75f435c5f7ef52cd4/image-10.jpg "Types of Depreciation v Book Depreciation [financial report] v Firms report depreciation and net")

 Method Principle of this method It considers a fixed asset")

 Principle: A fixed asset as providing")
 Depreciation Asset: Invoice Price ………………. . . $9,")

 Depreciation Asset: Invoice Price ………………. . . $9,")
 with conversion to Straight Line Depreciation (Bn >")
 with conversion to Straight Line Depreciation (Bn > S) Straight line")


 Personal Property: (movable property, includes assets such as")
 Recovery Period Personal Property Applicable Property")


 machines")
 $50, 000")


 Tax Rate for a Taxable Income of $16, 000")
 $58, 000 Gross")
 $840,")


 are defined as the differences between the salvage value and")


 Consider the following data on an asset: Cost of the asset, I")
 Cost of the asset, I Useful life, N Salvage value, S")
 Consider the following data on an asset: Compute the annual depreciation allowances")
 Cost of the asset, I Useful life, N $38, 000 6")
 New York Limousine Service owns 10 limos and uses the units of")


 An electrical appliance company purchased an industrial robot costing $320, 000 in")
 SOLUTION If sold at $15, 000: If sold at $125, 460: If")
- Slides: 64
DEPRECIATION AND INCOME TAXES CHAPTER 9
v Asset Depreciation v Book Depreciation v Tax Depreciation v Corporate Taxes
WHAT IS DEPRECIATION? Definition: Loss of value for a fixed asset between two periods Example: Market values of a vehicle over 5 years Market Value Loss of Value 2009 $20, 000 2010 $14, 000 $6, 000 2011 $10, 000 $4, 000 2012 $7, 000 $3, 000 2013 $5, 000 $2, 000 2014 $4, 000 $1, 000 D e p r e c i a t i o n End of Year
Depreciation Concept Ø is a term used in accounting, economics, and finance to spread the cost of an asset over the period of several years. Ø is the reduction in the value of an asset due to usage, passage of time, and technological outdating or other factors. Economic Depreciation (Purchase Price – Market Value) Economic losses due to both physical deterioration and technological obsolescence. Accounting Depreciation Systematic allocation (distribution) of the initial cost of an asset in parts over a time or decline in value over time and sometimes referred to more generally as asset depreciation.
Factors to Consider in the process of an Asset Depreciation Ø What is the cost basis of the asset? Ø What is asset’s value at the end of its useful life (salvage value)? Ø What is the depreciable life of the asset? Ø What method of depreciation do we choose?
What Can Be Depreciated? Depreciable property has the following characteristics 1. Assets must be used in business or held for production of income. 2. Assets must have a definite service (useful) life which must be longer than one year. 3. Assets must wear out, become obsolete or loses value from natural causes. A qualifying asset for depreciation must satisfy all of the three conditions above.
Example 9. 1 on Cost Basis of an asset represents the total cost that is claimed as an expense over an asset's life and generally includes the actual cost of an asset and all accompanying expenses, such as freight, site preparation, and installation. Cost of a new stamping machine (Invoice price) Freight $22, 700 525 Installation labor 1, 350 Site preparation 2, 125 Cost of Machine (Cost basis) $26, 700
Useful Life and Salvage Value: The following questions must be answered when determining an asset's depreciable life. i. e. , the number of years over which the asset is to be depreciated. Q 1) How long will an asset be useful to the company? Q 2) What do statutes (law) and accounting rules mandate in determining an asset's depreciable life? §Determining the service life of an asset is often very difficult. §The uncertainty of these estimates often led to disputes between taxpayers and the Internal Revenue Service (IRS). §The IRS publishes guidelines on lives for categories of assets known as Asset Depreciation Ranges or ADRs. §These guidelines specify a range of lives for classes of assets, based on historical data allowing taxpayers to choose a depreciable life within the specified range for a given asset.
Asset Depreciation Range ADR (years) Assets Used Lower Limit Midpoint Life Upper Limit Office furniture, fixtures, and equipment 8 10 12 Information systems (computers) 5 6 7 Airplanes 5 6 7 2. 5 3 3. 5 Buses 7 9 11 Light trucks 3 4 5 Heavy trucks (concrete ready-mixer) 5 6 7 Railroad cars and locomotives 12 15 18 Tractor units 5 6 7 Vessels, barges, tugs, and water transportation system 14. 5 18 21. 5 Industrial steam and electrical generation 17. 5 22 26. 5 Manufacturer of electrical and non-electrical machinery 8 10 12 Manufacturer of electronic components, products, 5 6 7 9. 5 12 14. 5 Automobiles, taxis Manufacturer of motor vehicles
Types of Depreciation v Book Depreciation [financial report] v Firms report depreciation and net income to investors / stockholders (such as in balance sheet or income statement) v Actual loss of value in asset is generally reflected v Tax Depreciation [Internal Revenue Service] v v v In calculating income taxes for the IRS In engineering economics, we use depreciation in the context of tax depreciation Tax depreciation method allows firms to benefit from the tax advantages of depreciating assets, (will not pay high income tax). Tax depreciation methods generally permit a higher depreciation in earlier years than do book depreciation methods. Firms generally pay lower taxes in the initial years of an investment project.
Book Depreciation Methods v Three different methods can be used to calculate the periodic depreciation allowances for financial reporting. Types of Depreciation Methods: v Straight-Line Method v Declining Balance Method v Unit Production Method
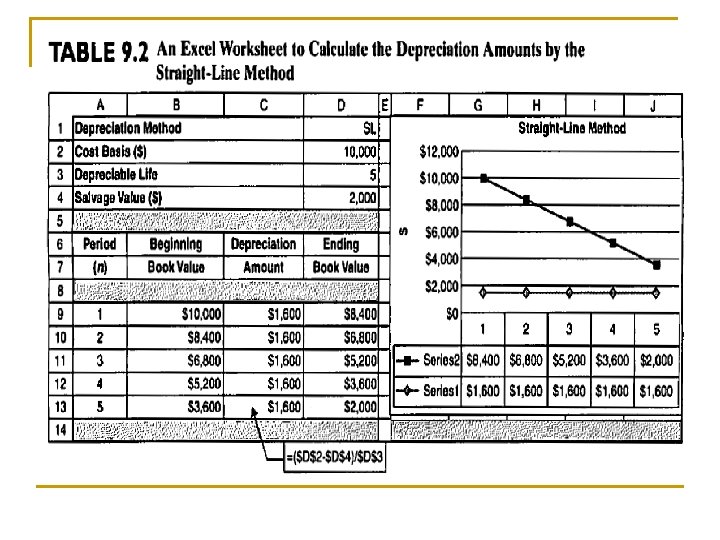
Straight – Line (SL) Method Principle of this method It considers a fixed asset as an asset that provides its services in a uniform fashion. That is, the asset provides equal amount of service in each year of its useful life. Formula Annual Depreciation Dn = (I – S) / N and constant for all n (years). Book Value after Depreciation Charge Bn = I – n (Dn) where I = cost basis S = Salvage value N = depreciable life
Example 9. 2 Straight – Line Method Consider the following data on an automobile, compute I = $10, 000 the annual depreciation allowances and resulting book values N = 5 Years using the straight-line method. S = $2, 000 D = (I – S)/N Find: Dn and Bn n Dn Bn 0 $10, 000 n 1 1, 600 8, 400 2 1, 600 6, 800 3 1, 600 5, 200 4 1, 600 3, 600 5 1, 600 2, 000
Declining Balance Method ( D B M ) Principle: A fixed asset as providing its service in a decreasing fashion over time. DBM calculating depreciation allocates a fixed fraction and it is obtained from S L depreciation rate (1/N) as a basis: = (1/N) x (multiplier). N and multiplier are given. Most commonly used multipliers in the USA are 1. 5 DB or 2. 0 DB Annual Depreciation where 0 < < 2(1/N) Book Value Note: if is chosen to be the upper bound, = 2(1/N), we call it a 200% DB or double declining balance (DDB) method.
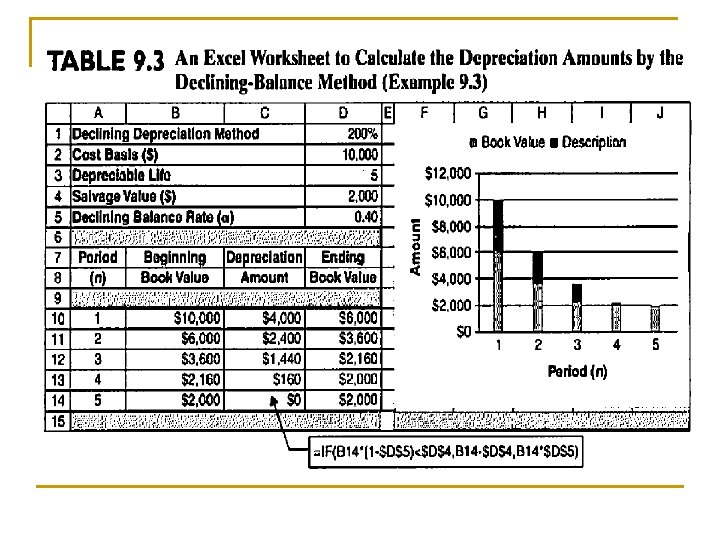
Example 9. 3 Declining Balance (DB) Depreciation Asset: Invoice Price ………………. . . $9, 000 Freight …………. . 500 Installation …………………. . . 500 Depreciation Base …………………. . . . $10, 000 Salvage Value. . . . . 2, 000 Depreciation 200% DDB (Double) multiplier=2 Depreciable life 5 years SL Dep. Rate = 1/5=0. 2 a (DDB rate) = (200%) (SL rate) = 0. 40
S = $2, 000 End of Year Depreciation Book Value Bn 1 0. 4($10, 000) = $4, 000 $10, 000 - $4, 000 = $6, 000 2 0. 4(6, 000) = 2, 400 6, 000 – 2, 400 = 3, 600 3 0. 4(3, 600) = 1, 440 3, 600 – 1, 440 = 2, 160 4 0. 4(2, 160) = 864 $160 2, 160 – 160 = 2, 000 Adjusting to salvage value 5 0 Total = $8, 000 2, 000 – 0 = 2, 000 Note: Tax law does not permit to depreciate assets below their salvage
Example 9. 4 Declining Balance (DB) Depreciation Asset: Invoice Price ………………. . . $9, 000 Freight ……………. . . 500 Installation …………………. . . 500 Depreciation Base …………………. . $10, 000 Salvage Value. . . 0 Depreciation 200% DDB Depreciable life 5 years SL Dep. Rate = 1/5 a (DDB rate) = (200%) (SL rate) = 0. 40
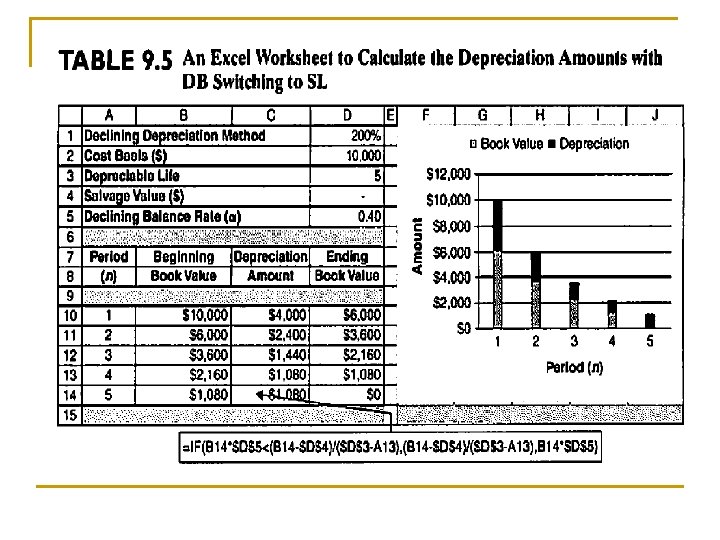
Example 9. 4 Declining Balance (DB) with conversion to Straight Line Depreciation (Bn > S) Suppose the asset given in example 9. 3 has a zero salvage value instead of $2, 000 (a) Without switching (b) With switching to SL n 1 2 3 4 5 Depreciation 10, 000(0. 4) = 4, 000 6, 000(0. 4) = 2, 400 3, 600(0. 4) = 1, 440 2, 160(0. 4) = 864 1, 296(0. 4) = 518 Book Value n $6, 000 3, 600 2, 160 1, 296 778 1 2 3 4 5 Book Depreciation Value 10, 000/5 = 2, 000 < 4, 000 $6, 000 6, 000/4 = 1, 500 < 2, 400 3, 600/3 = 1, 200 < 1, 440 2, 160/2 = 1, 080 > 864 1, 080/1 = 1, 080 > 518 0 Note: Without switching, we have not depreciated the entire cost of the asset and thus have not taken full advantage of depreciation’s benefits. The rule is; if DB depreciation in any year is less than (or equal to) the depreciation amount calculated by SL, switch to and remain with the SL method for the duration of the asset’s depreciable life. The Switch can be in any of the n years.
Declining Balance (DB) with conversion to Straight Line Depreciation (Bn > S) Straight line depreciation in year n: Consider I=15000, S=1000, N=7, using DDB with conversion to straight line method
Units – of – Production Method No. of units or operating hours are different from year to year Principle The number of service units consumed in that period. Formula Annual Depreciation Service units consumed for year Dn = x ( I – S ) total service units
Example 9. 5 Units – of – Production Depreciation v A truck for hauling coal has an estimated net cost of $55, 000 and is expected to give service for 250, 000 miles, resulting in $5, 000 a salvage value. Compute the allowed depreciation amount for the truck usage of 30, 000 miles Find: Depreciation amount this year Solution:
History of Tax Depreciation Methods Purpose: compute income taxes for the IRS Ø Assets placed in service prior to 1981 Use book depreciation methods (SL, DB) Ø Assets placed in service from 1981 to 1986 Use ACRS (Accelerated Cost Recovery System) Table Ø Assets placed in service after 1986 Use MACRS (Modified ACRS) Table
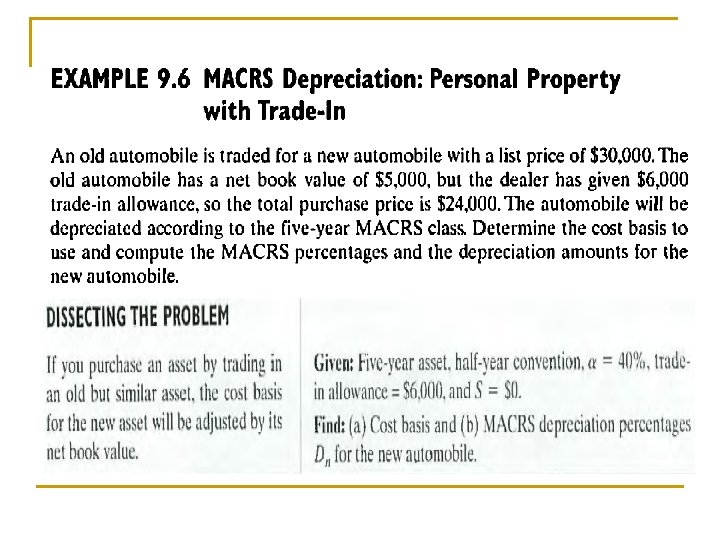
Modified Accelerated Cost Recovery Systems (MACRS) Personal Property: (movable property, includes assets such as machinery, vehicles, equipment, furniture, and similar items) Ø Depreciation method based on DB method switching to SL Ø Half-year convention (assumes all assets are placed in service at midyear) § Half year is allowed for the first year. § Half year is taken in the year following the end Zero salvage value Real Property: (includes houses and land) are classified into two categories: 1. residential rental property and 2. commercial building or properties Ø Ø SL Method; Mid-month convention; Zero salvage value
MACRS Property Classifications (ADR = Asset Depreciation Range) Recovery Period Personal Property Applicable Property 3 -year Special tools for manufacture of plastic products, fabricated metal products, and motor vehicles. 5 -year Automobiles, light trucks, high-tech equipment, equipment used for R&D, computerized telephone switching systems 7 -year Manufacturing equipment, office furniture, fixtures 10 -year Vessels, barges, tugs, railroad cars 15 -year Waste-water plants, telephone- distribution plants, or similar utility property. 20 -year Municipal sewers, electrical power plant. Property Real ADR Midpoint Class 27. 5 -year 39 -year Residential rental property Nonresidential real property including elevators and escalators
M A C R S Depreciation TABLE for Personal Property with Half-Year Conversion from Internal Revenue Service (IRS)
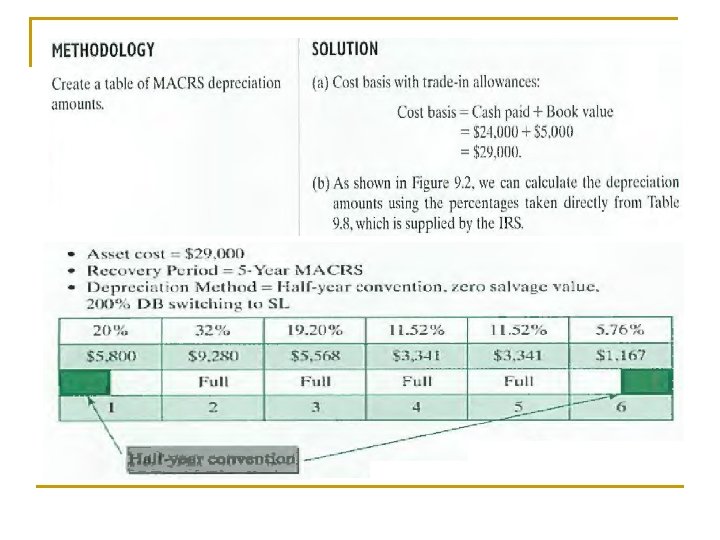
Example MACRS Depreciation Asset cost = $10, 000 Property class = 5 year MACRS Depreciation method = Half – year convention, zero salvage value, 200% DB switching to SL 20% 32% 19. 20% 11. 52% 5. 76% $2000 $3200 $1920 $1152 $576 Full 2 3 4 1 Half-year Convention 5 6
How to Determine “Accounting Profit” Item Gross Income Expenses Cost of goods sold Depreciation Interest expenses Operating expenses Taxable income Income taxes Net income (Accounting Profit)
Example Net Income within a year A company buys a numerically control (NC) machines for $28, 000 (year Zero) and uses it for five years, after which time it is scrapped. The allowed depreciation deduction during the first year is $4, 000, as the equipment falls into the seven year MACRS property category. (The first year depreciation rate is 14. 29%) The cost of goods produced by this NC machine should include a charge for the depreciation of the machine. Suppose the company estimates the following revenues and expenses, including the depreciation for the first operating year. Gross income = $50, 000 Cost of goods sold = $20, 000 Depreciation on NC machine = $4, 000 Operating expenses = $6, 000 If the company pays taxes at the rate of 40% on its taxable income, what is the net income from the project during the first year?
Example of Net Income within a year Item Amount Gross income (revenue) $50, 000 Expenses Cost of goods sold Depreciation Operating expenses 20, 000 4, 000 6, 000 Taxable income 20, 000 Taxes (40%) Net income 8, 000 $12, 000
Capital Expenditure versus Depreciation Expenses 0 $28, 000 0 1 2 ( 7 - year MACRS property ) 3 4 5 6 7 8 Capital expenditure (actual cash flow) 1(14. 29) 2 (24. 49) 3 (17. 49) 4 (12. 49) 5 (8. 93) 6 (8. 92) 7 (8. 93) 8 (4. 46) $1, 250 $4, 000 $6, 850 $4, 900 $3, 500 $2, 500 Allowed depreciation expenses (not cash flow)
Example Cash Flow from Operation versus Net Income Item Income Cash Flow Gross income (revenue) $50, 000 Expenses Cost of goods sold Depreciation Operating expenses 20, 000 4, 000 6, 000 -20, 000 Taxable income 20, 000 Taxes (40%) 8, 000 Net income Net cash flow from operation -6, 000 -8, 000 $12, 000 $16, 000
Net income versus net cash flow
U. S. Corporate Tax Schedule Marginal tax rate is defined as the rate applied to the last dollar of income. Taxable income Tax rate Tax computation 0 -$50, 000 15% $0 + 0. 15(D) $50, 001 -$75, 000 25% $7, 500 + 0. 25 (D) $75, 001 -$100, 000 34% $13, 750 + 0. 34 (D) $100, 001 -$335, 000 39% $22, 250 + 0. 39 (D) $335, 001 -$10, 000 34% $113, 900 + 0. 34 (D) $10, 001 -$15, 000 35% $3, 400, 000 + 0. 35 (D) $15, 000, 001 -$18, 333 38% $5, 150, 000 + 0. 38 (D) $18, 333, 334 and Up 35% $6, 416, 666 + 0. 35 (D) denotes the taxable income in excess of the lower bound of each tax bracket
Marginal and Effective (Average) Tax Rate for a Taxable Income of $16, 000 Taxable income Marginal Tax Amount of Taxes Rate Cumulative Taxes First $50, 000 15% $7, 500 Next $25, 000 25% 6, 250 13, 750 Next $25, 000 34% 8, 500 22, 250 Next $235, 000 39% 91, 650 113, 900 Next $9, 665, 000 34% 3, 286, 100 3, 400, 000 Next $5, 000 35% 1, 750, 000 5, 150, 000 Remaining $1, 000 38% 380, 000 $5, 530, 000
Example Corporate Income Taxes Facts: Capital expenditure $290, 000 (allowed depreciation) $58, 000 Gross Sales revenue $1, 250, 000 Expenses: Cost of goods sold $840, 000 Depreciation $58, 000 Leasing warehouse $20, 000 Question: Taxable income?
Taxable income: Gross income $1, 250, 000 - Expenses: (cost of goods sold) $840, 000 (depreciation) $58, 000 (leasing expense) $20, 000 Taxable income $332, 000 Income taxes: Taxable income Marginal Tax Rate Amount of Taxes Cumulative Taxes First $50, 000 15% $7, 500 $25, 000 25% 6, 250 13, 750 $25, 000 34% 8, 500 22, 250 $232, 000 39% 90, 480 112, 730
Average tax rate: Total taxes = $112, 730 Taxable income = $332, 000 Marginal tax rate: Tax rate that is applied to the last 39% dollar earned
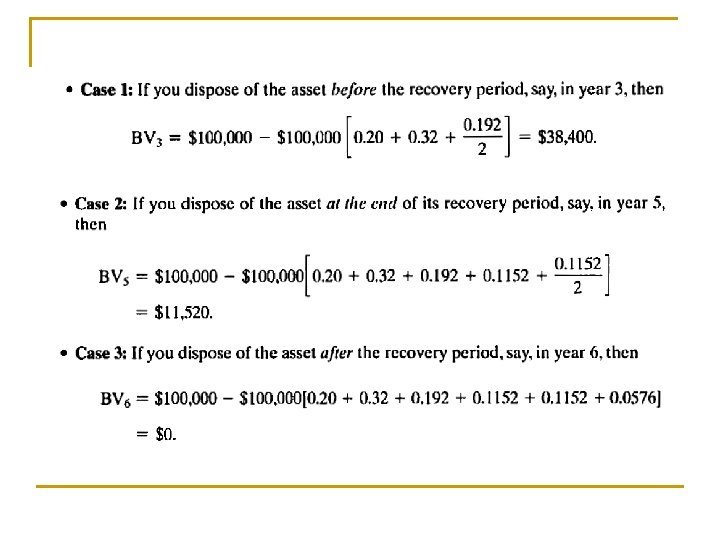
Gain Taxes on Asset Disposals n n When a depreciable asset used in business is sold for an amount that differs from its book value, the gains or losses have an important effect on income taxes. To calculate a gain or loss, we first need to determine the book value of the depreciable asset at the time of disposal. For a MACRS property, the year of disposal is charged onehalf of that year's annual depreciation amount, should the disposal occur during the recovery period. For example, let's consider a five-year MACRS property with a cost basis of $100, 000. 1 2 3 4 5 6
Disposal of a MACRS Property and Its Effect on Depreciation Allowances
Taxable Gains (or Losses) are defined as the differences between the salvage value and the book value. Case 1: Salvage value < Cost basis: gains (losses) = salvage value – book value ordinary gains (depreciation recapture) Case 2: Salvage value > Cost basis: gains = salvage value – book value + (cost basis – book value) = (salvage value – cost capital gains basis) ordinary gains
Capital Gains and Ordinary Gains Capital gains Total gains Ordinary gains or depreciation recapture Cost basis Book value Salvage value
Example 9. 9 A Drill press: $230, 000 Gains or Losses Project year: 3 years on MACRS: 7 -year property class Depreciable Asset Salvage value: $150, 000 at the end of Year 3 Total Dep. = 230, 000(0. 1429 + 0. 2449 + 0. 1749/2) = $109, 308 Book Value = 230, 000 -109, 308 = $120, 692 Ordinary Gains = Salvage Value - Book Value = $150, 000 - $120, 692 = $29, 308 Gains Tax (34%) = 0. 34 ($29, 308) = $9, 965 Net Proceeds from sale = $150, 000 - $9, 965 = $140, 035
Calculation of Gains or Losses on – Cases 2 - 4
Case 2: S = $120, 692 Case 3: S = $100, 000 Total Dep. = 230, 000(0. 1429 + 0. 2449 + 0. 1749/2) = $109, 308 Book Value = 230, 000 – 109, 308 = $120, 692 Ordinary Gains = Salvage Value – Book Value = $100, 000 - $120, 692 = $20, 692 Gains Tax or Tax credit (34%) = 0. 34 (-$20, 692) = - $7, 035 Net Proceeds from sale = $100, 000 – (-$7, 035) = $107, 035. 28
Case 4: S = $250, 000 Total Dep. = 230, 000(0. 1429 + 0. 2449 + 0. 1749/2) = $109, 308 Book Value = 230, 000 -109, 308 = $120, 692 Capital gains = Salvage Value – Cost Basis= $250, 000 - $230, 000=$20, 000 Ordinary Gains = Cost Basis– Book Value = $230, 000 - $120, 692 = $109, 308 Total Gains = Salvage Value – Book Value = $250, 000 - $120, 692 = $129, 308 Gains Tax (34%) = 0. 34 ($129, 308) = $43, 965 Net Proceeds from sale = $250, 000 – $43, 965 = $206, 035
PRACTICE PROBLEMS 9; 12; 17; 39; 40
9. 9) Consider the following data on an asset: Cost of the asset, I Useful life, N Salvage value, S $120, 000 7 years $0 Compute the annual depreciation allowances and resulting book values, using the Double Declining Balance method and then switching to the SL method
SOLUTION 9. 9) Cost of the asset, I Useful life, N Salvage value, S $120, 000 7 years $0 DDB method With switching n Dn =2/N = 0. 2857 0 1 2 3 4 5 6 7 $34, 284 $24, 489. 10 $17, 492. 6 $12, 495. 1 $8, 925. 3 shift }}}}}} SL method Dn =1/N Bn $120, 000 7 / $17, 143 $ 85, 716 6 / $14, 286 $ 61, 227 5 / $12, 245. 4 $ 43, 735 4/ $10, 933. 8 $ 31, 240 3 /$10, 413 $ 20, 827 2 /$10, 413. 5 $10, 413. 5 1 /$10, 413. 5 $0
9. 12) Consider the following data on an asset: Compute the annual depreciation allowances and resulting book values, by using DDB method and then switching to the SL method to reach with zero salvage value Cost of the asset, I Useful life, N Salvage value, S $38, 000 6 years $0
SOLUTION 9. 12) Cost of the asset, I Useful life, N $38, 000 6 years Salvage value, S $0 With switching n DDB method 0 1 2 3 4 5 6 $12, 667 $8, 444. 40 $5, 629. 47 $3, 753. 34 Dn =. 33333 Bn $38, 000 6 / $6, 333. 33 $25, 333 5 / $5, 066. 6 $16, 889. 60 4 / $4, 222. 15 $11, 260. 13 3 / $3, 753. 4 shift to SL $7, 506. 73 2 / $3, 753. 4 $3, 753. 40 1 / $3, 763. 4 $0 SL method Dn = 1 / 6
9. 17) New York Limousine Service owns 10 limos and uses the units of production method in computing depreciations on its limos. Each limo costing $32, 000 is expected to be driven 200, 000 miles and is expected to have a salvage value of $3, 000. Limo # 1 was driven 24, 000 miles in year 1 and 28, 000 miles in year 2. Determine the depreciation for each year and the book value at the end of year 2.
SOLUTION The book value of Limo # 1 at the end of year 2:
9. 39 Consider a five year MACRS asset that was purchased for $76, 000. Compute the gain or loss amounts if the asset were disposed of in: a) year 3 with a salvage value of $20, 000; b) year 5 with a salvage value of $10, 000; c) year 6 with salvage value of $5, 000. 1 2 3 4 5
Disposed of in year 3: Disposed of in year 5: Disposed of in year 6:
9. 40) An electrical appliance company purchased an industrial robot costing $320, 000 in year 0. The industrial robot, to be used for welding operations, is classified as a seven year MACRS recovery property. If the robot is to be sold after five years, compute the amounts of gains (losses) for the following three salvage values, assuming that both capital gains and ordinary incomes are taxed at 35%; a) $15, 000 b) $125, 000 c) $200, 000
9. 40) SOLUTION If sold at $15, 000: If sold at $125, 460: If sold at $200, 000: