Chapter 2 The Research Enterprise in Psychology Looking
- Slides: 33
Chapter 2: The Research Enterprise in Psychology
Looking for Laws: The Scientific Approach to Behavior • Basic assumption: events are governed by some lawful order • Goals: – Measurement and description – Understanding and prediction – Application and control
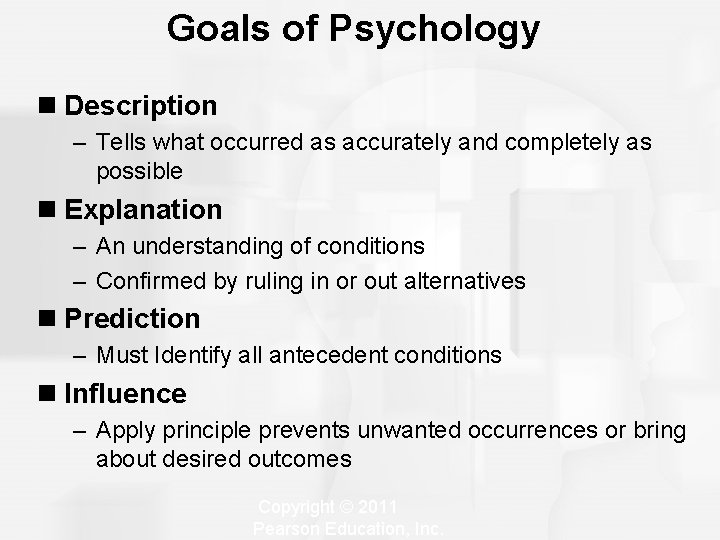
Goals of Psychology n Description – Tells what occurred as accurately and completely as possible n Explanation – An understanding of conditions – Confirmed by ruling in or out alternatives n Prediction – Must Identify all antecedent conditions n Influence – Apply principle prevents unwanted occurrences or bring about desired outcomes Copyright © 2011 Pearson Education, Inc.
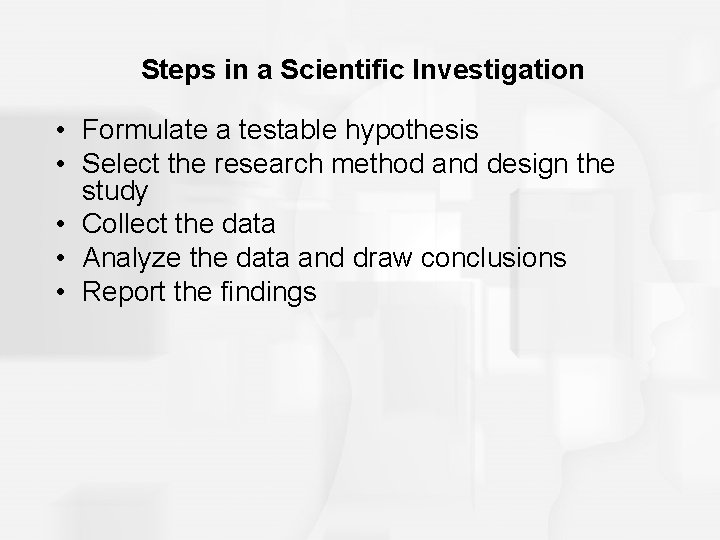
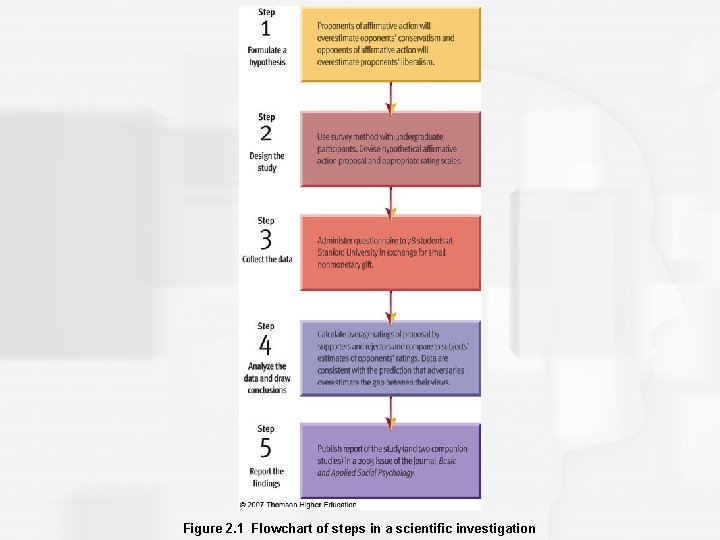
Steps in a Scientific Investigation • Formulate a testable hypothesis • Select the research method and design the study • Collect the data • Analyze the data and draw conclusions • Report the findings
Figure 2. 1 Flowchart of steps in a scientific investigation
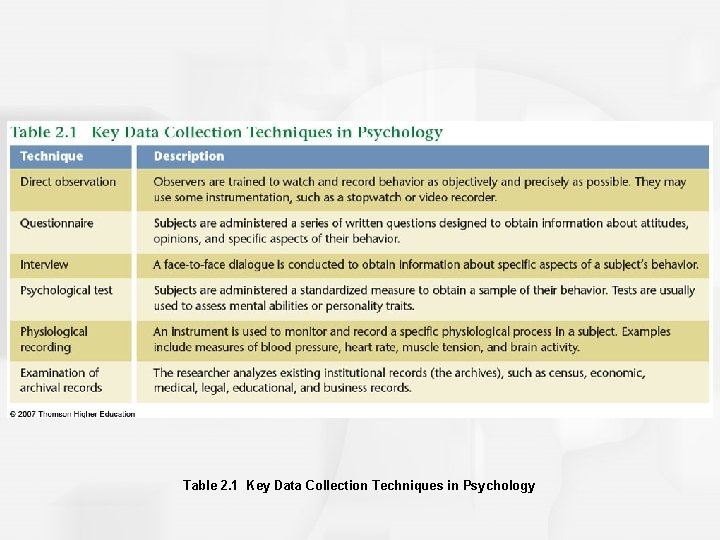
Table 2. 1 Key Data Collection Techniques in Psychology
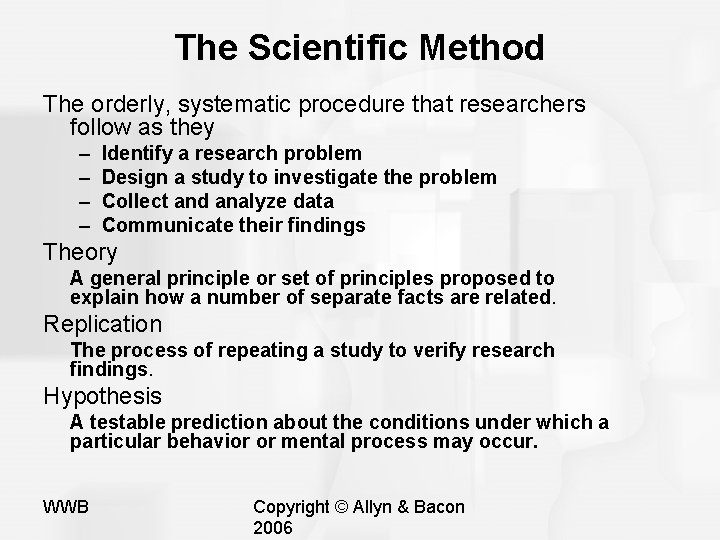
The Scientific Method The orderly, systematic procedure that researchers follow as they – – Identify a research problem Design a study to investigate the problem Collect and analyze data Communicate their findings Theory A general principle or set of principles proposed to explain how a number of separate facts are related. Replication The process of repeating a study to verify research findings. Hypothesis A testable prediction about the conditions under which a particular behavior or mental process may occur. WWB Copyright © Allyn & Bacon 2006
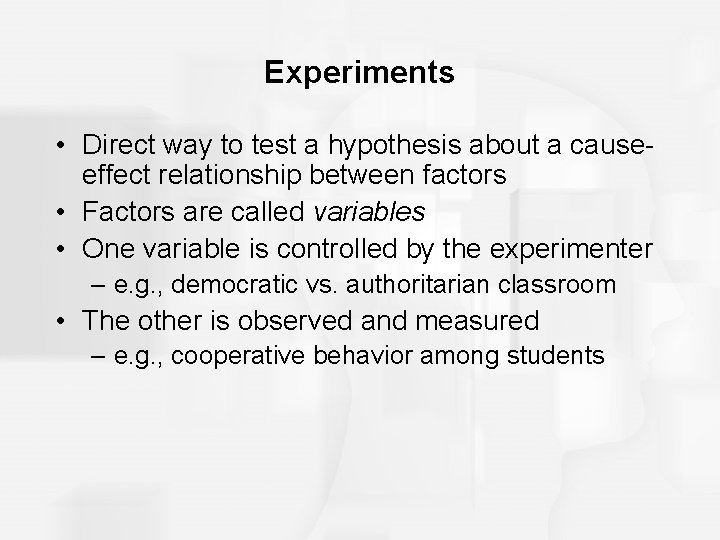
Experiments • Direct way to test a hypothesis about a causeeffect relationship between factors • Factors are called variables • One variable is controlled by the experimenter – e. g. , democratic vs. authoritarian classroom • The other is observed and measured – e. g. , cooperative behavior among students
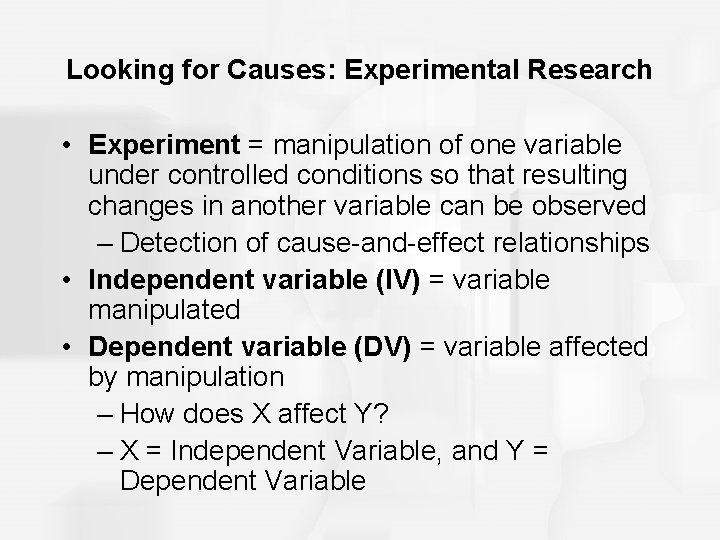
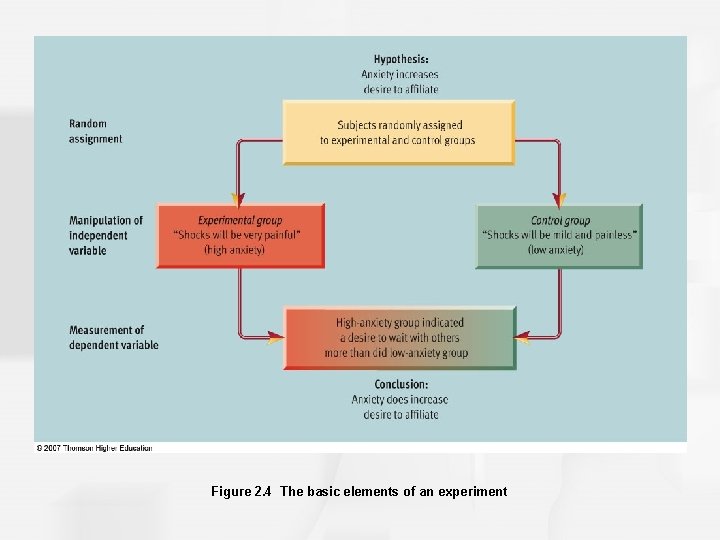
Looking for Causes: Experimental Research • Experiment = manipulation of one variable under controlled conditions so that resulting changes in another variable can be observed – Detection of cause-and-effect relationships • Independent variable (IV) = variable manipulated • Dependent variable (DV) = variable affected by manipulation – How does X affect Y? – X = Independent Variable, and Y = Dependent Variable
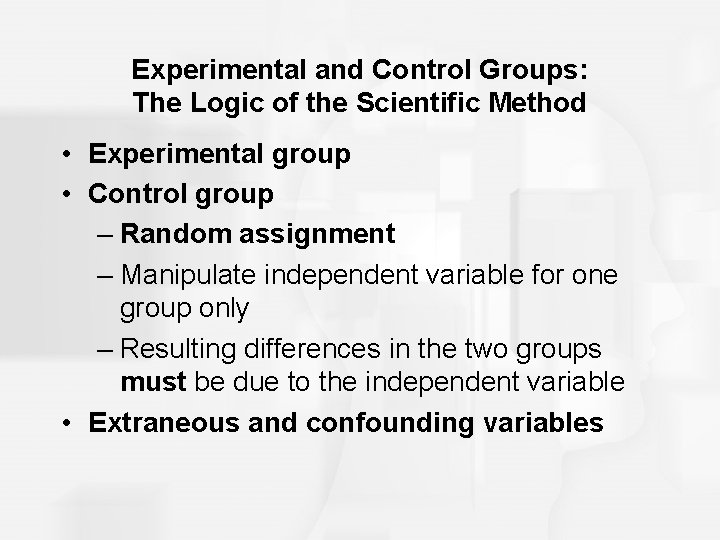
Experimental and Control Groups: The Logic of the Scientific Method • Experimental group • Control group – Random assignment – Manipulate independent variable for one group only – Resulting differences in the two groups must be due to the independent variable • Extraneous and confounding variables
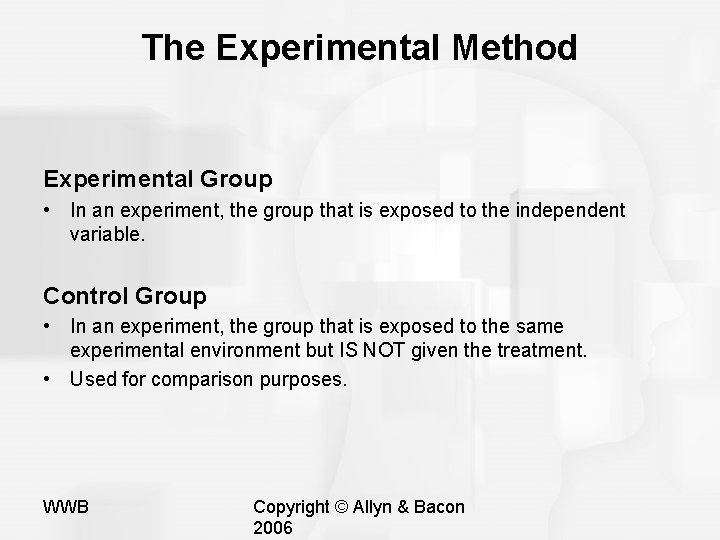
The Experimental Method Experimental Group • In an experiment, the group that is exposed to the independent variable. Control Group • In an experiment, the group that is exposed to the same experimental environment but IS NOT given the treatment. • Used for comparison purposes. WWB Copyright © Allyn & Bacon 2006
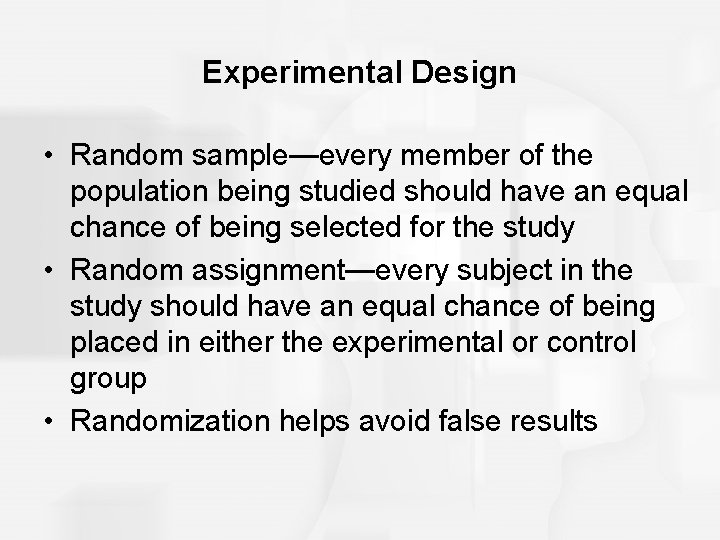
Experimental Design • Random sample—every member of the population being studied should have an equal chance of being selected for the study • Random assignment—every subject in the study should have an equal chance of being placed in either the experimental or control group • Randomization helps avoid false results
Figure 2. 4 The basic elements of an experiment
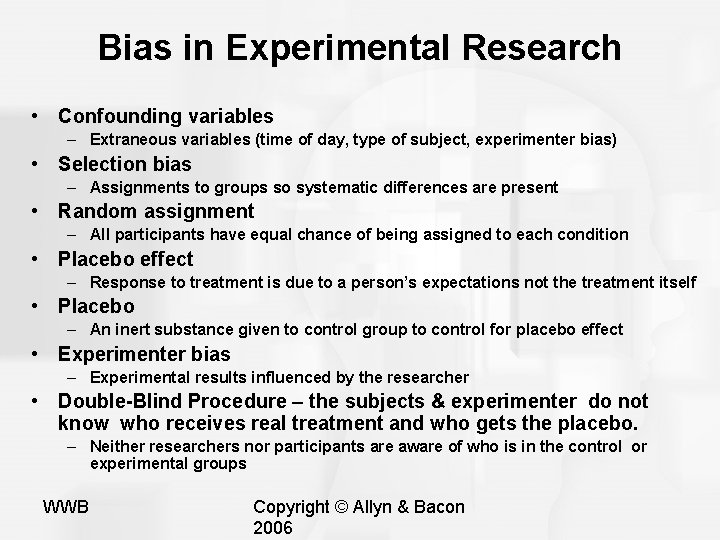
Bias in Experimental Research • Confounding variables – Extraneous variables (time of day, type of subject, experimenter bias) • Selection bias – Assignments to groups so systematic differences are present • Random assignment – All participants have equal chance of being assigned to each condition • Placebo effect – Response to treatment is due to a person’s expectations not the treatment itself • Placebo – An inert substance given to control group to control for placebo effect • Experimenter bias – Experimental results influenced by the researcher • Double-Blind Procedure – the subjects & experimenter do not know who receives real treatment and who gets the placebo. – Neither researchers nor participants are aware of who is in the control or experimental groups WWB Copyright © Allyn & Bacon 2006
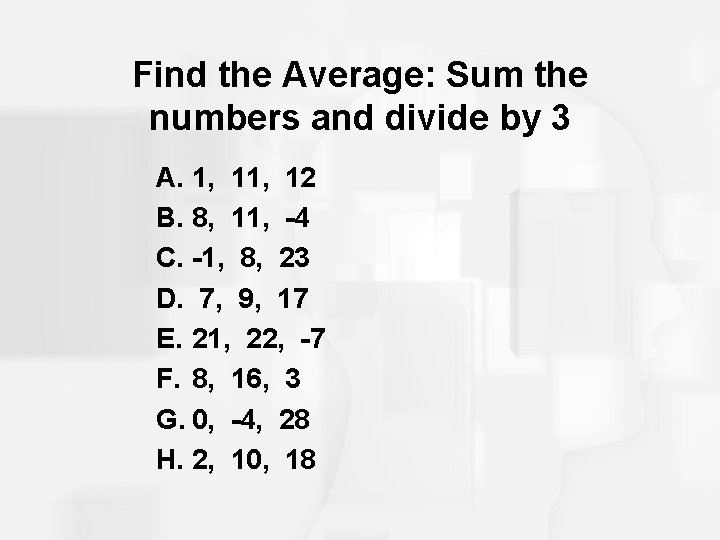
Find the Average: Sum the numbers and divide by 3 A. 1, 12 B. 8, 11, -4 C. -1, 8, 23 D. 7, 9, 17 E. 21, 22, -7 F. 8, 16, 3 G. 0, -4, 28 H. 2, 10, 18
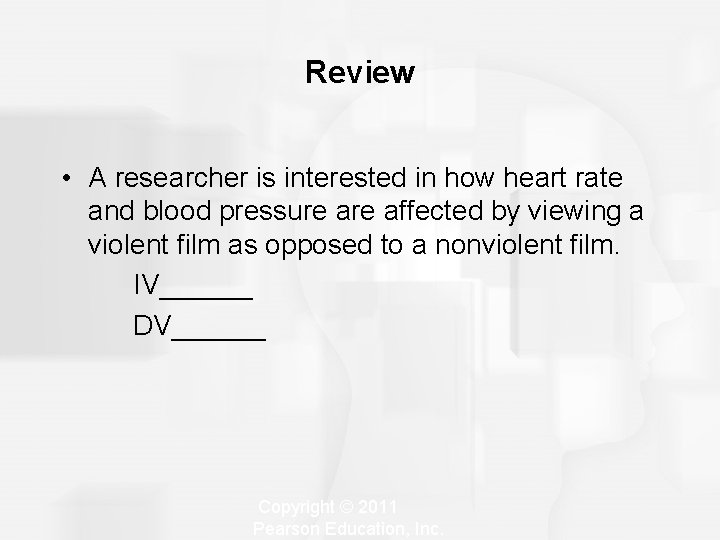
Review • A researcher is interested in how heart rate and blood pressure affected by viewing a violent film as opposed to a nonviolent film. IV______ DV______ Copyright © 2011 Pearson Education, Inc.
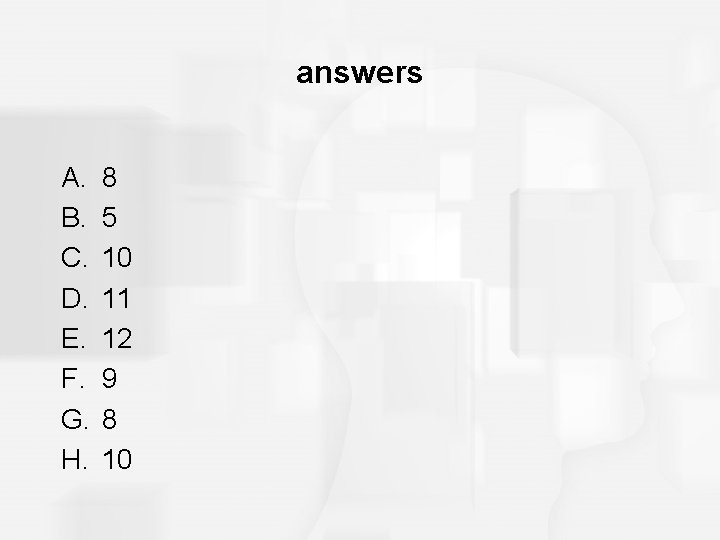
answers A. B. C. D. E. F. G. H. 8 5 10 11 12 9 8 10
Strengths and Weaknesses of Experimental Research • Strengths: – conclusions about cause-and-effect can be drawn • Weaknesses: – artificial nature of experiments – ethical and practical issues
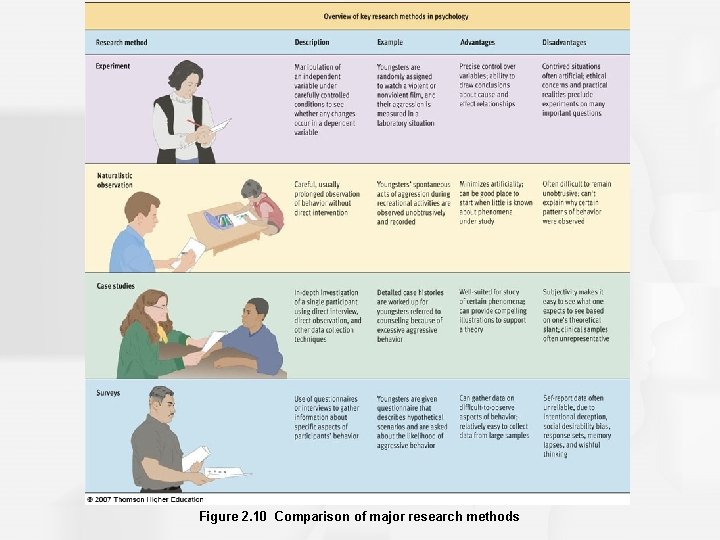
Descriptive Methods • Methods used when a researcher cannot manipulate the variables under study – Naturalistic observation – Case studies – Surveys • Allow researchers to describe patterns of behavior and discover links or associations between variables but cannot imply causation
Naturalistic Observation Researchers directly observe and record behavior rather than relying on subject descriptions. In naturalistic observation researcher records behavior as it occurs naturally.
Methods of Research Continued Case Study • A single individual or a small number of persons are studied in great depth, usually over an extended period of time. Survey • A method of study in which researchers use interviews and/or questionnaires to gather information about the attitudes, beliefs, experiences, or behaviors of a group of people. WWB Copyright © Allyn & Bacon 2006
Samples and Sampling • Population—large (potentially infinite) group represented by the sample. Findings are generalized to this group. • Sample—selected segment of the population • Representative sample—closely parallels the population on relevant characteristics • Random selection—every member of larger group has equal change of being selected for the study sample
Figure 2. 10 Comparison of major research methods
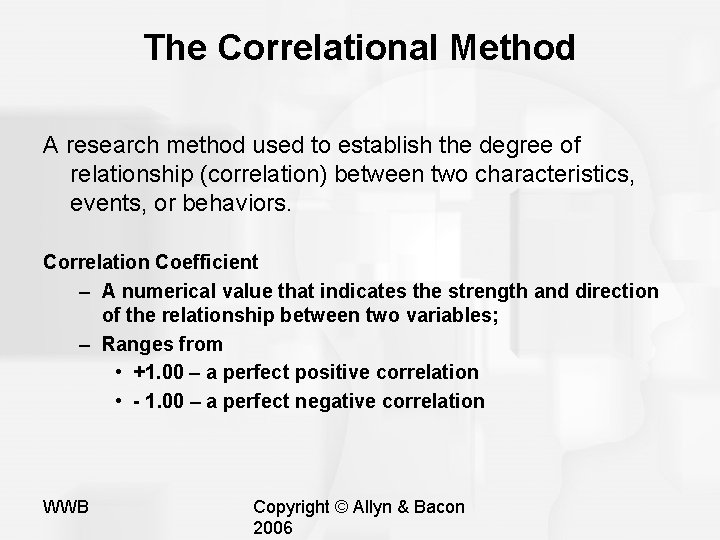
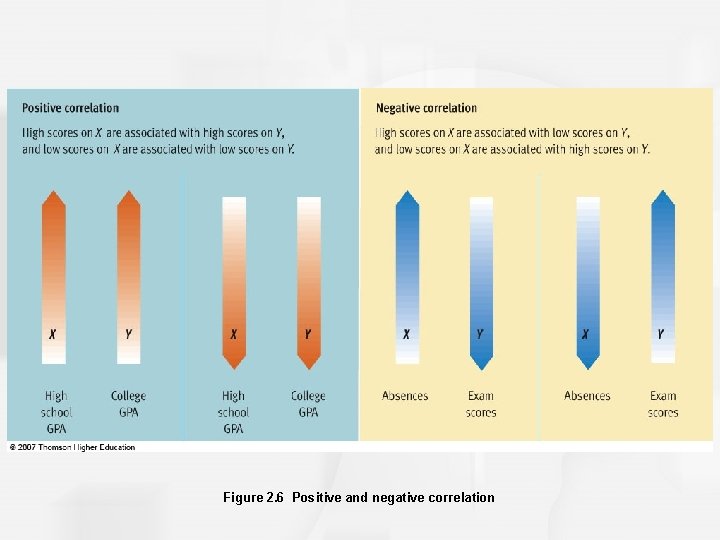
The Correlational Method A research method used to establish the degree of relationship (correlation) between two characteristics, events, or behaviors. Correlation Coefficient – A numerical value that indicates the strength and direction of the relationship between two variables; – Ranges from • +1. 00 – a perfect positive correlation • - 1. 00 – a perfect negative correlation WWB Copyright © Allyn & Bacon 2006
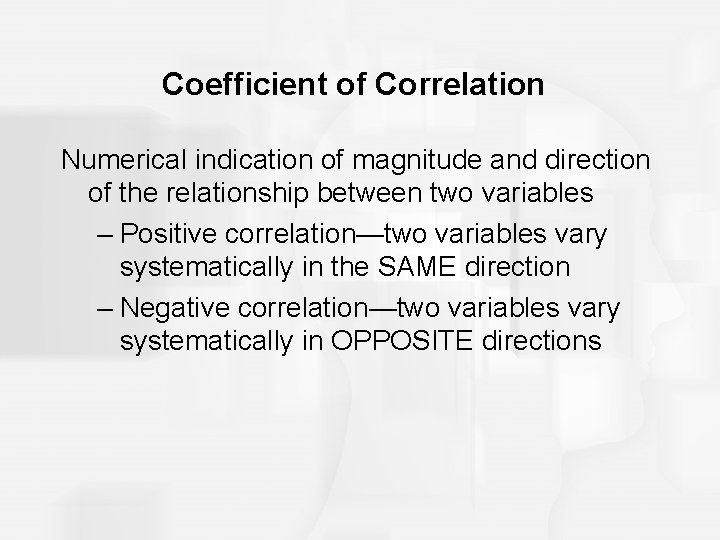
Coefficient of Correlation Numerical indication of magnitude and direction of the relationship between two variables – Positive correlation—two variables vary systematically in the SAME direction – Negative correlation—two variables vary systematically in OPPOSITE directions
Figure 2. 6 Positive and negative correlation
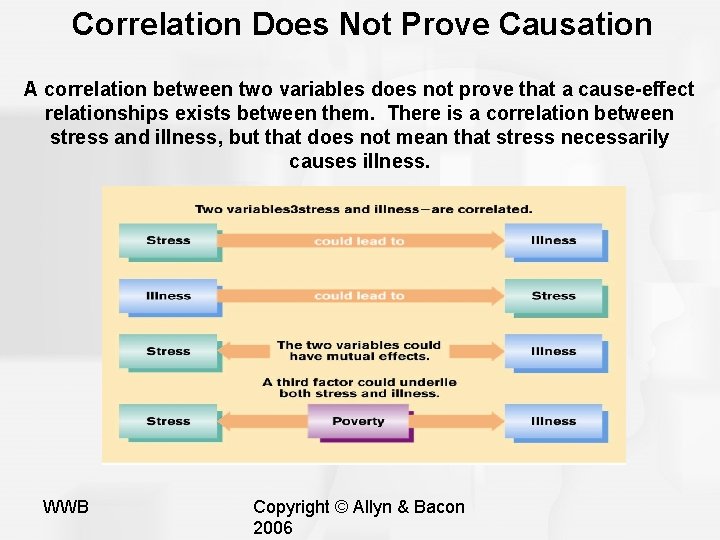
Correlation Does Not Prove Causation A correlation between two variables does not prove that a cause-effect relationships exists between them. There is a correlation between stress and illness, but that does not mean that stress necessarily causes illness. WWB Copyright © Allyn & Bacon 2006
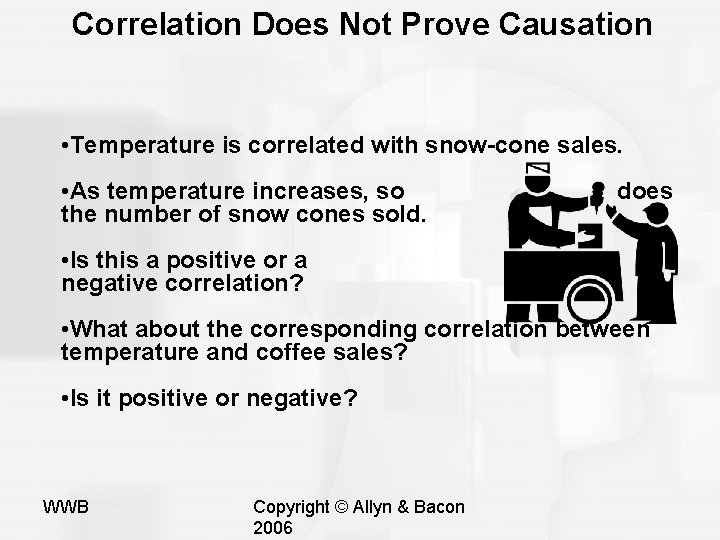
Correlation Does Not Prove Causation • Temperature is correlated with snow-cone sales. • As temperature increases, so the number of snow cones sold. does • Is this a positive or a negative correlation? • What about the corresponding correlation between temperature and coffee sales? • Is it positive or negative? WWB Copyright © Allyn & Bacon 2006
Correlation • Which of the following correlation coefficients would indicate the strongest relationship between variables? 1. a. +. 58 b. +. 19 c. -. 97 d. -. 42 2. a. -. 72 b. +. 70 c. -. 58 d. +. 62 Copyright © 2011 Pearson Education, Inc.
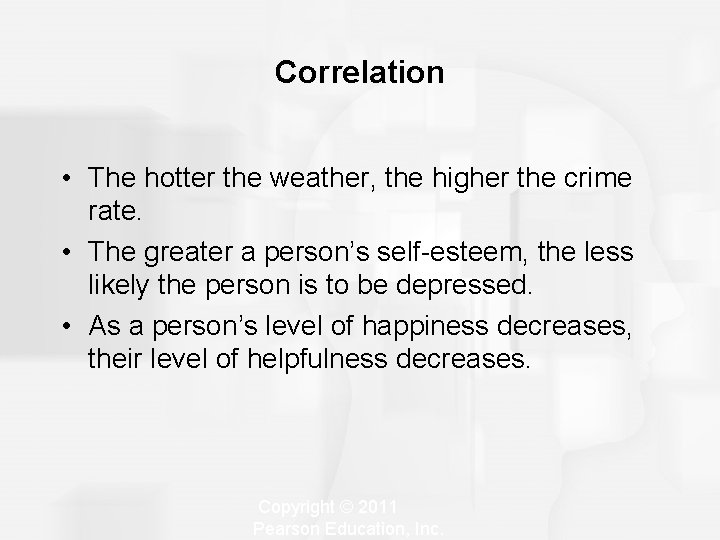
Correlation • The hotter the weather, the higher the crime rate. • The greater a person’s self-esteem, the less likely the person is to be depressed. • As a person’s level of happiness decreases, their level of helpfulness decreases. Copyright © 2011 Pearson Education, Inc.
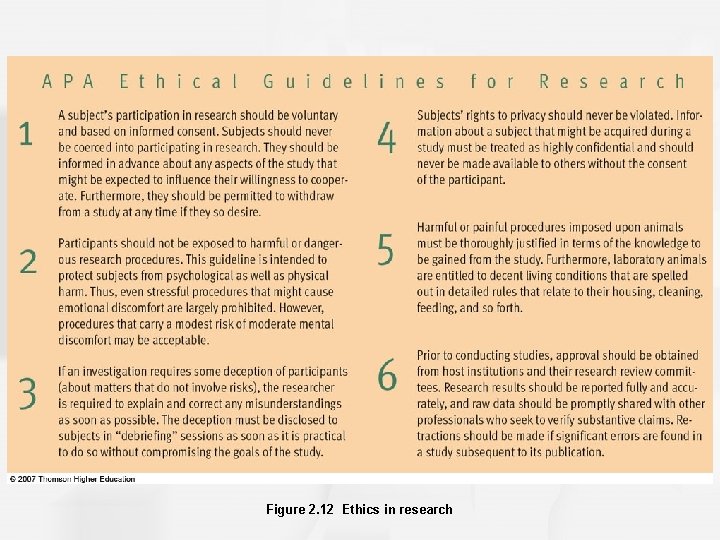
Figure 2. 12 Ethics in research
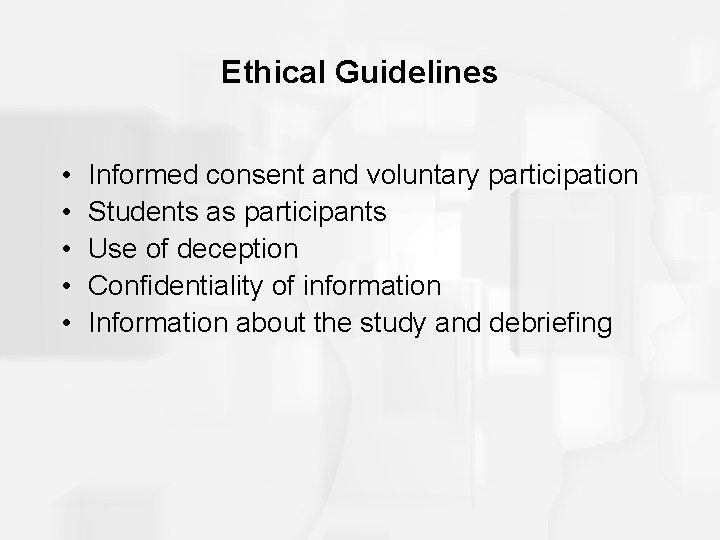
Ethical Guidelines • • • Informed consent and voluntary participation Students as participants Use of deception Confidentiality of information Information about the study and debriefing