Xpert Xlite Training Since 1975 Sutron has provided

- Slides: 86

Xpert / Xlite Training Since 1975 Sutron has provided real-time data collection, telemetry, and technical expertise for the design and production of user-friendly equipment and systems that monitor, control, manage, model, and forecast activities in areas of hydrology, meteorology, and water resource management. The key to our success is product integrity from design and manufacturing to installation and customer support. Sutron Corporation 22400 Davis Drive Sterling VA, 20164 703 -406 -2800

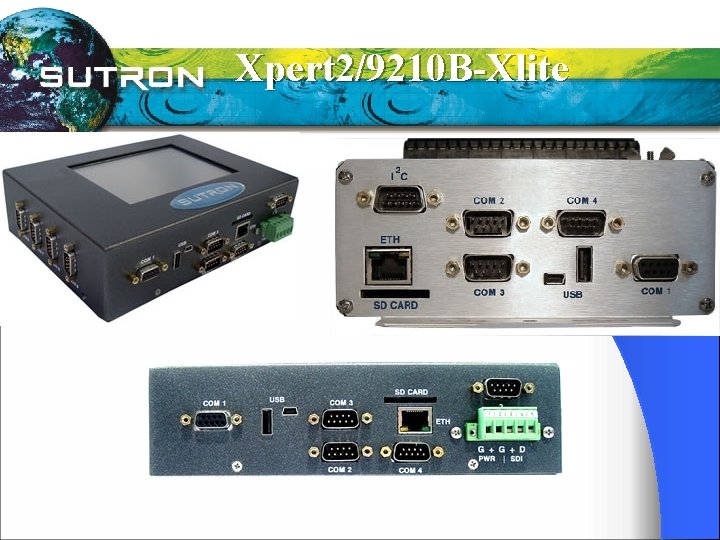
Xpert 2/9210 B-Xlite

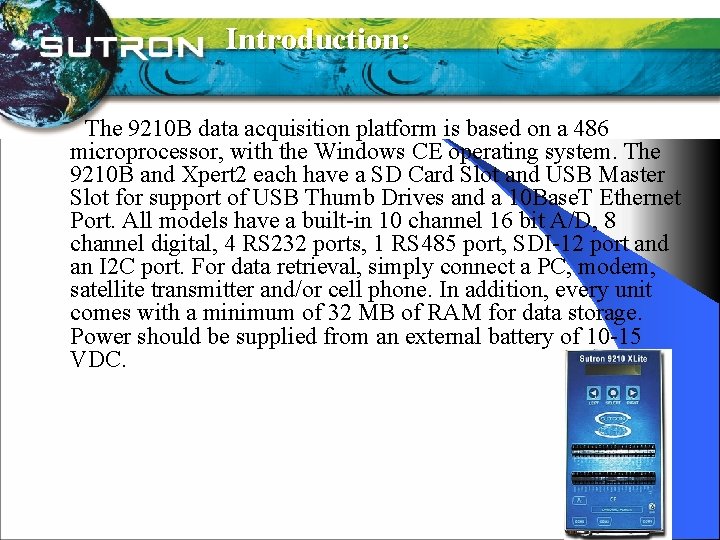
Introduction: The 9210 B data acquisition platform is based on a 486 microprocessor, with the Windows CE operating system. The 9210 B and Xpert 2 each have a SD Card Slot and USB Master Slot for support of USB Thumb Drives and a 10 Base. T Ethernet Port. All models have a built-in 10 channel 16 bit A/D, 8 channel digital, 4 RS 232 ports, 1 RS 485 port, SDI-12 port and an I 2 C port. For data retrieval, simply connect a PC, modem, satellite transmitter and/or cell phone. In addition, every unit comes with a minimum of 32 MB of RAM for data storage. Power should be supplied from an external battery of 10 -15 VDC.

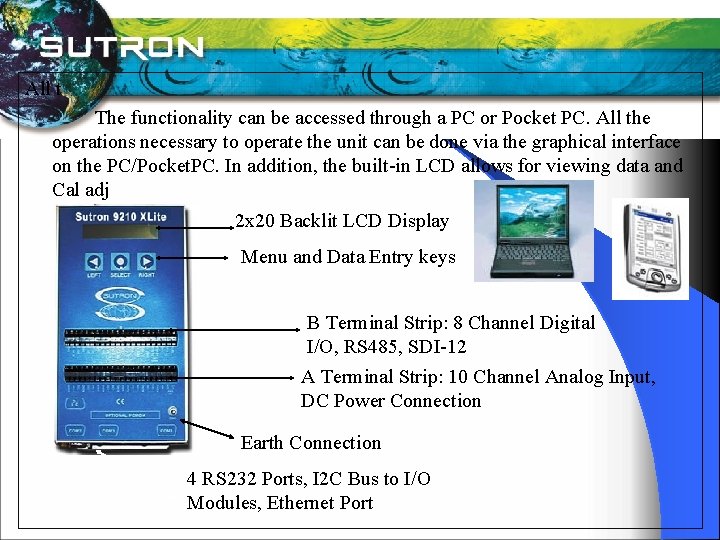
All t The functionality can be accessed through a PC or Pocket PC. All the operations necessary to operate the unit can be done via the graphical interface on the PC/Pocket. PC. In addition, the built-in LCD allows for viewing data and Cal adj 2 x 20 Backlit LCD Display Menu and Data Entry keys B Terminal Strip: 8 Channel Digital I/O, RS 485, SDI-12 A Terminal Strip: 10 Channel Analog Input, DC Power Connection Earth Connection 4 RS 232 Ports, I 2 C Bus to I/O Modules, Ethernet Port

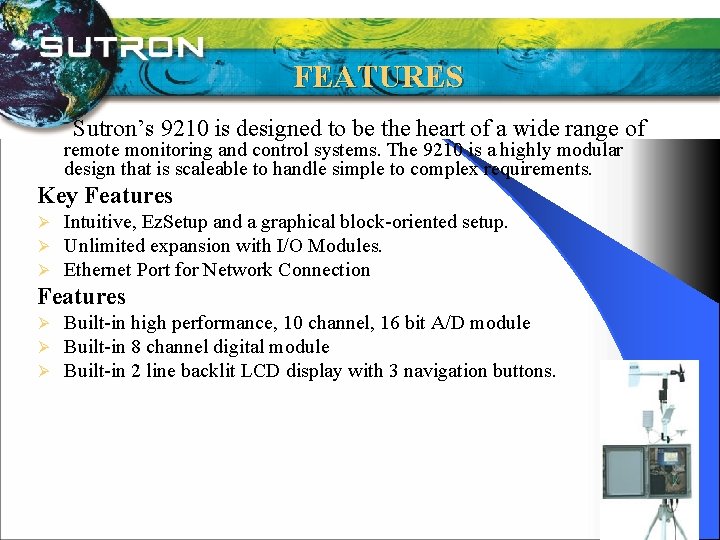
FEATURES Sutron’s 9210 is designed to be the heart of a wide range of remote monitoring and control systems. The 9210 is a highly modular design that is scaleable to handle simple to complex requirements. Key Features Ø Ø Ø Intuitive, Ez. Setup and a graphical block-oriented setup. Unlimited expansion with I/O Modules. Ethernet Port for Network Connection Features Ø Ø Ø Built-in high performance, 10 channel, 16 bit A/D module Built-in 8 channel digital module Built-in 2 line backlit LCD display with 3 navigation buttons.

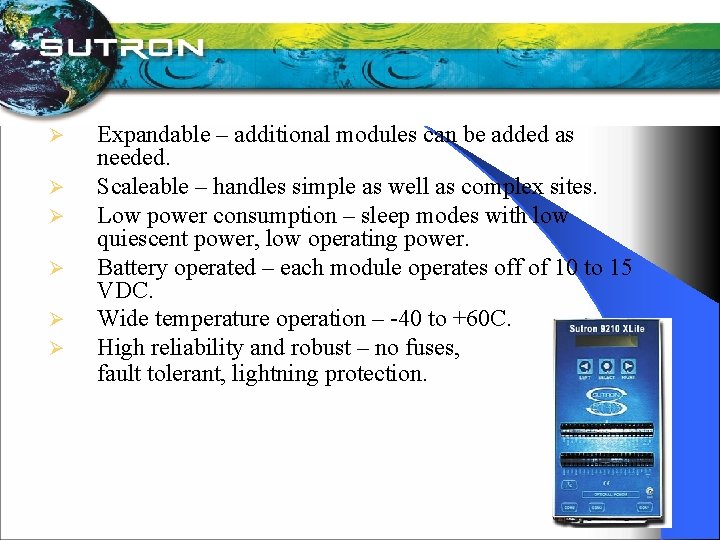
Ø Ø Ø Expandable – additional modules can be added as needed. Scaleable – handles simple as well as complex sites. Low power consumption – sleep modes with low quiescent power, low operating power. Battery operated – each module operates off of 10 to 15 VDC. Wide temperature operation – -40 to +60 C. High reliability and robust – no fuses, fault tolerant, lightning protection.

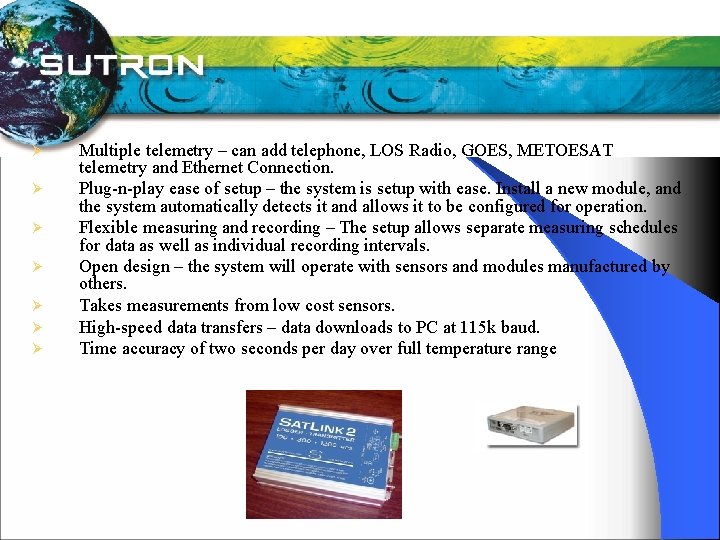
Ø Ø Ø Ø Multiple telemetry – can add telephone, LOS Radio, GOES, METOESAT telemetry and Ethernet Connection. Plug-n-play ease of setup – the system is setup with ease. Install a new module, and the system automatically detects it and allows it to be configured for operation. Flexible measuring and recording – The setup allows separate measuring schedules for data as well as individual recording intervals. Open design – the system will operate with sensors and modules manufactured by others. Takes measurements from low cost sensors. High-speed data transfers – data downloads to PC at 115 k baud. Time accuracy of two seconds per day over full temperature range.

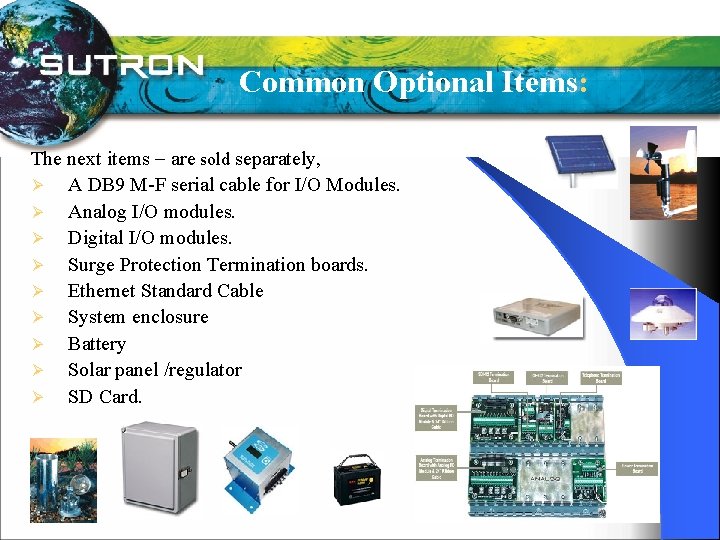
Common Optional Items: The next items are sold separately, Ø A DB 9 M-F serial cable for I/O Modules. Ø Analog I/O modules. Ø Digital I/O modules. Ø Surge Protection Termination boards. Ø Ethernet Standard Cable Ø System enclosure Ø Battery Ø Solar panel /regulator Ø SD Card.

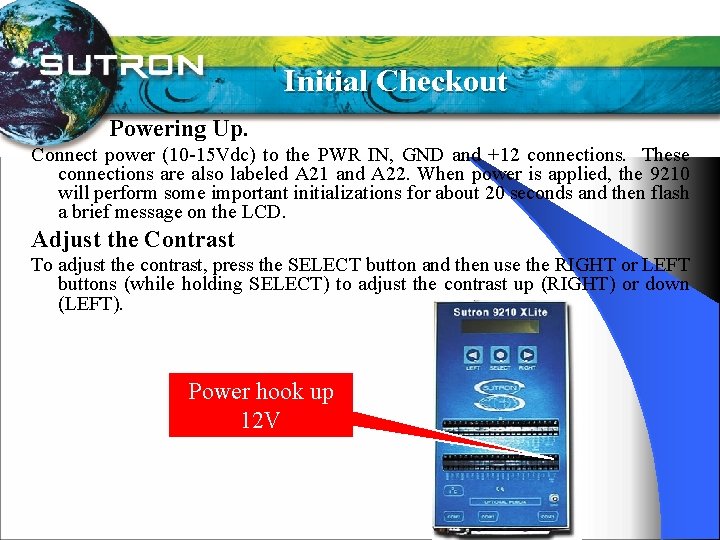
Initial Checkout Powering Up. Connect power (10 -15 Vdc) to the PWR IN, GND and +12 connections. These connections are also labeled A 21 and A 22. When power is applied, the 9210 will perform some important initializations for about 20 seconds and then flash a brief message on the LCD. Adjust the Contrast To adjust the contrast, press the SELECT button and then use the RIGHT or LEFT buttons (while holding SELECT) to adjust the contrast up (RIGHT) or down (LEFT). Power hook up 12 V

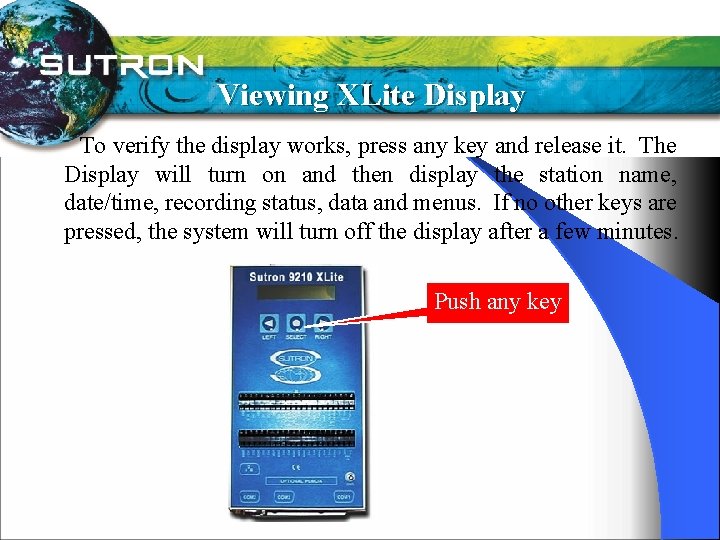
Viewing XLite Display To verify the display works, press any key and release it. The Display will turn on and then display the station name, date/time, recording status, data and menus. If no other keys are pressed, the system will turn off the display after a few minutes. Push any key

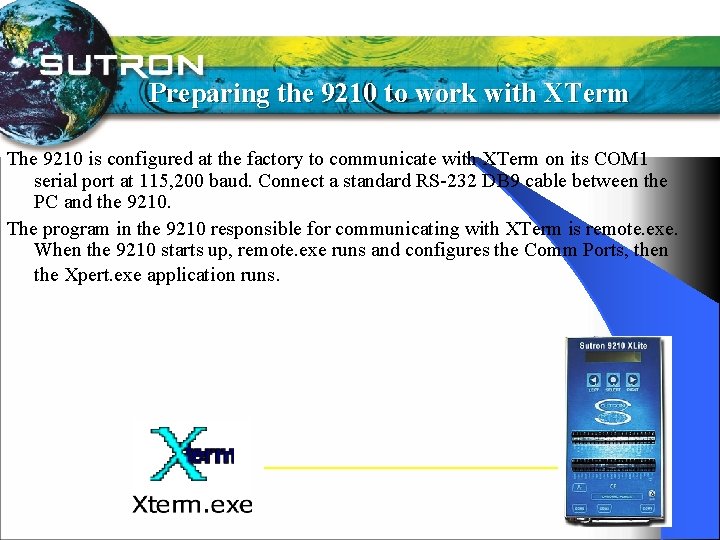
Preparing the 9210 to work with XTerm The 9210 is configured at the factory to communicate with XTerm on its COM 1 serial port at 115, 200 baud. Connect a standard RS-232 DB 9 cable between the PC and the 9210. The program in the 9210 responsible for communicating with XTerm is remote. exe. When the 9210 starts up, remote. exe runs and configures the Comm Ports, then the Xpert. exe application runs.

Installing Xterm XTerm is a PC program used to setup the 9210 and download data There is no special installation needed for XTerm on a desktop PC. Simply copy it to any folder on the PC. You can download the latest version from www. sutron. com downloads. To install XTerm. PPC on a Pocket. PC, run its installation program from a desktop PC that already has Active. Sync 3. 1+ installed.

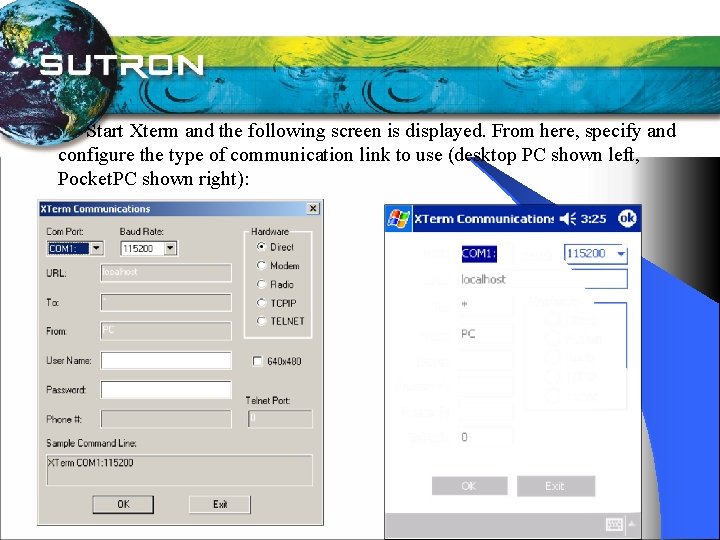
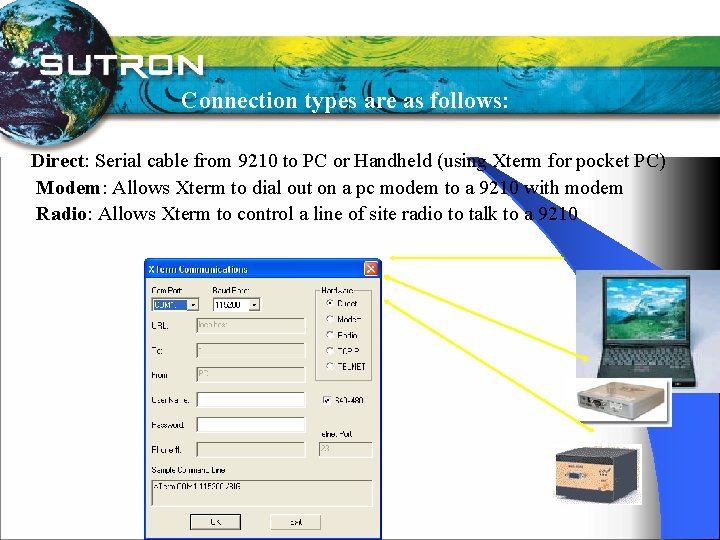
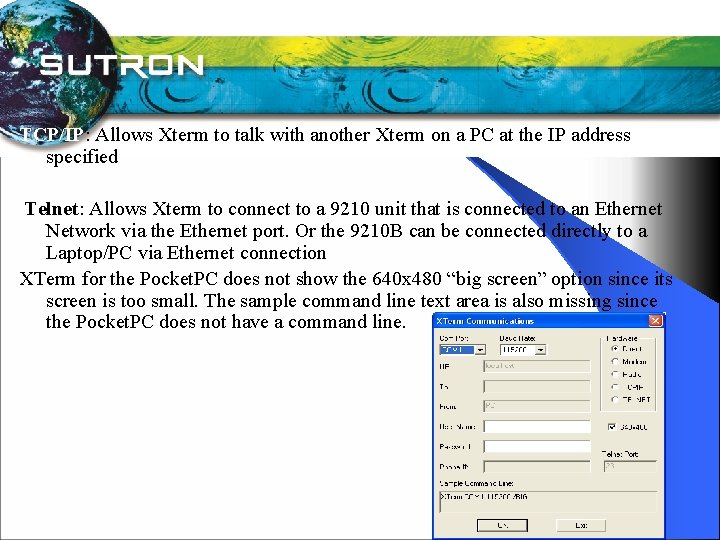
Start Xterm and the following screen is displayed. From here, specify and configure the type of communication link to use (desktop PC shown left, Pocket. PC shown right):

Connection types are as follows: Direct: Serial cable from 9210 to PC or Handheld (using Xterm for pocket PC) Modem: Allows Xterm to dial out on a pc modem to a 9210 with modem Radio: Allows Xterm to control a line of site radio to talk to a 9210

TCP/IP: Allows Xterm to talk with another Xterm on a PC at the IP address specified Telnet: Allows Xterm to connect to a 9210 unit that is connected to an Ethernet Network via the Ethernet port. Or the 9210 B can be connected directly to a Laptop/PC via Ethernet connection XTerm for the Pocket. PC does not show the 640 x 480 “big screen” option since its screen is too small. The sample command line text area is also missing since the Pocket. PC does not have a command line.

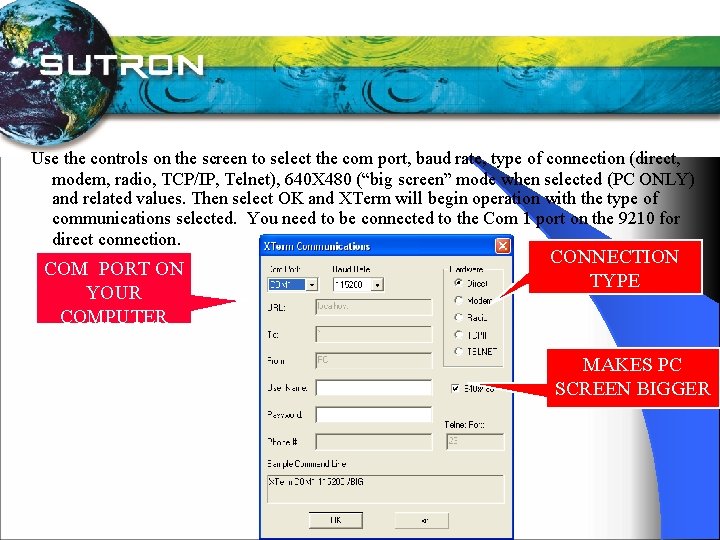
Use the controls on the screen to select the com port, baud rate, type of connection (direct, modem, radio, TCP/IP, Telnet), 640 X 480 (“big screen” mode when selected (PC ONLY) and related values. Then select OK and XTerm will begin operation with the type of communications selected. You need to be connected to the Com 1 port on the 9210 for direct connection. COM PORT ON YOUR COMPUTER CONNECTION TYPE MAKES PC SCREEN BIGGER

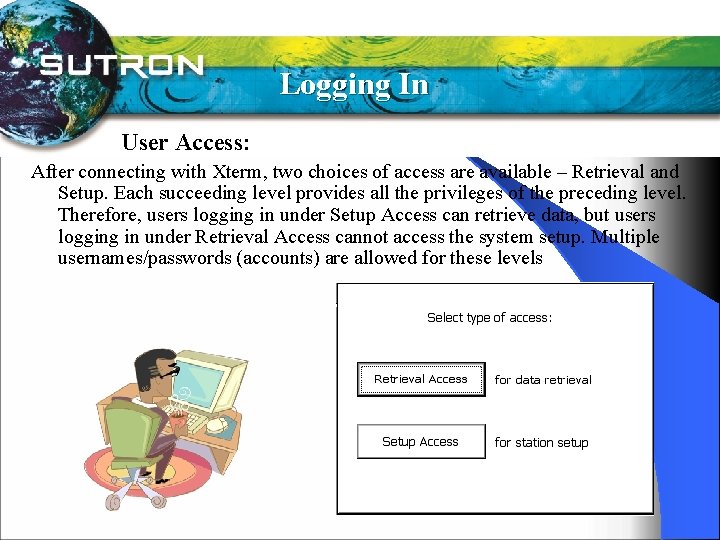
Logging In User Access: After connecting with Xterm, two choices of access are available – Retrieval and Setup. Each succeeding level provides all the privileges of the preceding level. Therefore, users logging in under Setup Access can retrieve data, but users logging in under Retrieval Access cannot access the system setup. Multiple usernames/passwords (accounts) are allowed for these levels.

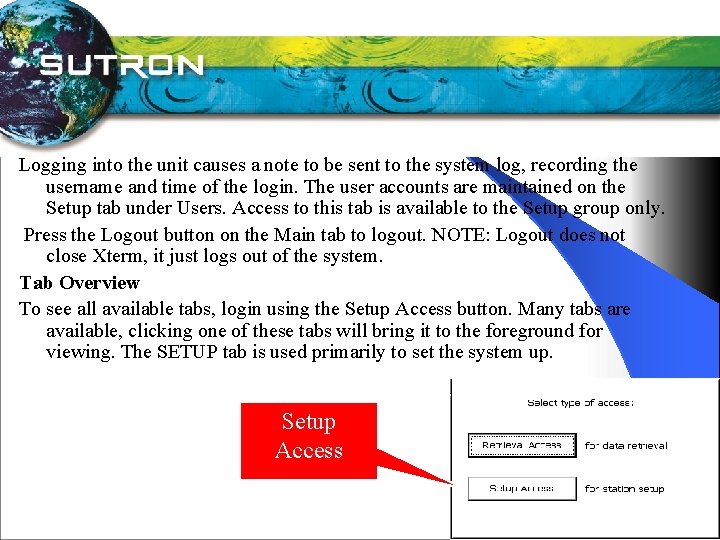
Logging into the unit causes a note to be sent to the system log, recording the username and time of the login. The user accounts are maintained on the Setup tab under Users. Access to this tab is available to the Setup group only. Press the Logout button on the Main tab to logout. NOTE: Logout does not close Xterm, it just logs out of the system. Tab Overview To see all available tabs, login using the Setup Access button. Many tabs are available, clicking one of these tabs will bring it to the foreground for viewing. The SETUP tab is used primarily to set the system up. Setup Access

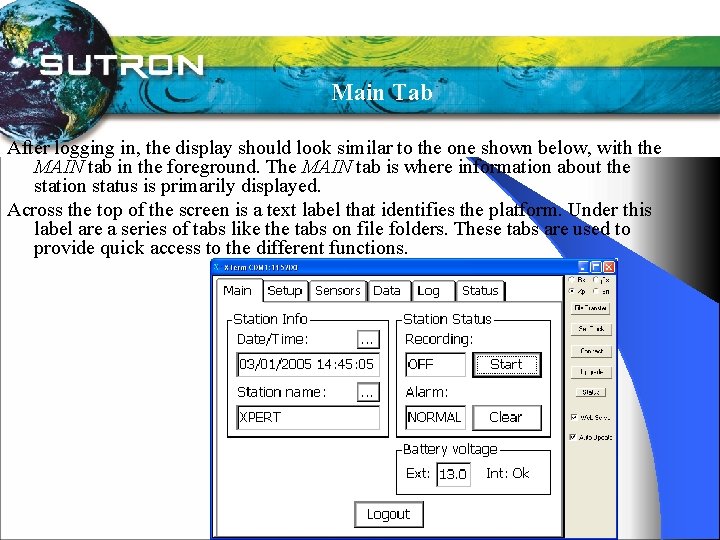
Main Tab After logging in, the display should look similar to the one shown below, with the MAIN tab in the foreground. The MAIN tab is where information about the station status is primarily displayed. Across the top of the screen is a text label that identifies the platform. Under this label are a series of tabs like the tabs on file folders. These tabs are used to provide quick access to the different functions.

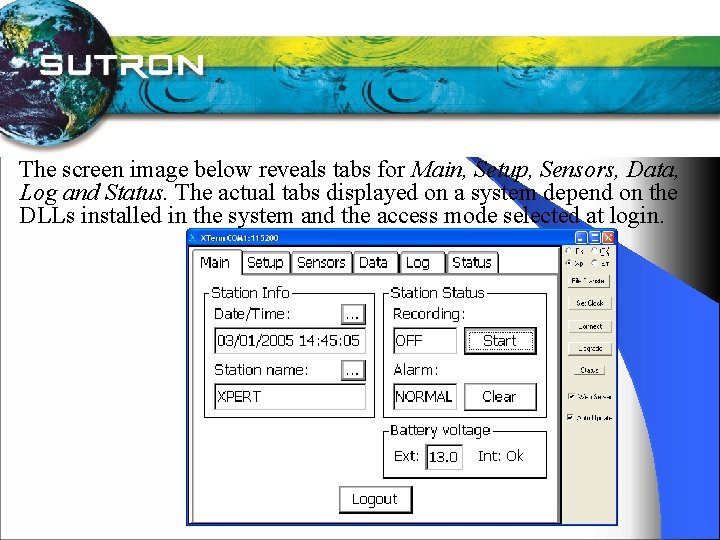
The screen image below reveals tabs for Main, Setup, Sensors, Data, Log and Status. The actual tabs displayed on a system depend on the DLLs installed in the system and the access mode selected at login.

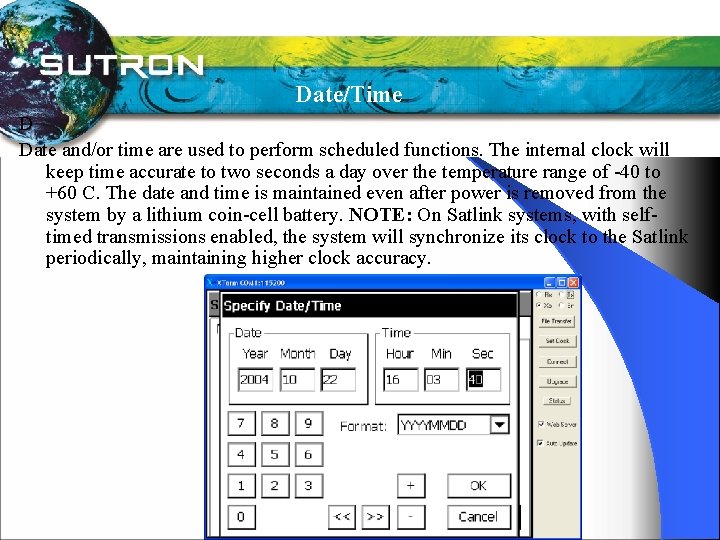
Date/Time D Date and/or time are used to perform scheduled functions. The internal clock will keep time accurate to two seconds a day over the temperature range of -40 to +60 C. The date and time is maintained even after power is removed from the system by a lithium coin-cell battery. NOTE: On Satlink systems, with selftimed transmissions enabled, the system will synchronize its clock to the Satlink periodically, maintaining higher clock accuracy.

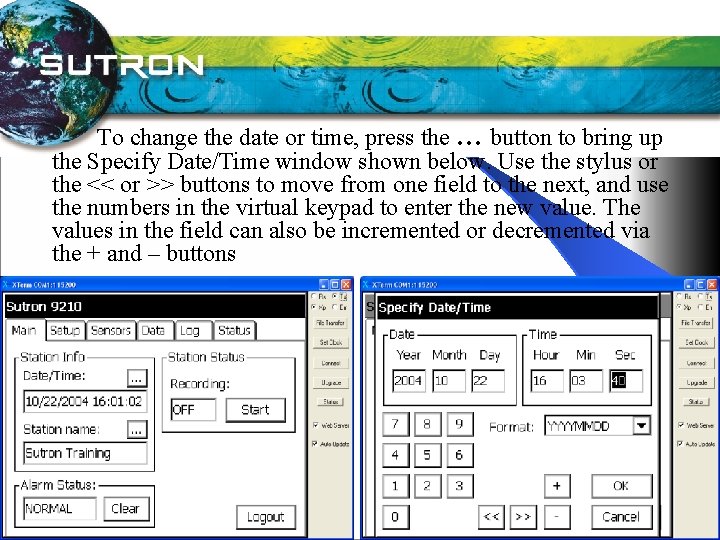
To change the date or time, press the … button to bring up the Specify Date/Time window shown below. Use the stylus or the << or >> buttons to move from one field to the next, and use the numbers in the virtual keypad to enter the new value. The values in the field can also be incremented or decremented via the + and – buttons.

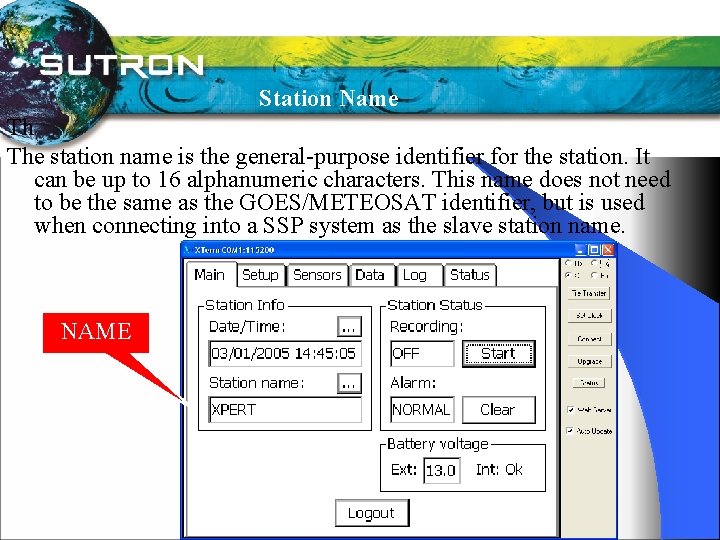
Station Name Th The station name is the general-purpose identifier for the station. It can be up to 16 alphanumeric characters. This name does not need to be the same as the GOES/METEOSAT identifier, but is used when connecting into a SSP system as the slave station name. NAME

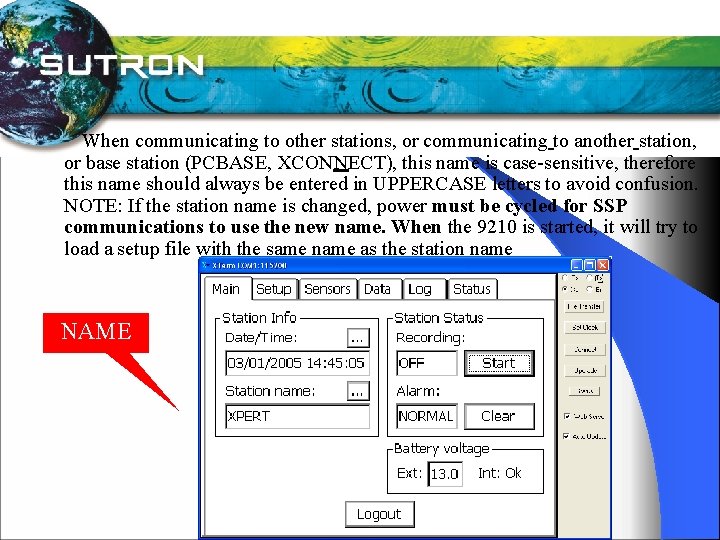
When communicating to other stations, or communicating to another station, or base station (PCBASE, XCONNECT), this name is case-sensitive, therefore this name should always be entered in UPPERCASE letters to avoid confusion. NOTE: If the station name is changed, power must be cycled for SSP communications to use the new name. When the 9210 is started, it will try to load a setup file with the same name as the station name. NAME

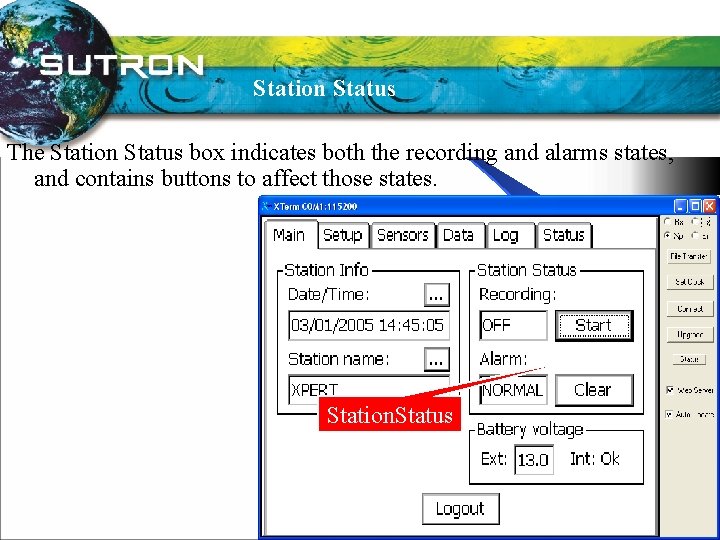
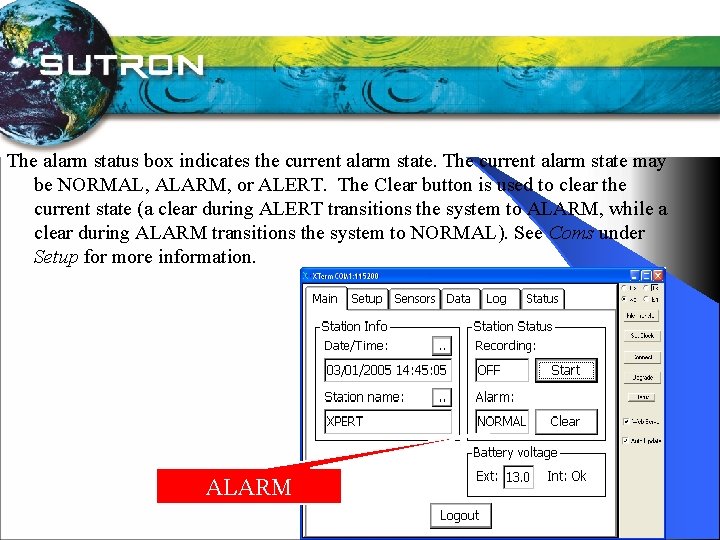
Station Status The Station Status box indicates both the recording and alarms states, and contains buttons to affect those states. Station. Status

The alarm status box indicates the current alarm state. The current alarm state may be NORMAL, ALARM, or ALERT. The Clear button is used to clear the current state (a clear during ALERT transitions the system to ALARM, while a clear during ALARM transitions the system to NORMAL). See Coms under Setup for more information. ALARM

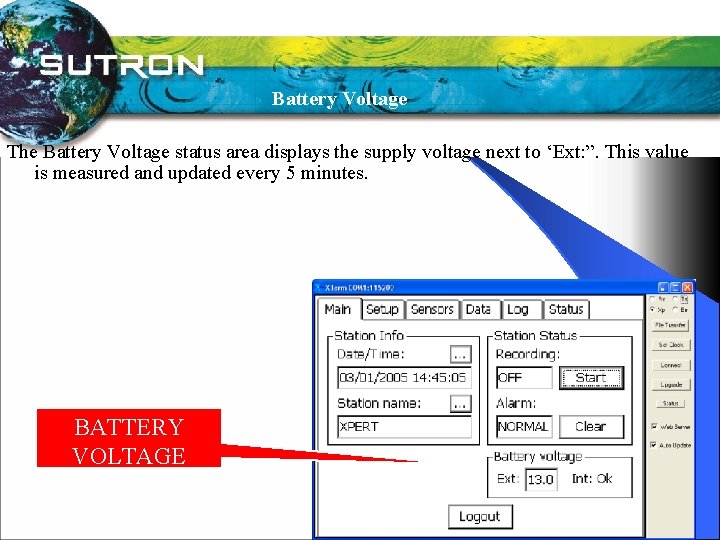
Battery Voltage The Battery Voltage status area displays the supply voltage next to ‘Ext: ”. This value is measured and updated every 5 minutes. BATTERY VOLTAGE

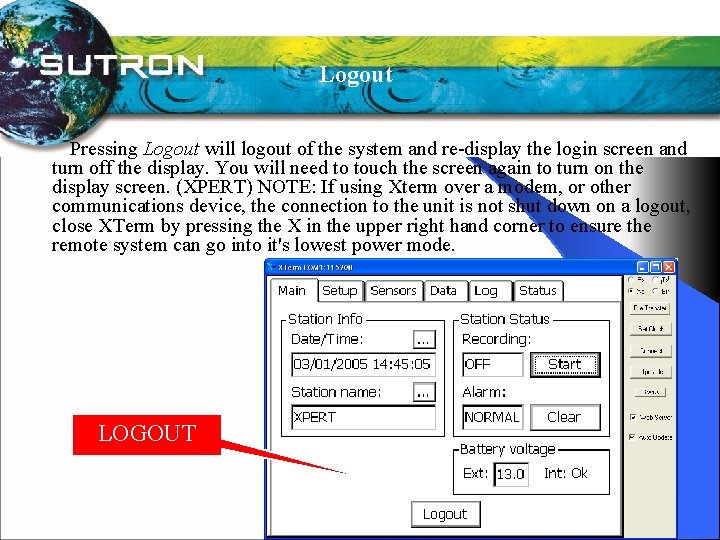
Logout Pressing Logout will logout of the system and re-display the login screen and turn off the display. You will need to touch the screen again to turn on the display screen. (XPERT) NOTE: If using Xterm over a modem, or other communications device, the connection to the unit is not shut down on a logout, close XTerm by pressing the X in the upper right hand corner to ensure the remote system can go into it's lowest power mode. LOGOUT

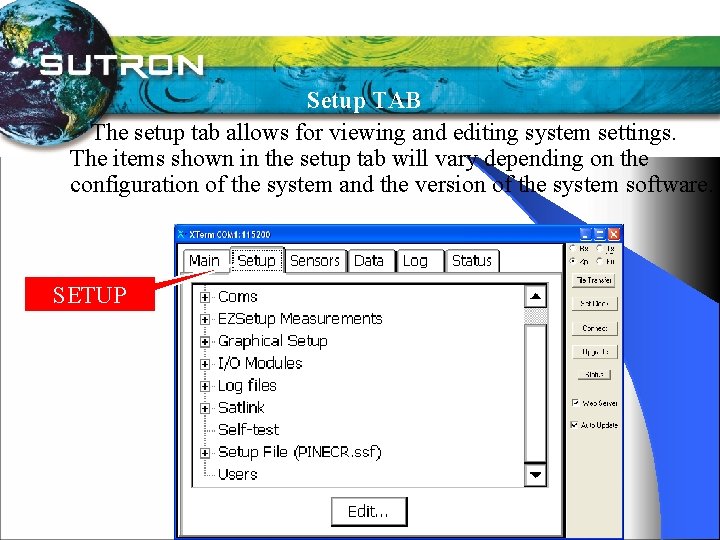
Setup TAB The setup tab allows for viewing and editing system settings. The items shown in the setup tab will vary depending on the configuration of the system and the version of the system software. SETUP

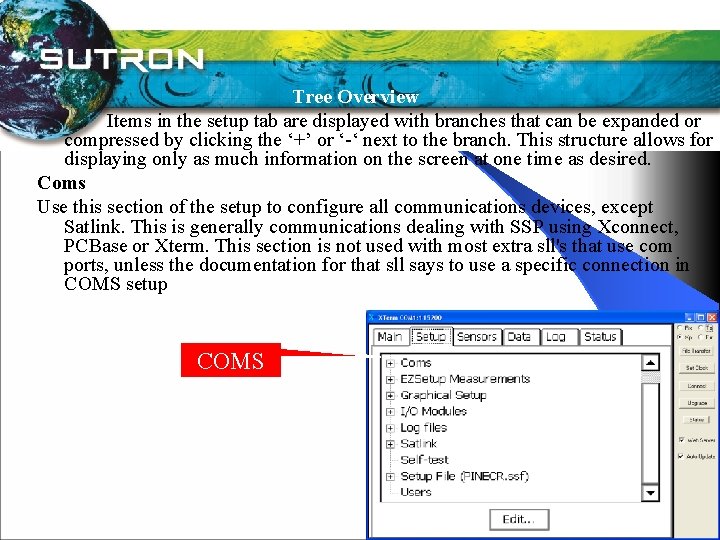
Tree Overview Items in the setup tab are displayed with branches that can be expanded or compressed by clicking the ‘+’ or ‘-‘ next to the branch. This structure allows for displaying only as much information on the screen at one time as desired. Coms Use this section of the setup to configure all communications devices, except Satlink. This is generally communications dealing with SSP using Xconnect, PCBase or Xterm. This section is not used with most extra sll's that use com ports, unless the documentation for that sll says to use a specific connection in COMS setup. COMS

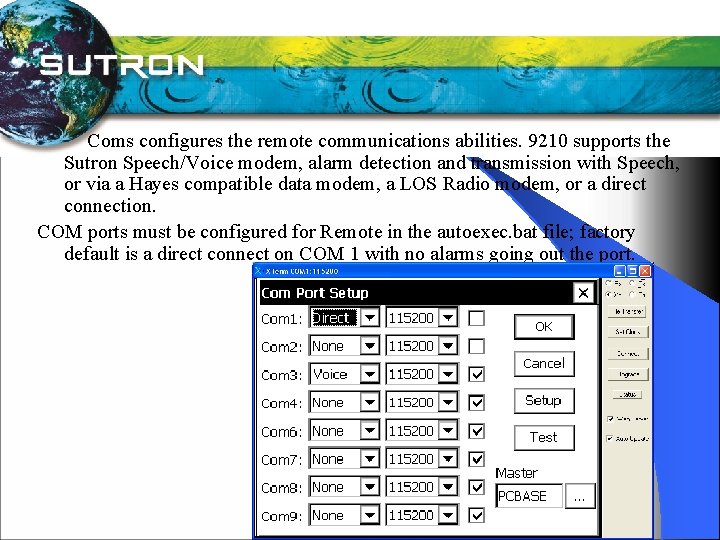
Coms configures the remote communications abilities. 9210 supports the Sutron Speech/Voice modem, alarm detection and transmission with Speech, or via a Hayes compatible data modem, a LOS Radio modem, or a direct connection. COM ports must be configured for Remote in the autoexec. bat file; factory default is a direct connect on COM 1 with no alarms going out the port.

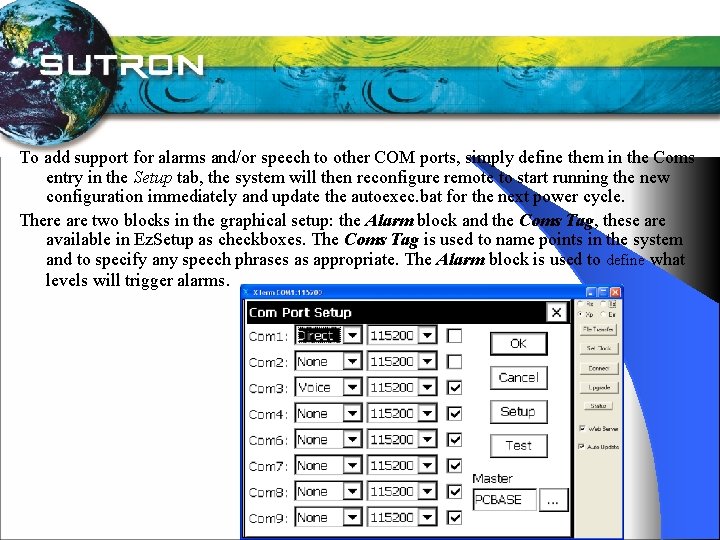
To add support for alarms and/or speech to other COM ports, simply define them in the Coms entry in the Setup tab, the system will then reconfigure remote to start running the new configuration immediately and update the autoexec. bat for the next power cycle. There are two blocks in the graphical setup: the Alarm block and the Coms Tag, these are available in Ez. Setup as checkboxes. The Coms Tag is used to name points in the system and to specify any speech phrases as appropriate. The Alarm block is used to define what levels will trigger alarms.

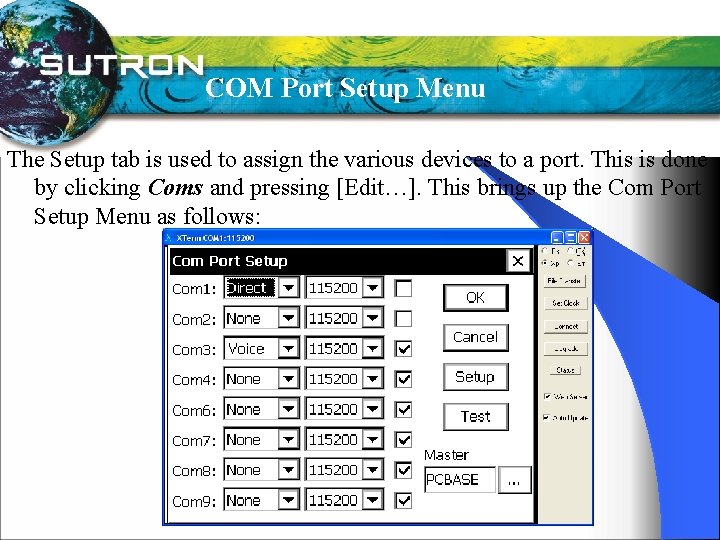
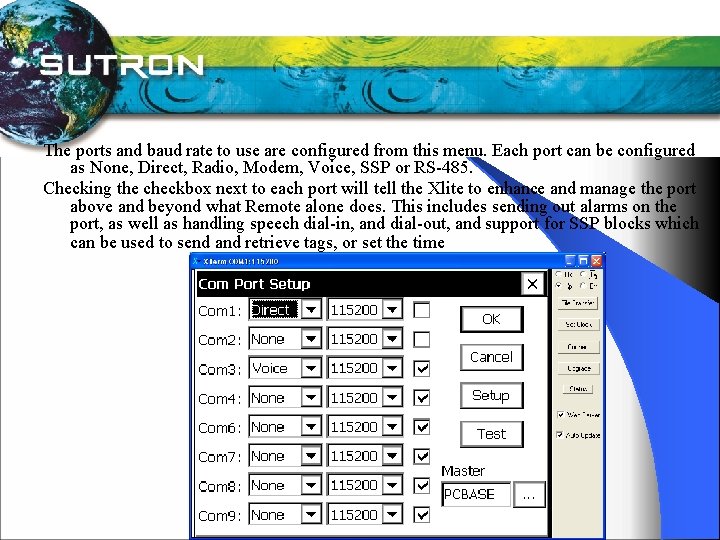
COM Port Setup Menu The Setup tab is used to assign the various devices to a port. This is done by clicking Coms and pressing [Edit…]. This brings up the Com Port Setup Menu as follows:

The ports and baud rate to use are configured from this menu. Each port can be configured as None, Direct, Radio, Modem, Voice, SSP or RS-485. Checking the checkbox next to each port will tell the Xlite to enhance and manage the port above and beyond what Remote alone does. This includes sending out alarms on the port, as well as handling speech dial-in, and dial-out, and support for SSP blocks which can be used to send and retrieve tags, or set the time.

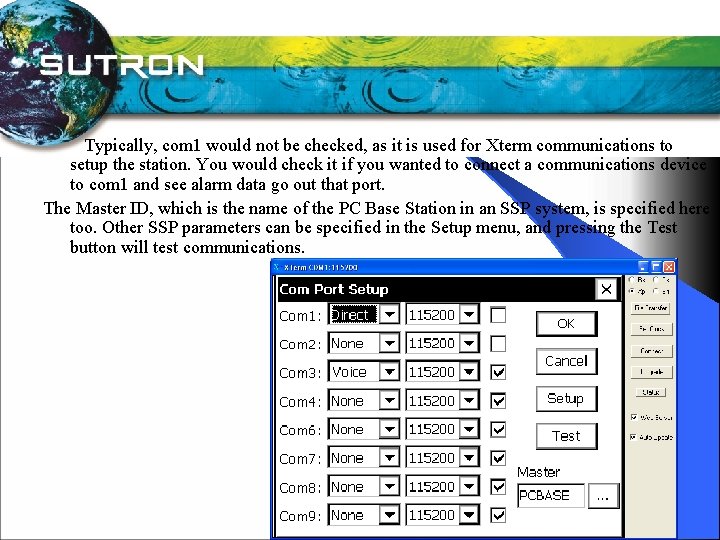
Typically, com 1 would not be checked, as it is used for Xterm communications to setup the station. You would check it if you wanted to connect a communications device to com 1 and see alarm data go out that port. The Master ID, which is the name of the PC Base Station in an SSP system, is specified here too. Other SSP parameters can be specified in the Setup menu, and pressing the Test button will test communications.

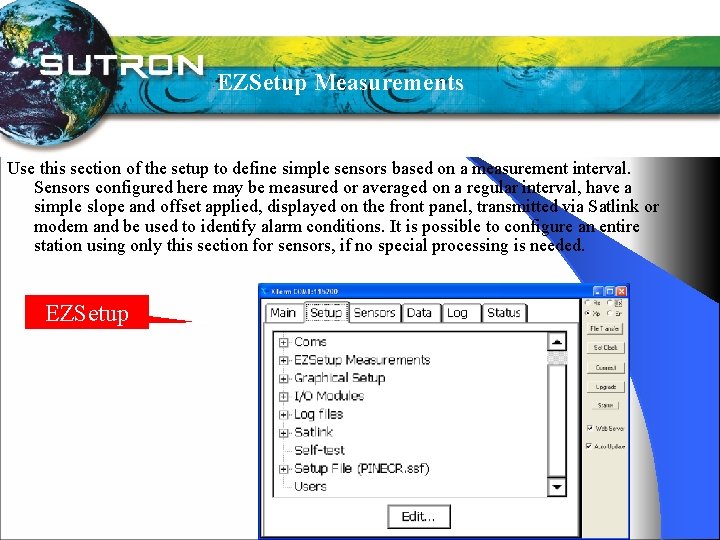
EZSetup Measurements Use this section of the setup to define simple sensors based on a measurement interval. Sensors configured here may be measured or averaged on a regular interval, have a simple slope and offset applied, displayed on the front panel, transmitted via Satlink or modem and be used to identify alarm conditions. It is possible to configure an entire station using only this section for sensors, if no special processing is needed. EZSetup

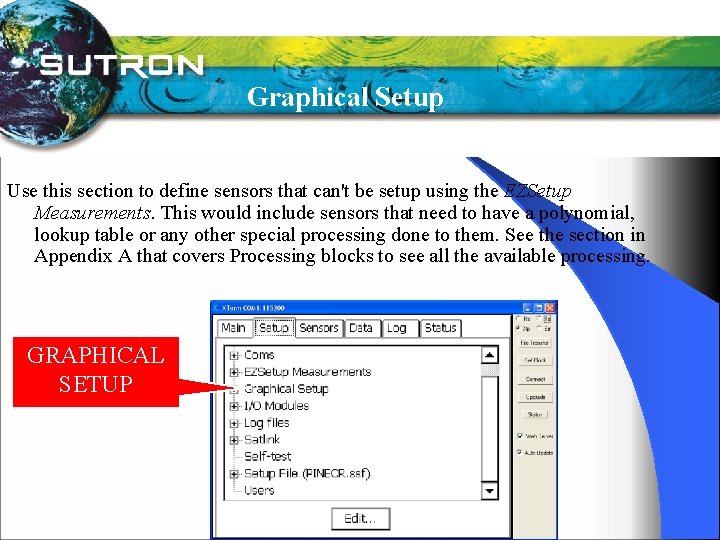
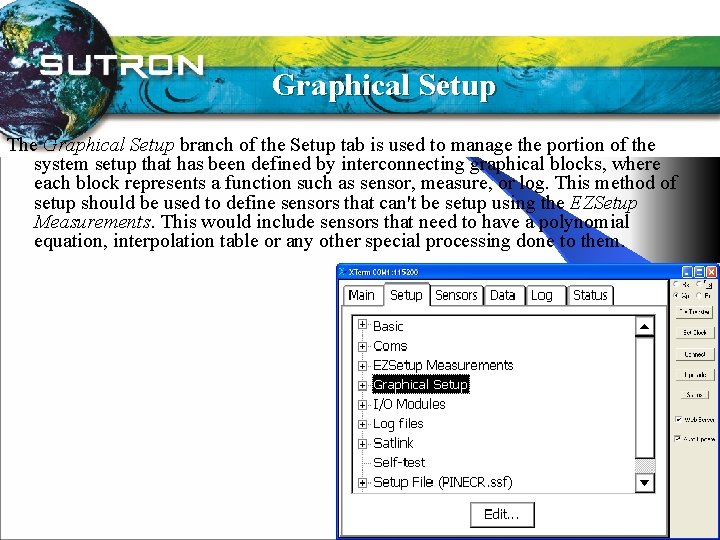
Graphical Setup Use this section to define sensors that can't be setup using the EZSetup Measurements. This would include sensors that need to have a polynomial, lookup table or any other special processing done to them. See the section in Appendix A that covers Processing blocks to see all the available processing. GRAPHICAL SETUP

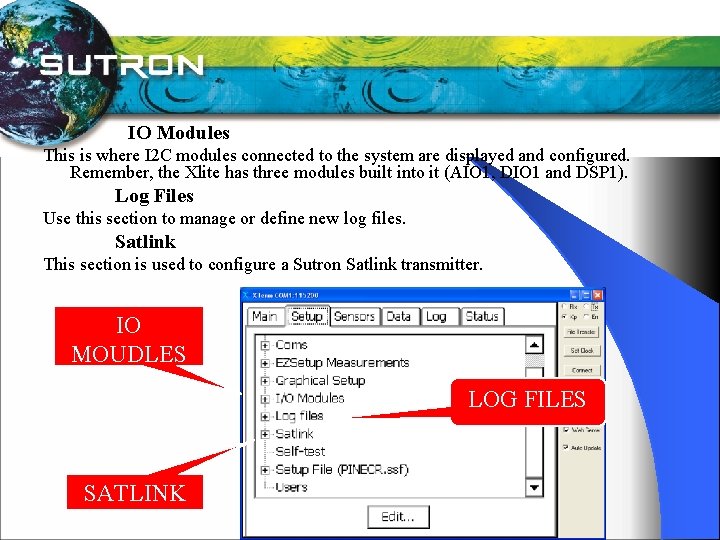
IO Modules This is where I 2 C modules connected to the system are displayed and configured. Remember, the Xlite has three modules built into it (AIO 1, DIO 1 and DSP 1). Log Files Use this section to manage or define new log files. Satlink This section is used to configure a Sutron Satlink transmitter. IO MOUDLES LOG FILES SATLINK

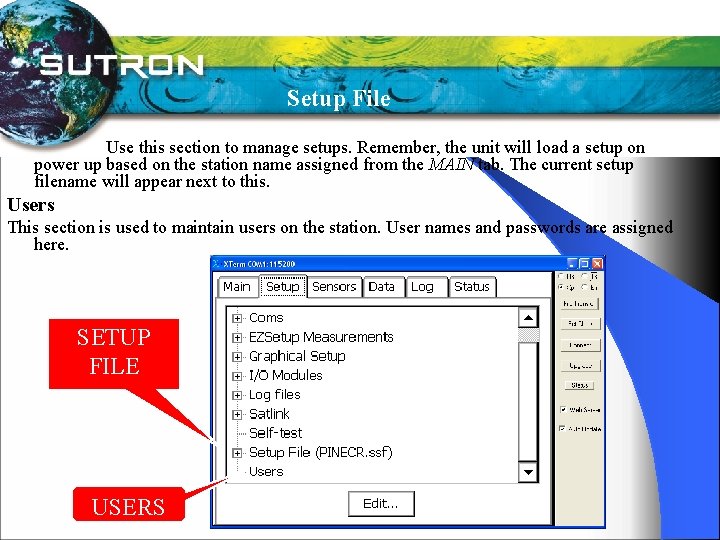
Setup File Use this section to manage setups. Remember, the unit will load a setup on power up based on the station name assigned from the MAIN tab. The current setup filename will appear next to this. Users This section is used to maintain users on the station. User names and passwords are assigned here. SETUP FILE USERS

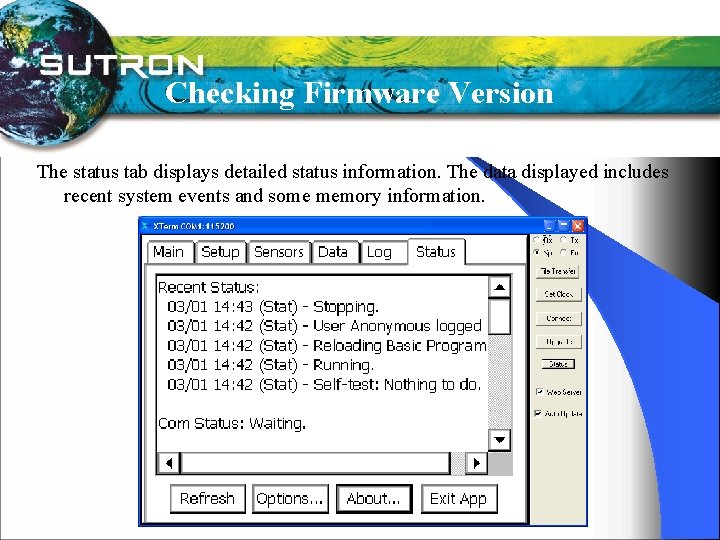
Checking Firmware Version The status tab displays detailed status information. The data displayed includes recent system events and some memory information.

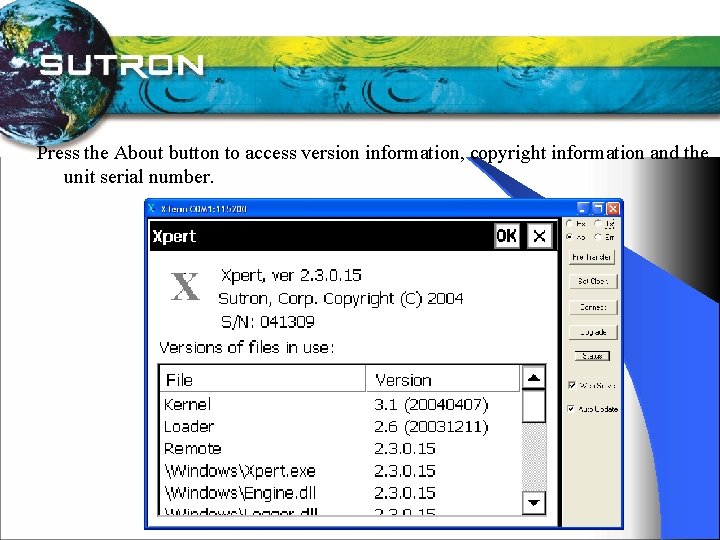
Press the About button to access version information, copyright information and the unit serial number.

Ø Ø Ø Ø What data needs to be collected? What sensors will give this data? What is the raw output of these sensors, DC voltage, AC voltage, frequency, Serial, etc. ? Can the built-in I/O handle all of these sensors, or are additional modules needed? How often should this data be collected? What processing is needed to convert this raw data into a meaningful value? Is there already a block defined to do this processing or is a generic input needed?

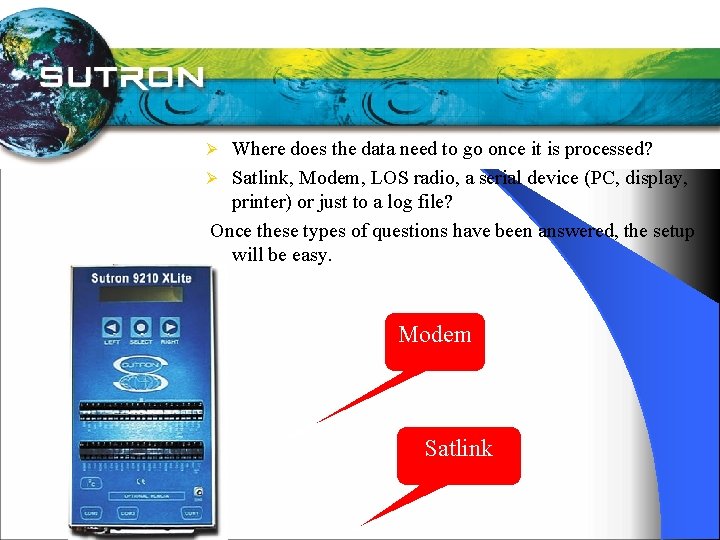
Where does the data need to go once it is processed? Ø Satlink, Modem, LOS radio, a serial device (PC, display, printer) or just to a log file? Once these types of questions have been answered, the setup will be easy. Ø Modem Satlink

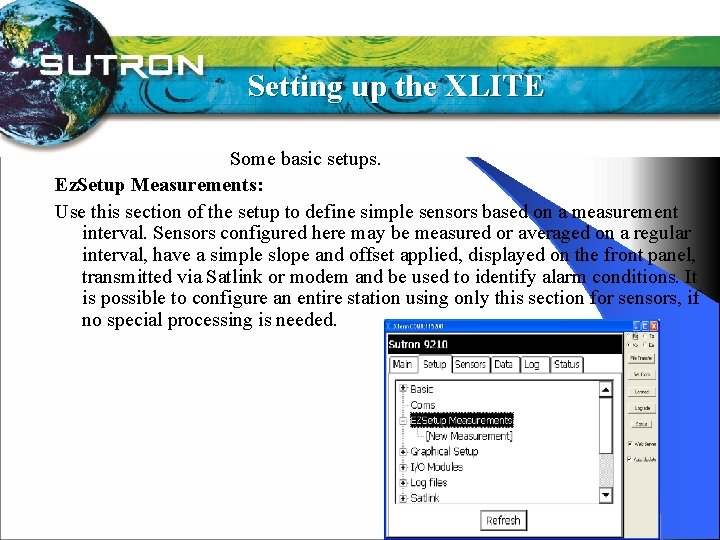
Setting up the XLITE Some basic setups. Ez. Setup Measurements: Use this section of the setup to define simple sensors based on a measurement interval. Sensors configured here may be measured or averaged on a regular interval, have a simple slope and offset applied, displayed on the front panel, transmitted via Satlink or modem and be used to identify alarm conditions. It is possible to configure an entire station using only this section for sensors, if no special processing is needed.

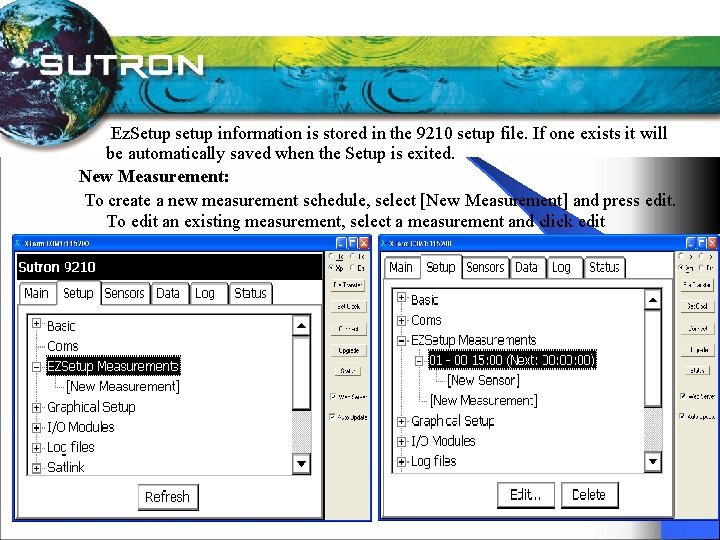
Ez. Setup setup information is stored in the 9210 setup file. If one exists it will be automatically saved when the Setup is exited. New Measurement: To create a new measurement schedule, select [New Measurement] and press edit. To edit an existing measurement, select a measurement and click edit.

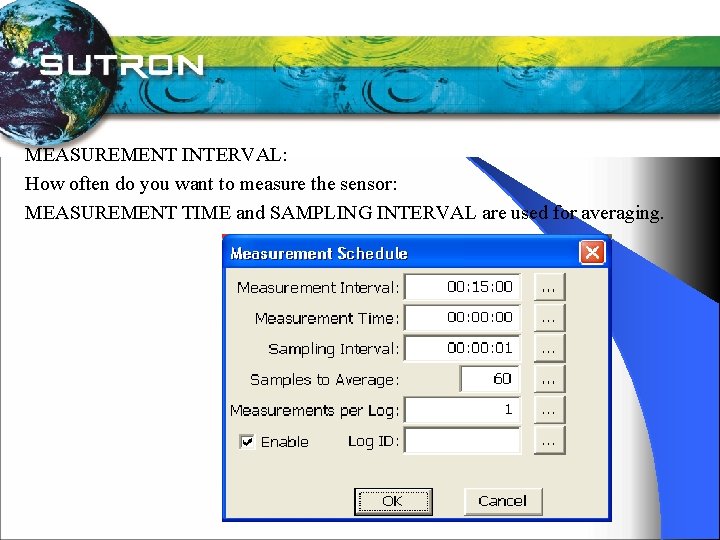
MEASUREMENT INTERVAL: How often do you want to measure the sensor: MEASUREMENT TIME and SAMPLING INTERVAL are used for averaging.

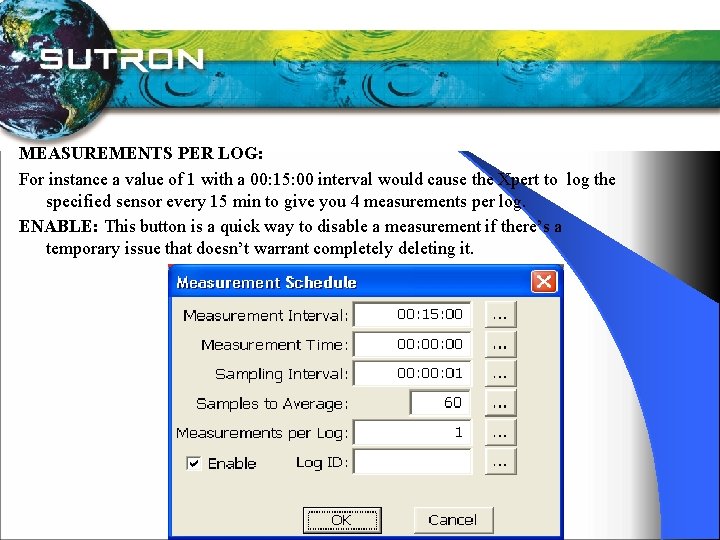
MEASUREMENTS PER LOG: For instance a value of 1 with a 00: 15: 00 interval would cause the Xpert to log the specified sensor every 15 min to give you 4 measurements per log. ENABLE: This button is a quick way to disable a measurement if there’s a temporary issue that doesn’t warrant completely deleting it.

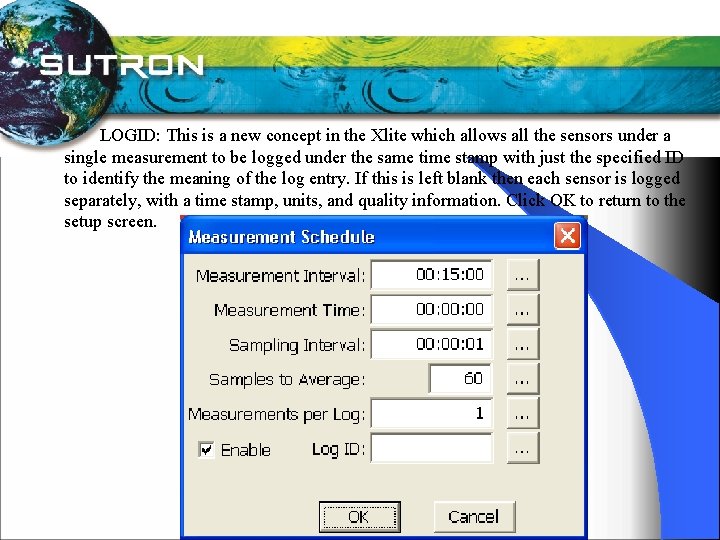
LOGID: This is a new concept in the Xlite which allows all the sensors under a single measurement to be logged under the same time stamp with just the specified ID to identify the meaning of the log entry. If this is left blank then each sensor is logged separately, with a time stamp, units, and quality information. Click OK to return to the setup screen.

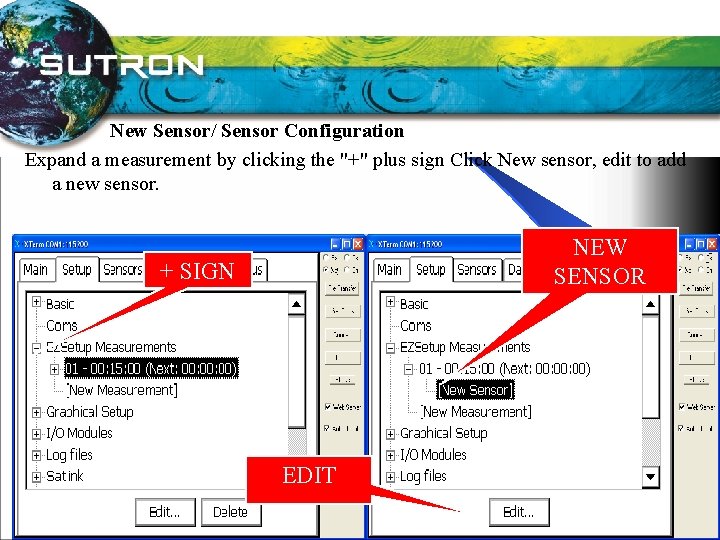
New Sensor/ Sensor Configuration Expand a measurement by clicking the "+" plus sign Click New sensor, edit to add a new sensor. NEW SENSOR + SIGN EDIT

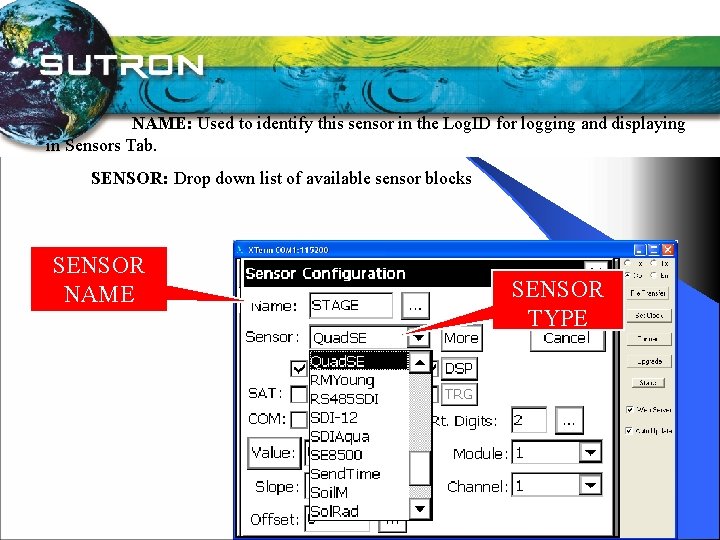
NAME: Used to identify this sensor in the Log. ID for logging and displaying in Sensors Tab. SENSOR: Drop down list of available sensor blocks. SENSOR NAME SENSOR TYPE

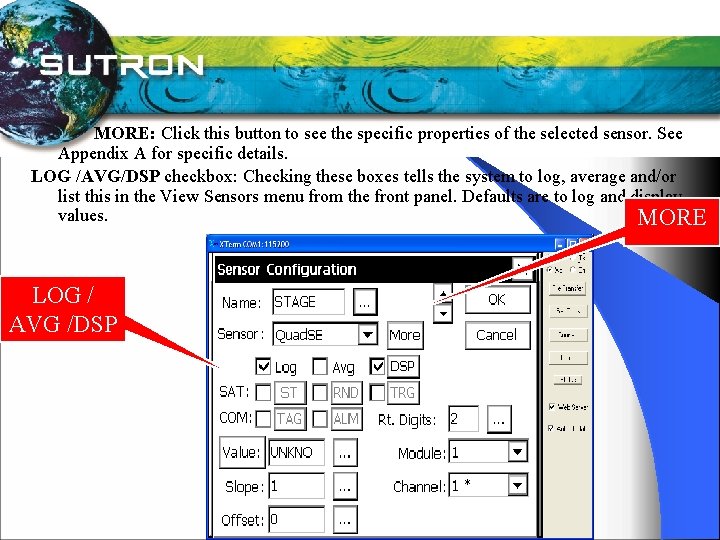
MORE: Click this button to see the specific properties of the selected sensor. See Appendix A for specific details. LOG /AVG/DSP checkbox: Checking these boxes tells the system to log, average and/or list this in the View Sensors menu from the front panel. Defaults are to log and display values. MORE LOG / AVG /DSP

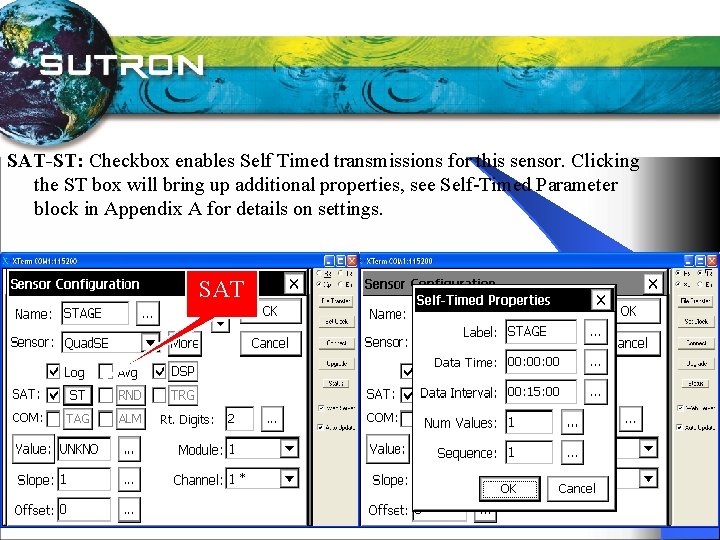
SAT-ST: Checkbox enables Self Timed transmissions for this sensor. Clicking the ST box will bring up additional properties, see Self-Timed Parameter block in Appendix A for details on settings. SAT

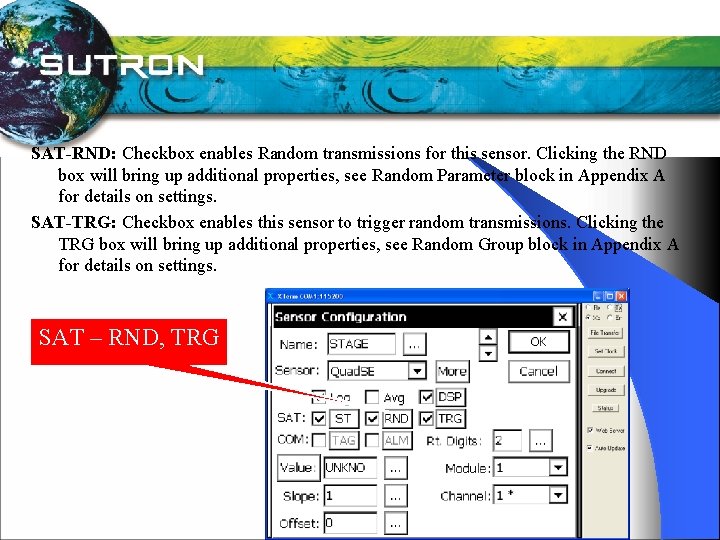
SAT-RND: Checkbox enables Random transmissions for this sensor. Clicking the RND box will bring up additional properties, see Random Parameter block in Appendix A for details on settings. SAT-TRG: Checkbox enables this sensor to trigger random transmissions. Clicking the TRG box will bring up additional properties, see Random Group block in Appendix A for details on settings. SAT – RND, TRG

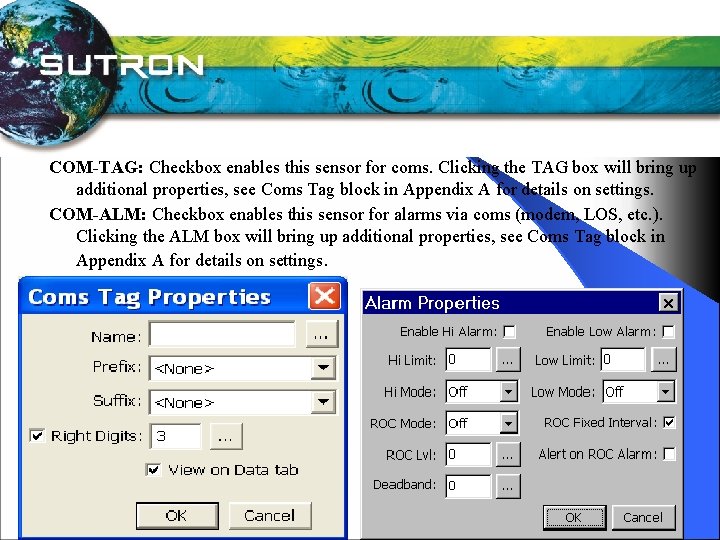
COM-TAG: Checkbox enables this sensor for coms. Clicking the TAG box will bring up additional properties, see Coms Tag block in Appendix A for details on settings. COM-ALM: Checkbox enables this sensor for alarms via coms (modem, LOS, etc. ). Clicking the ALM box will bring up additional properties, see Coms Tag block in Appendix A for details on settings.

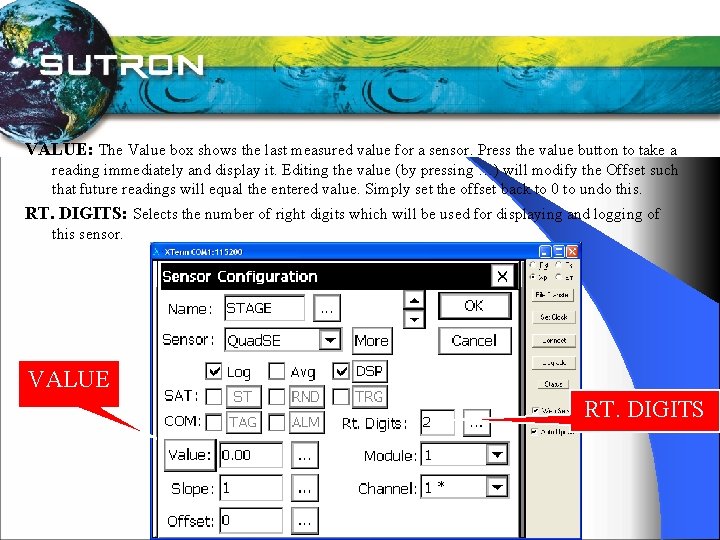
VALUE: The Value box shows the last measured value for a sensor. Press the value button to take a reading immediately and display it. Editing the value (by pressing …) will modify the Offset such that future readings will equal the entered value. Simply set the offset back to 0 to undo this. RT. DIGITS: Selects the number of right digits which will be used for displaying and logging of this sensor. VALUE RT. DIGITS

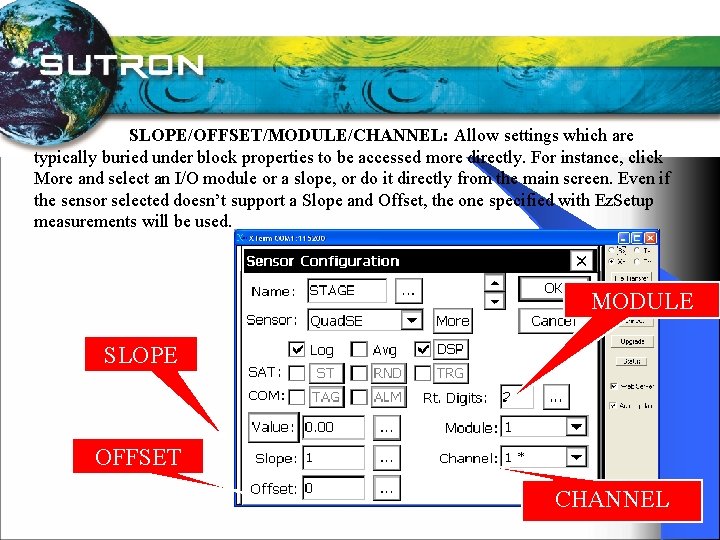
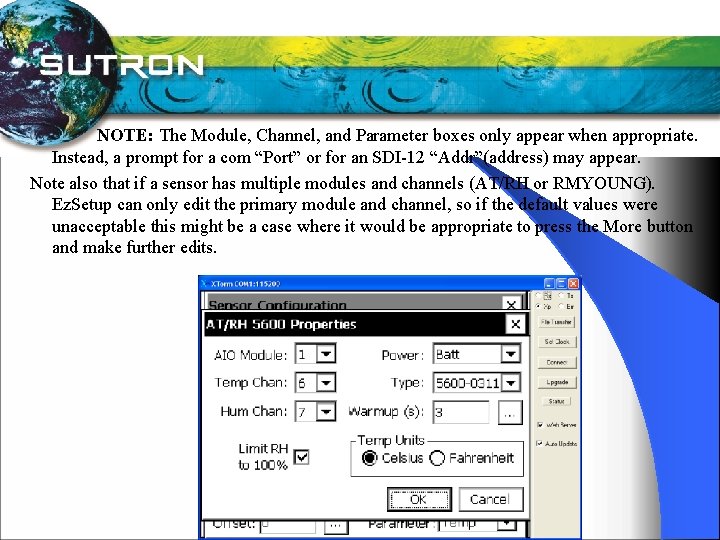
SLOPE/OFFSET/MODULE/CHANNEL: Allow settings which are typically buried under block properties to be accessed more directly. For instance, click More and select an I/O module or a slope, or do it directly from the main screen. Even if the sensor selected doesn’t support a Slope and Offset, the one specified with Ez. Setup measurements will be used. MODULE SLOPE OFFSET CHANNEL

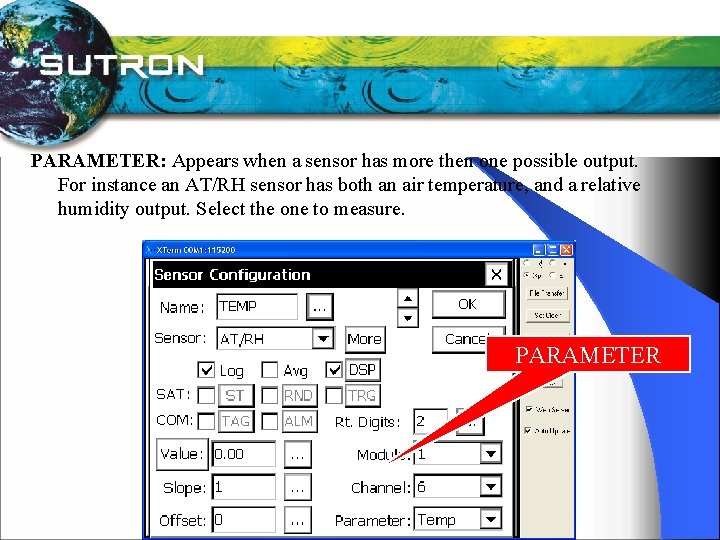
PARAMETER: Appears when a sensor has more then one possible output. For instance an AT/RH sensor has both an air temperature, and a relative humidity output. Select the one to measure. PARAMETER

NOTE: The Module, Channel, and Parameter boxes only appear when appropriate. Instead, a prompt for a com “Port” or for an SDI-12 “Addr”(address) may appear. Note also that if a sensor has multiple modules and channels (AT/RH or RMYOUNG). Ez. Setup can only edit the primary module and channel, so if the default values were unacceptable this might be a case where it would be appropriate to press the More button and make further edits.

Graphical Setup The Graphical Setup branch of the Setup tab is used to manage the portion of the system setup that has been defined by interconnecting graphical blocks, where each block represents a function such as sensor, measure, or log. This method of setup should be used to define sensors that can't be setup using the EZSetup Measurements. This would include sensors that need to have a polynomial equation, interpolation table or any other special processing done to them.

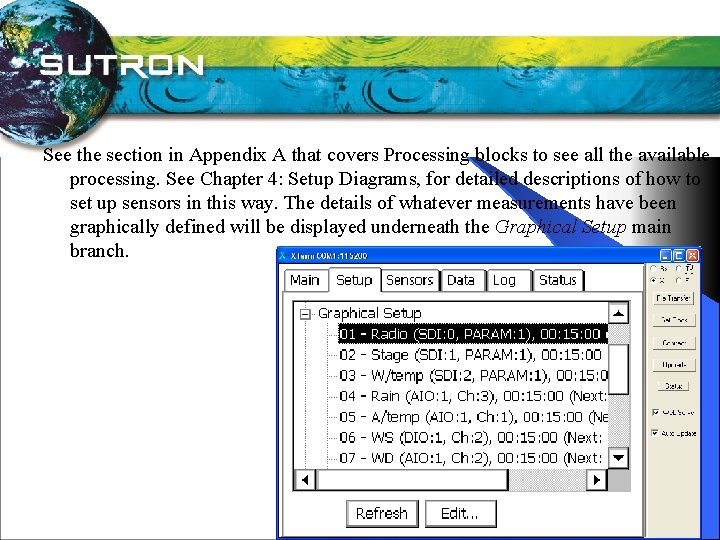
See the section in Appendix A that covers Processing blocks to see all the available processing. See Chapter 4: Setup Diagrams, for detailed descriptions of how to set up sensors in this way. The details of whatever measurements have been graphically defined will be displayed underneath the Graphical Setup main branch.

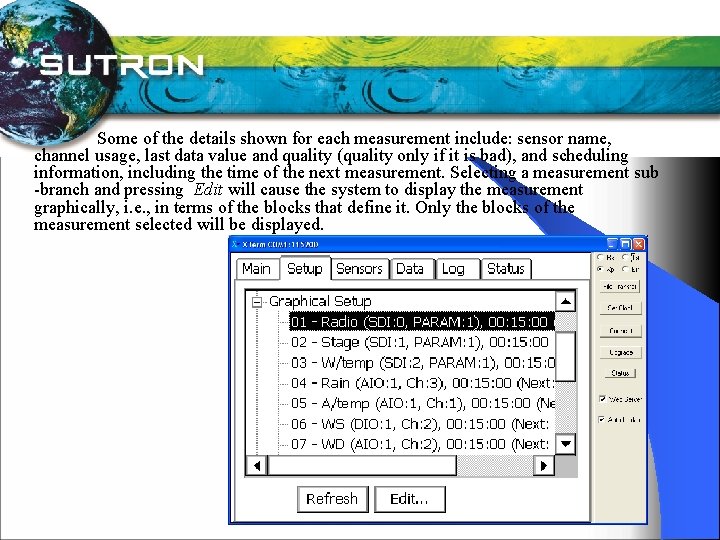
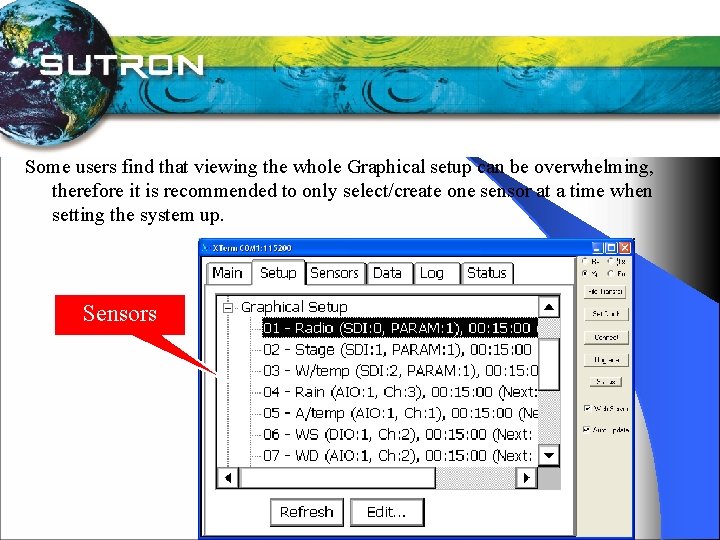
Some of the details shown for each measurement include: sensor name, channel usage, last data value and quality (quality only if it is bad), and scheduling information, including the time of the next measurement. Selecting a measurement sub -branch and pressing Edit will cause the system to display the measurement graphically, i. e. , in terms of the blocks that define it. Only the blocks of the measurement selected will be displayed.

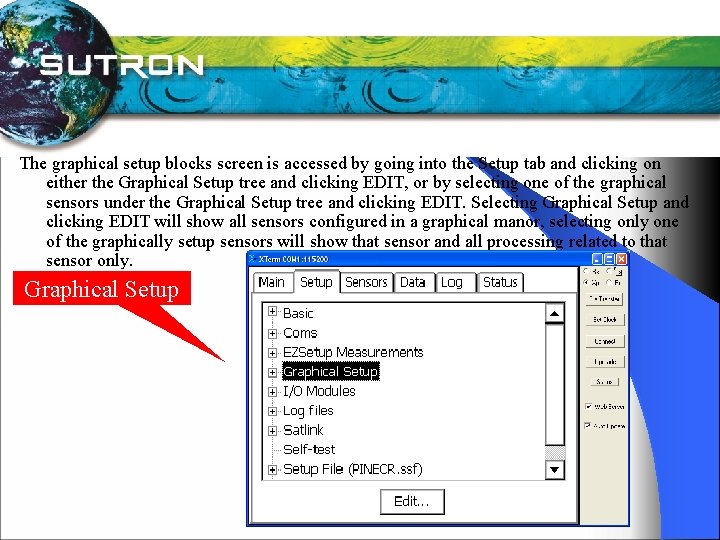
The graphical setup blocks screen is accessed by going into the Setup tab and clicking on either the Graphical Setup tree and clicking EDIT, or by selecting one of the graphical sensors under the Graphical Setup tree and clicking EDIT. Selecting Graphical Setup and clicking EDIT will show all sensors configured in a graphical manor, selecting only one of the graphically setup sensors will show that sensor and all processing related to that sensor only. Graphical Setup

Some users find that viewing the whole Graphical setup can be overwhelming, therefore it is recommended to only select/create one sensor at a time when setting the system up. Sensors

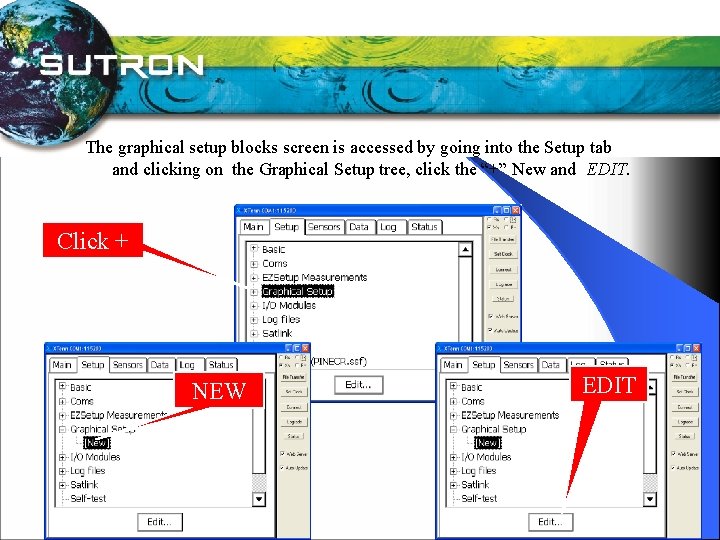
The graphical setup blocks screen is accessed by going into the Setup tab and clicking on the Graphical Setup tree, click the “+” New and EDIT. Click + NEW EDIT

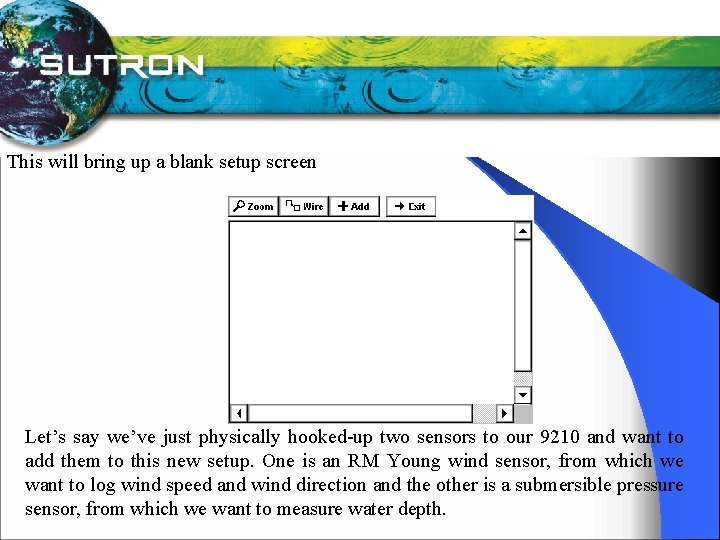
This will bring up a blank setup screen: Let’s say we’ve just physically hooked-up two sensors to our 9210 and want to add them to this new setup. One is an RM Young wind sensor, from which we want to log wind speed and wind direction and the other is a submersible pressure sensor, from which we want to measure water depth.

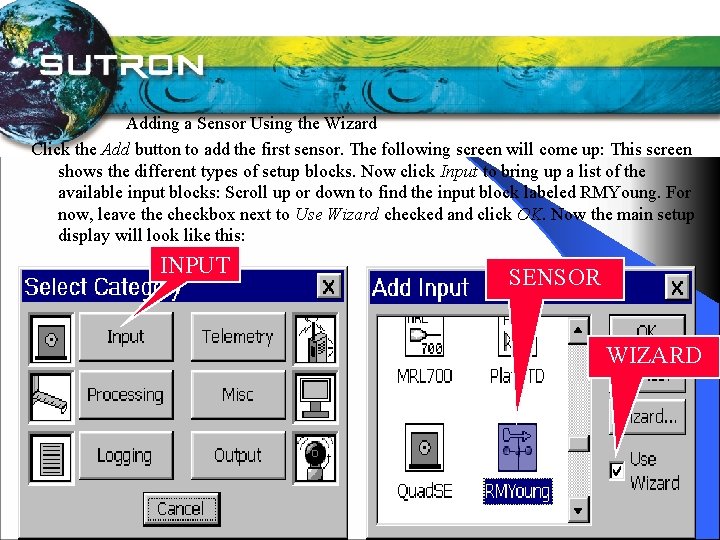
Adding a Sensor Using the Wizard Click the Add button to add the first sensor. The following screen will come up: This screen shows the different types of setup blocks. Now click Input to bring up a list of the available input blocks: Scroll up or down to find the input block labeled RMYoung. For now, leave the checkbox next to Use Wizard checked and click OK. Now the main setup display will look like this: INPUT SENSOR WIZARD

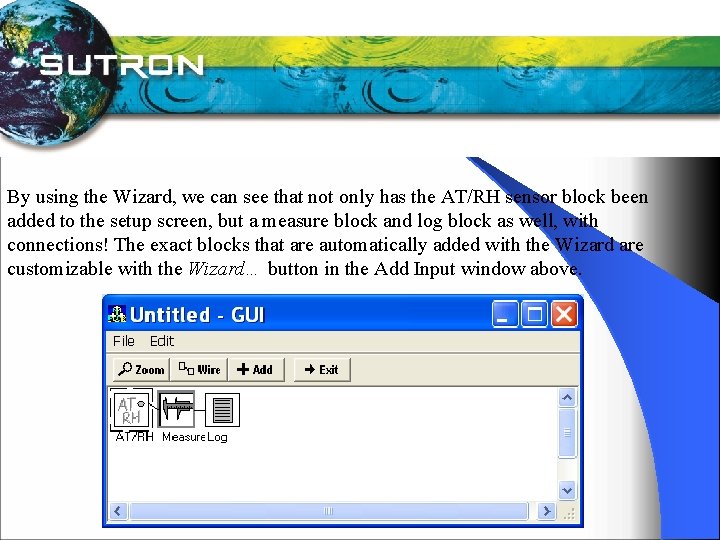
By using the Wizard, we can see that not only has the AT/RH sensor block been added to the setup screen, but a measure block and log block as well, with connections! The exact blocks that are automatically added with the Wizard are customizable with the Wizard… button in the Add Input window above.

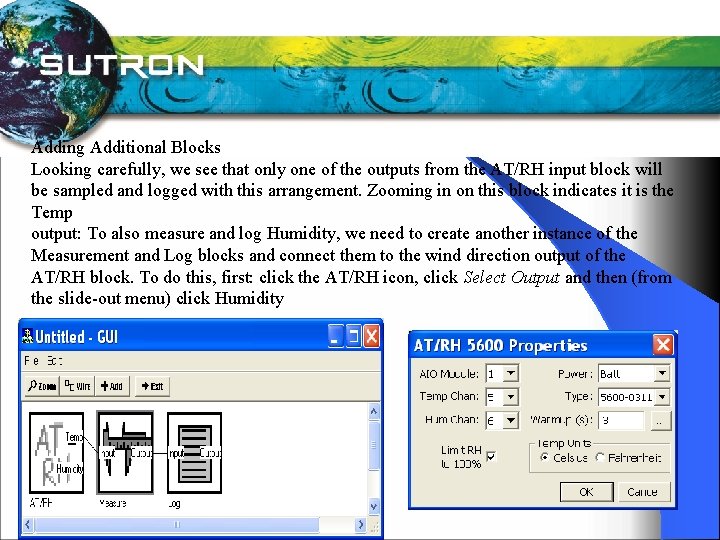
Adding Additional Blocks Looking carefully, we see that only one of the outputs from the AT/RH input block will be sampled and logged with this arrangement. Zooming in on this block indicates it is the Temp output: To also measure and log Humidity, we need to create another instance of the Measurement and Log blocks and connect them to the wind direction output of the AT/RH block. To do this, first: click the AT/RH icon, click Select Output and then (from the slide-out menu) click Humidity

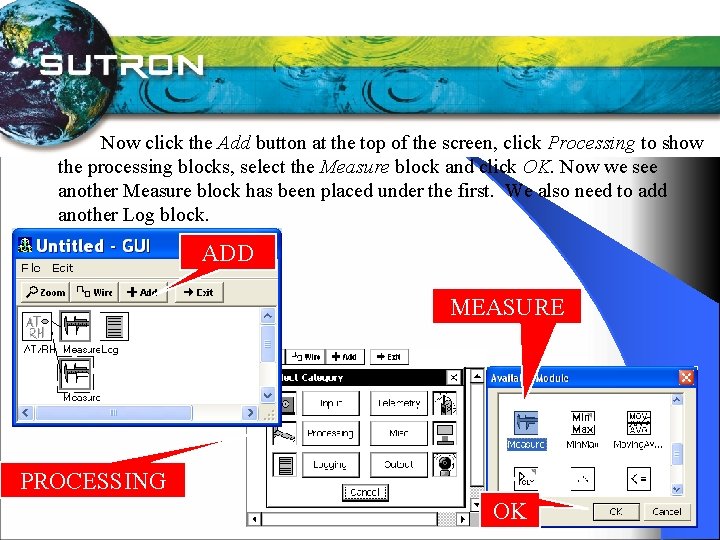
Now click the Add button at the top of the screen, click Processing to show the processing blocks, select the Measure block and click OK. Now we see another Measure block has been placed under the first. We also need to add another Log block. ADD MEASURE PROCESSING OK

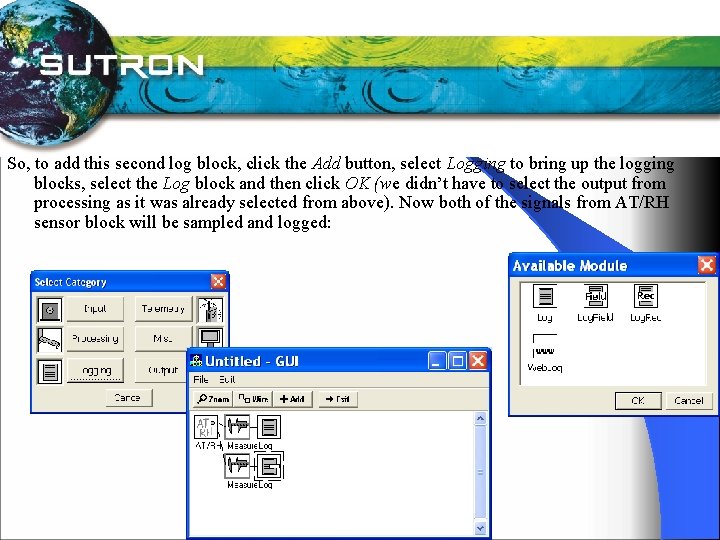
So, to add this second log block, click the Add button, select Logging to bring up the logging blocks, select the Log block and then click OK (we didn’t have to select the output from processing as it was already selected from above). Now both of the signals from AT/RH sensor block will be sampled and logged:

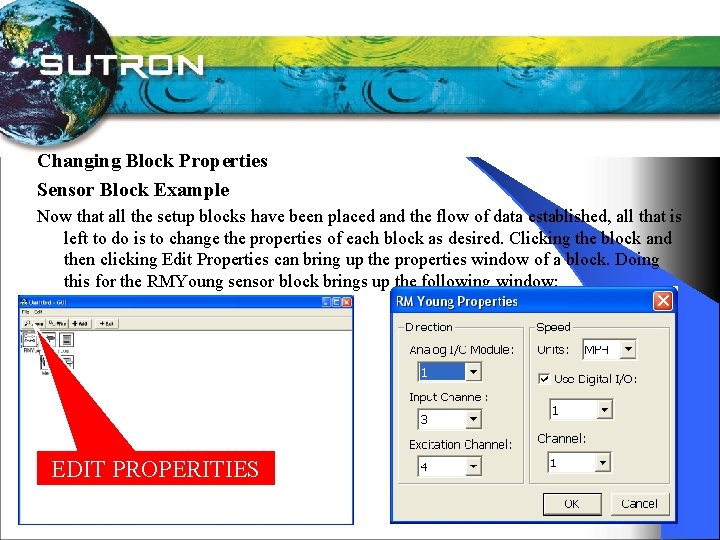
Changing Block Properties Sensor Block Example Now that all the setup blocks have been placed and the flow of data established, all that is left to do is to change the properties of each block as desired. Clicking the block and then clicking Edit Properties can bring up the properties window of a block. Doing this for the RMYoung sensor block brings up the following window: EDIT PROPERITIES

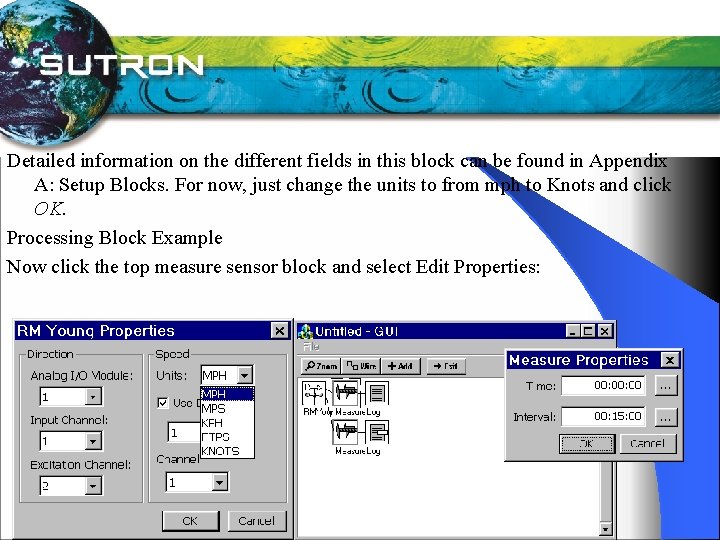
Detailed information on the different fields in this block can be found in Appendix A: Setup Blocks. For now, just change the units to from mph to Knots and click OK. Processing Block Example Now click the top measure sensor block and select Edit Properties:

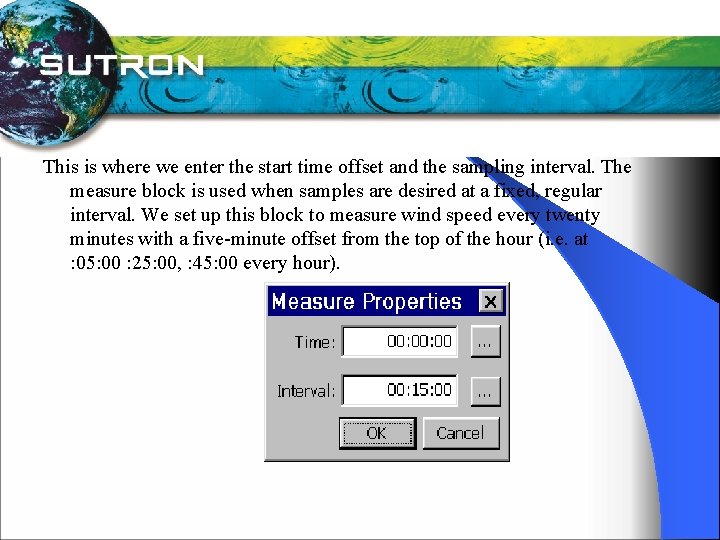
This is where we enter the start time offset and the sampling interval. The measure block is used when samples are desired at a fixed, regular interval. We set up this block to measure wind speed every twenty minutes with a five-minute offset from the top of the hour (i. e. at : 05: 00 : 25: 00, : 45: 00 every hour).

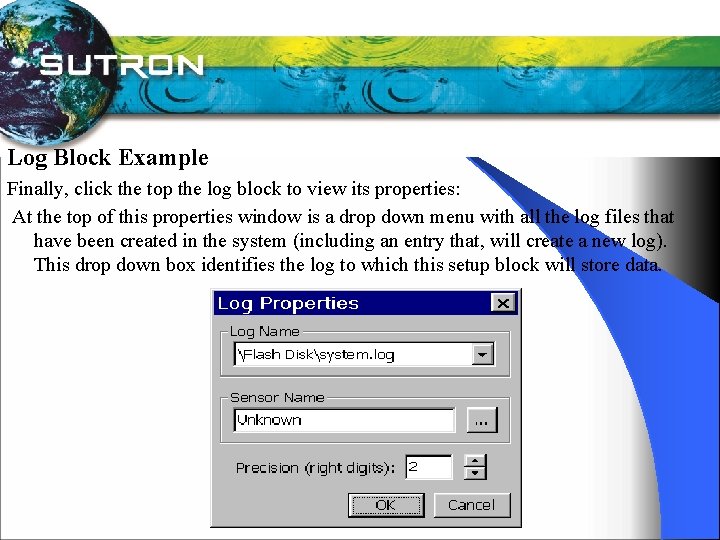
Log Block Example Finally, click the top the log block to view its properties: At the top of this properties window is a drop down menu with all the log files that have been created in the system (including an entry that, will create a new log). This drop down box identifies the log to which this setup block will store data.

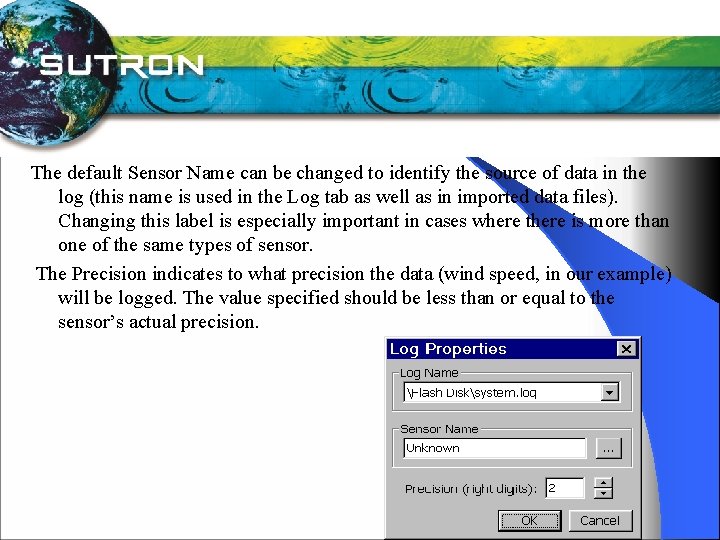
The default Sensor Name can be changed to identify the source of data in the log (this name is used in the Log tab as well as in imported data files). Changing this label is especially important in cases where there is more than one of the same types of sensor. The Precision indicates to what precision the data (wind speed, in our example) will be logged. The value specified should be less than or equal to the sensor’s actual precision.

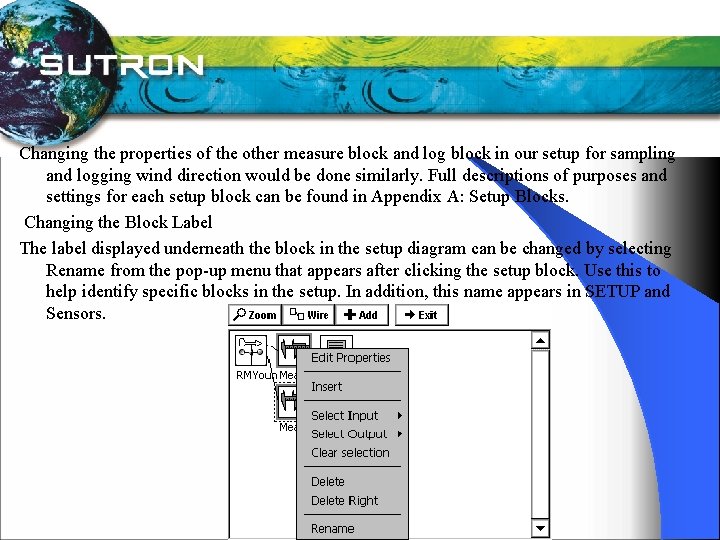
Changing the properties of the other measure block and log block in our setup for sampling and logging wind direction would be done similarly. Full descriptions of purposes and settings for each setup block can be found in Appendix A: Setup Blocks. Changing the Block Label The label displayed underneath the block in the setup diagram can be changed by selecting Rename from the pop-up menu that appears after clicking the setup block. Use this to help identify specific blocks in the setup. In addition, this name appears in SETUP and Sensors.

Laketop. ssf In this setup, we are measuring the water level of a river, using a quadrature shaft encoder, every 15 -minutes. We are logging the data in SSP. log and transmitting the data to a GOES satellite every hour at 300 baud. No Random Transmissions The equipment used is a Satlink and a Quad Shaft Encoder. They are connected to the following: Satlink to COM 2 with the regular RS-232 Quadrature shaft encoder to Digital channels 3 -4 (terminal B I/O 3 and I/O 4) with power coming from the PROT 12 and GND

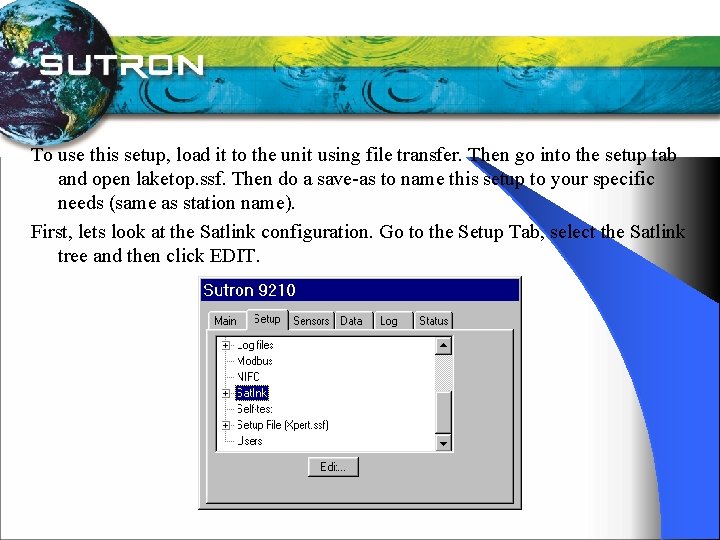
To use this setup, load it to the unit using file transfer. Then go into the setup tab and open laketop. ssf. Then do a save-as to name this setup to your specific needs (same as station name). First, lets look at the Satlink configuration. Go to the Setup Tab, select the Satlink tree and then click EDIT.

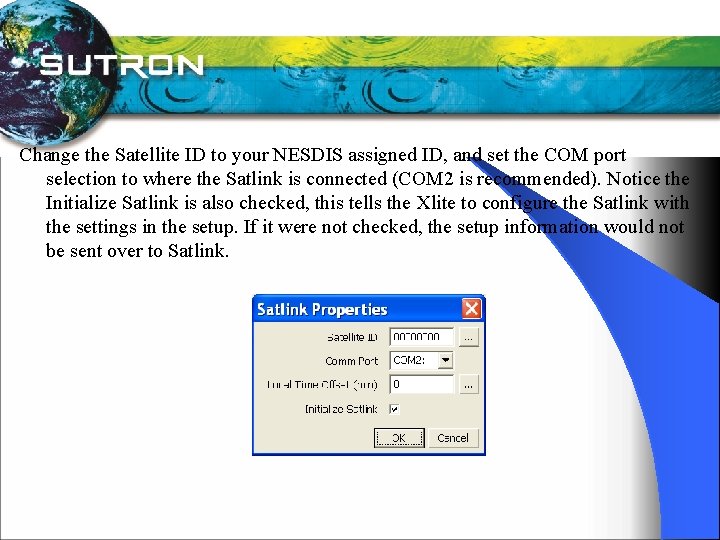
Change the Satellite ID to your NESDIS assigned ID, and set the COM port selection to where the Satlink is connected (COM 2 is recommended). Notice the Initialize Satlink is also checked, this tells the Xlite to configure the Satlink with the settings in the setup. If it were not checked, the setup information would not be sent over to Satlink.

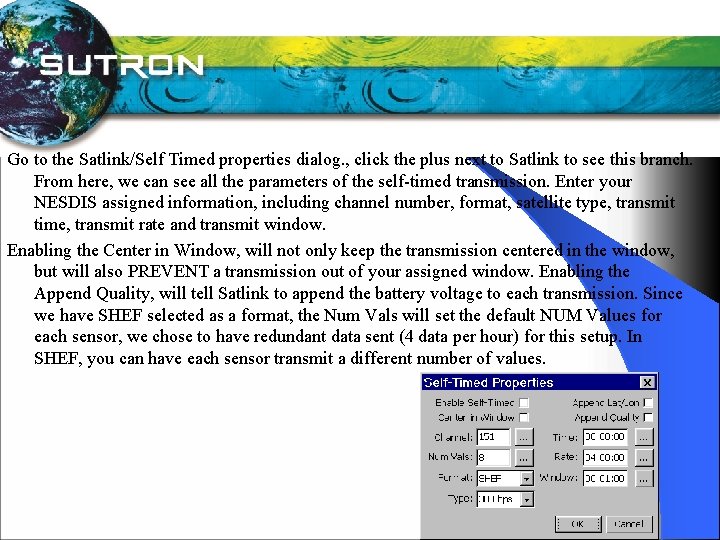
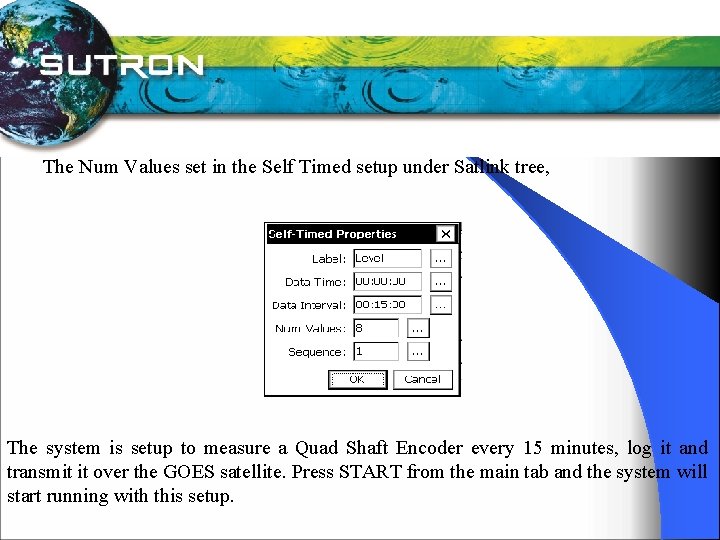
Go to the Satlink/Self Timed properties dialog. , click the plus next to Satlink to see this branch. From here, we can see all the parameters of the self-timed transmission. Enter your NESDIS assigned information, including channel number, format, satellite type, transmit time, transmit rate and transmit window. Enabling the Center in Window, will not only keep the transmission centered in the window, but will also PREVENT a transmission out of your assigned window. Enabling the Append Quality, will tell Satlink to append the battery voltage to each transmission. Since we have SHEF selected as a format, the Num Vals will set the default NUM Values for each sensor, we chose to have redundant data sent (4 data per hour) for this setup. In SHEF, you can have each sensor transmit a different number of values.

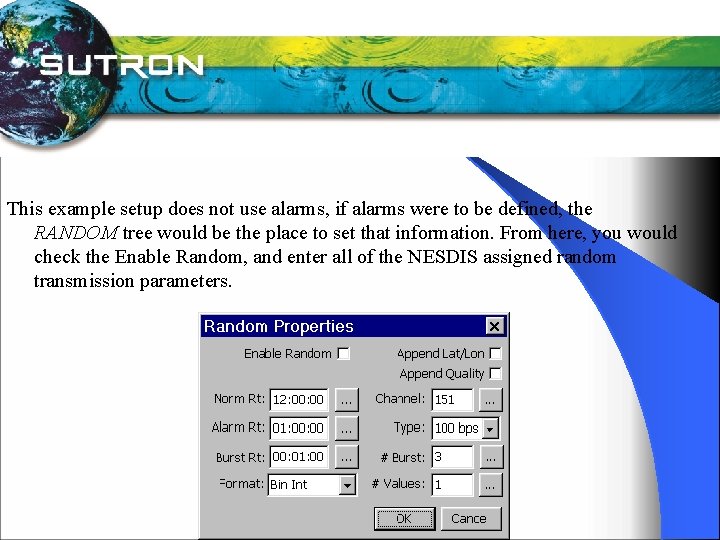
This example setup does not use alarms, if alarms were to be defined, the RANDOM tree would be the place to set that information. From here, you would check the Enable Random, and enter all of the NESDIS assigned random transmission parameters.

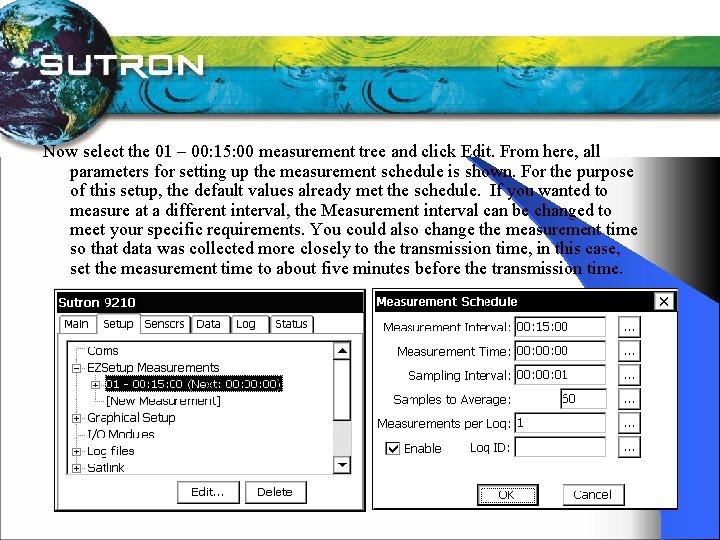
Now select the 01 – 00: 15: 00 measurement tree and click Edit. From here, all parameters for setting up the measurement schedule is shown. For the purpose of this setup, the default values already met the schedule. If you wanted to measure at a different interval, the Measurement interval can be changed to meet your specific requirements. You could also change the measurement time so that data was collected more closely to the transmission time, in this case, set the measurement time to about five minutes before the transmission time.

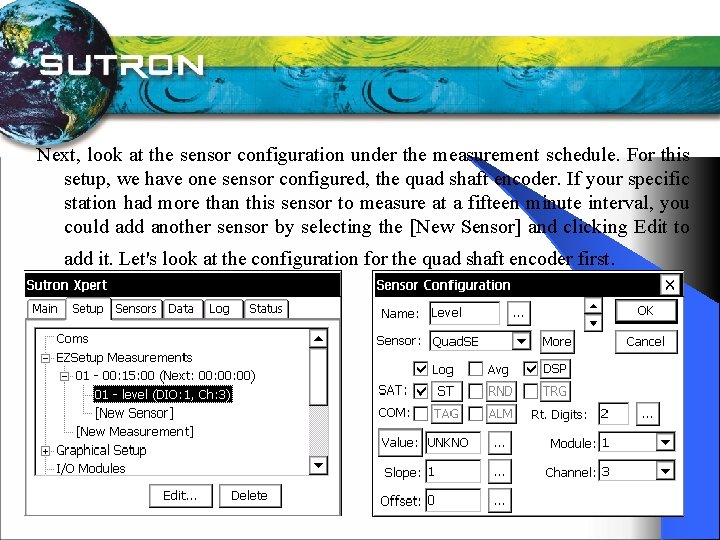
Next, look at the sensor configuration under the measurement schedule. For this setup, we have one sensor configured, the quad shaft encoder. If your specific station had more than this sensor to measure at a fifteen minute interval, you could add another sensor by selecting the [New Sensor] and clicking Edit to add it. Let's look at the configuration for the quad shaft encoder first.

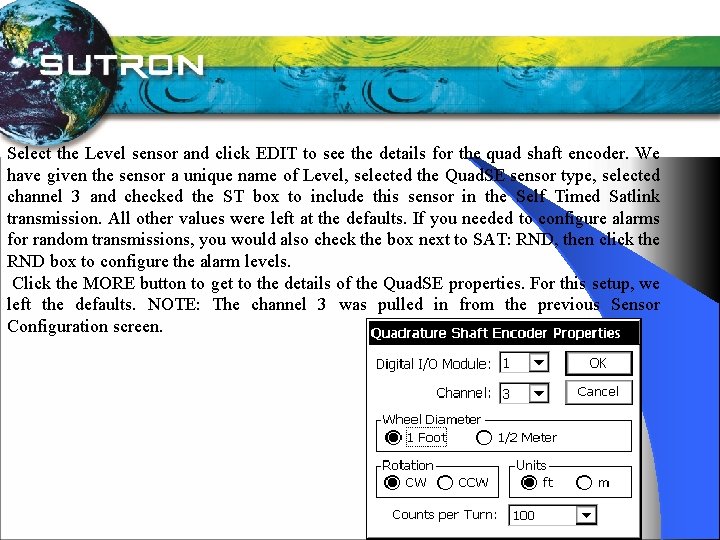
Select the Level sensor and click EDIT to see the details for the quad shaft encoder. We have given the sensor a unique name of Level, selected the Quad. SE sensor type, selected channel 3 and checked the ST box to include this sensor in the Self Timed Satlink transmission. All other values were left at the defaults. If you needed to configure alarms for random transmissions, you would also check the box next to SAT: RND, then click the RND box to configure the alarm levels. Click the MORE button to get to the details of the Quad. SE properties. For this setup, we left the defaults. NOTE: The channel 3 was pulled in from the previous Sensor Configuration screen.

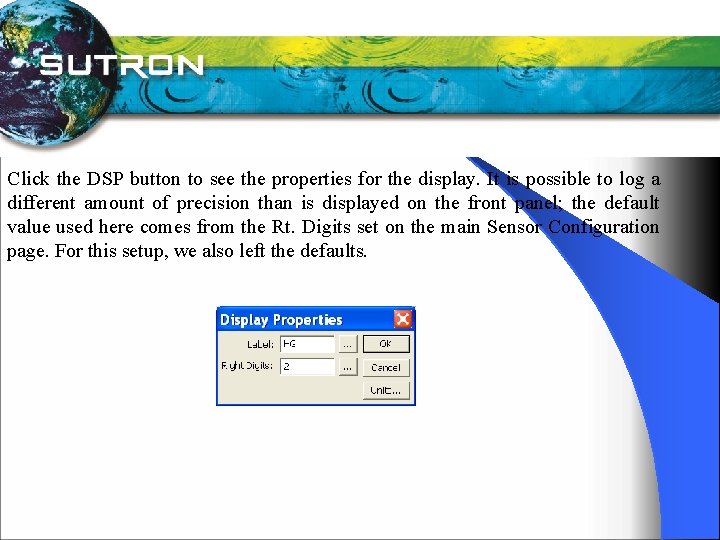
Click the DSP button to see the properties for the display. It is possible to log a different amount of precision than is displayed on the front panel; the default value used here comes from the Rt. Digits set on the main Sensor Configuration page. For this setup, we also left the defaults.

The Num Values set in the Self Timed setup under Satlink tree, The system is setup to measure a Quad Shaft Encoder every 15 minutes, log it and transmit it over the GOES satellite. Press START from the main tab and the system will start running with this setup.