Tratamiento de segunda lnea del CPNM nuevos tiempos


 (n=268) Any grade Grade")


, mo")

, PD-L 1 TPS")
 PD-L 1 TPS ≥ 50%")


 vs 9. 1 m (P) PFS")
 vs 9. 1 m (P) OVERALL")
 vs 9. 7 m (P) Med OS: 9.")


- Slides: 49
Tratamiento de segunda línea del CPNM, nuevos tiempos para nuevos fármacos Margarita Majem Hospital de la Santa Creu i Sant Pau Barcelona
2016 Atezolizumab, all commers NSCLC: OS improvements 2015 Pembrolizumab: PD-L 1 + Pretreated 2015 Nivolumab: NSQ 2015 Nivolumab: SQ 2014 Nintedanib + docetaxel: NSQa 2004 Pemetrexed: NSQ Median OS, months 2014 Ramucirumab + docetaxel 2004 Erlotinib 1999 Docetaxel ~12+ ~10– 12 ~8– 10 ~6– 8 1990 2000 2015 2016 2
Second line CT before 2014 Overall survival times in selected second-line trials TAX 317 B 1 BR-213 Docetaxel 7. 5 months Pemetrexed 8. 3 months Erlotinib 6. 7 BSC 4. 6 months Docetaxel 7. 9 months Placebo 4. 7 P: 0. 01 100 Survival probability JMEI 2 HR: 0. 99 (0. 82, 1. 20) 100 HR: 0. 70 (0. 58, 0. 85) 100 90 80 80 75 70 60 60 50 50 40 40 30 25 20 20 10 0 3 6 9 12 15 Survival (months) 18 21 0 0. 0 2. 5 5. 0 7. 5 10. 0 12. 5 15. 0 17. 5 20. 0 22. 5 Survival (months) 0 6 12 18 Survival (months) 24 30
QUIMIOTERAPIA • DOCETAXEL • PEMETREXED QUIMIOTERAPIA + ANTIANGIOGÉNICOS • D + RAMUCIRUMAB • D + NINTEDANIB INMUNOTERAPIA EGFR-TKI • NIVOLUMAB • PEMBROLIZUMAB • ATEZOLIZUMAB • ERLOTINIB • AFATINIB 4
QUIMIOTERAPIA + ANTIANGIOGÉNICOS INMUNOTERAPIA • NIVOLUMAB • PEMBROLIZUMAB • ATEZOLIZUAMB EGFR-TKI 5
Immune checkpoint inhibitors in lung cancer
Check. Mate 057: Nivolumab in pretreated patients with nonsquamous NSCLC Study schema Nivolumab 3 mg/kg IV Q 2 W until PD or unacceptable toxicity Phase 3 Nonsquamous NSCLC Stage IIIB/IV • Prior platinumbased chemotherapy • ECOG PS 0– 1 • N=582 Docetaxel 75 mg/m 2 IV Q 3 W Endpoints Primary • OS Secondary • ORR • PFS • Safety and tolerability • PD-L 1 expression and efficacy Baseline characteristics Median age, years (range) Age ≥ 75 years, % Male, % Smoking status, % Current/former smoker Never smoker ECOG PS, a % 0 1 Prior maintenance therapy, % No. of prior systemic regimens, b, c % 1 2 EGFR-+ve mutation status, % ALK-+ve translocation status, % Patients with quantifiable baseline PD -L 1 expressiond ≥ 1% ≥ 5% ≥ 10% a 1 Nivolumab (n=292) 61 (37– 84) 7 52 Docetaxel (n=290) 64 (21– 85) 8 58 79 20 78 21 29 71 42 33 67 38 88 12 15 4 89 11 13 3 53 41 37 55 38 35 patient in the docetaxel arm had ECOG PS=3; b. Derived as number of lines of prior therapy received for advanced, metastatic or recurrent disease; patient had 1 prior regimen in neo-adjuvant setting. d% of evaluable patients: 78% (455/582) of randomized patients had quantifiable PD-L 1 expression. ECOG=Eastern Co-operative Oncology Group; IV=intravenous; PD=progressive disease; PFS=progression-free survival; PS=performance status; Q 2 W=every 2 weeks; Q 3 W=every 3 weeks. Paz-Ares L, et al. Presented at ASCO 2015, Abstract LBA 109. c 1 7
Overall survival and PFS: Check. Mate 057 OS 100 90 90 80 80 70 70 60 60 PFS (%) OS (%) PFS 100 1 -yr OS rate = 51% 50 40 Nivolumab 1 -yr OS rate = 39% 30 50 40 30 20 1 -yr PFS rate = 19% 20 10 Nivolumab 10 Docetaxel 1 -yr PFS rate = 8% 0 0 0 3 9 6 12 15 18 21 24 27 Time (months) Number of Patients at Risk 0 3 6 12 9 15 18 21 24 27 Time (months) Number of Patients at Risk Nivolumab 292 232 194 169 146 123 62 32 9 0 Nivolumab 292 128 82 58 46 35 17 7 2 0 Docetaxel 290 244 194 150 111 88 34 10 5 0 Docetaxel 290 156 87 38 18 6 2 1 1 0 Symbols represent censored observations. HR=hazard ratio; m. OS=median overall survival; m. PFS=median progression-free survival Paz-Ares L, et al. Presented at ASCO 2015, Abstract LBA 109. Nivolumab (n=292) Docetaxel (n=290) HR Median OS, months 12. 2 9. 4 HR = 0. 73 (96% CI: 0. 59, 0. 89); P = 0. 0015 Median PFS, months 2. 3 4. 2 HR = 0. 92 (95% CI: 0. 77, 1. 11); P = 0. 3932 ORR, % 19 12 P = 0. 0246 17. 2 5. 6 Median DOR, months 8
OS by PD-L 1 expression: Check. Mate 057 • PD-L 1 expression was predictive of benefit with nivolumab ≥ 1% PD-L 1 expression level 90 80 Nivo Doc OS (%) 70 60 90 Median OS (mo) 17. 2 9. 0 Nivo Doc 70 Nivo Doc 30 Median OS(mo) 10. 4 10. 1 80 50 40 <1% PD-L 1 expression level 100 OS (%) 100 60 50 40 Nivo Doc 30 20 20 10 10 HR (95% CI)=0. 59 (0. 43, 0. 82) 0 HR (95% CI)=0. 90 (0. 66, 1. 24) 0 0 3 6 9 12 15 PD-L 1 expression level 18 21 24 27 0 3 6 9 Median OS (mo) 15 12 Time (months) 18 21 24 27 HR Nivolumab Docetaxel ≥ 5% 18. 2 8. 1 HR (95% CI) = 0. 43 (0. 30, 0. 63) <5% 9. 7 10. 1 HR (95% CI) = 1. 01 (0. 77, 1. 34) ≥ 10% 19. 4 8. 0 HR (95% CI) = 0. 40 (0. 26, 0. 59) <10% 9. 9 10. 3 HR (95% CI) = 1. 00 (0. 76, 1. 31) a. PD-L 1 expression was measured in pretreatment tumor biopsies (DAKO automated IHC assay). 2 CI=confidence interval; Doc=docetaxel; IHC=immunohistochemistry; Nivo=nivolumab; 1. Paz-Ares L, et al. Presented at ASCO 2015, Abstract LBA 109. 2. Rizvi NA, et al. Lancet Oncol 2015; 16: 257– 265. 9
Treatment and safety summary: Check. Mate 057 Nivolumab Docetaxel (n=287) (n=268) Any grade Grade 3– 4 a Treatment-related AEs leading to discontinuation, % 5 4 15 7 Treatment-related SAEs, % 7 5 20 18 Treatment-related AEs, %b 69 10 88 54 Fatigue Nausea Alopecia Neutropenia Treatment-related select AEs, %c Rash 16 12 <1 <1 1 1 0 0 29 26 25 31 5 1 0 27 9 <1 3 0 Pruritus 8 0 1 0 Diarrhea 8 1 23 1 Hypothyroidism 7 0 0 0 a. No grade 5 events were reported at DBL; 1 grade 5 event was reported for nivolumab post-DBL, death attributed to nivolumab (encephalitis) the association to nivolumab changed after DBL; 1 death attributed to docetaxel-related drug toxicity (grade 4 febrile neutropenia). b. Events show occurred in ≥ 25% of patients in either arm. c. Events shown occurred in ≥ 5% of patients in either arm. AE=adverse event; DBL=database lock; SAE=serious adverse event. Paz-Ares L, et al. Presented at ASCO 2015, Abstract LBA 109. 10
Check. Mate 017: Nivolumab in pretreated patients with squamous NSCLC Baseline characteristics Study schema Phase 3 Squamous NSCLC Stage IIIB/IV • Prior platinumbased chemotherapy • ECOG PS 0– 1 • N=264 (planned) Nivolumab 3 mg/kg IV Q 2 W until PD or unacceptable toxicity Docetaxel 75 mg/m 2 IV Q 3 W Endpoints Primary • OS Secondary • ORR • PFS • Safety and tolerability • PD-L 1 expression and efficacy CNS=central nervous system; CR=complete response; PR=partial response; SD=stable disease. Brahmer J, et al. New Engl J Med. 2015; 373: 123– 135. Nivolumab (n=135) Docetaxel (n=137) 62 (39– 85) 8 64 (42– 84) 13 Male, % 82 71 Disease stage, % Stage IIIb Stage IV 21 78 18 82 ECOG PS, % 0 1 20 79 27 73 CNS metastasis, % 7 6 Prior paclitaxel, % 34 34 Current/former smoker, % 90 94 Best response to last prior regimen, % CR or PR SD PD 36 24 33 31 34 30 Time since prior treatment, % <3 months 3– 6 months >6 months 47 26 26 43 29 27 Median age, years (range) Age ≥ 75 years, % 11
Overall survival, PFS, and RR: Check. Mate 017 OS 90 90 80 80 70 70 60 60 50 12 -mo OS rate = 42% 40 18 -mo OS rate = 28% 30 10 6 9 12 Docetaxel 21 18 24 27 0 30 33 Time (months) Number of Patients at Risk Nivolumab 15 Nivolumab 18 -mo PFS rate = 17% 18 -mo PFS rate = 2. 7% Docetaxel 10 Docetaxel 3 12 -mo PFS rate = 21% 20 18 -mo OS rate = 13% 0 40 12 -mo PFS rate = 6. 4% Nivolumab 0 50 30 12 -mo OS rate = 24% 20 PFS 100 PFS (%) OS (%) 100 0 3 6 9 113 86 69 57 51 37 25 137 104 69 46 33 22 17 11 14 7 6 0 0 Nivolumab 3 1 0 Docetaxel Median OS, months Median PFS, months ORR, % Median DOR, months August 2015 DBL. Minimum follow-up for survival: 18 months. Symbols represent censored observations. NR = not reached. Reckamp K, et al. Presented at WCLC 2015, Abstract 736. 18 30 21 24 27 8 2 0 0 0 Time (months) Number of Patients at Risk 135 15 12 135 68 48 33 24 20 16 12 137 62 27 10 8 3 1 1 Nivolumab (n=135) Docetaxel (n=137) 9. 2 3. 5 20 NR 6. 0 2. 8 9 8. 4 0 HR HR = 0. 62 (0. 48, 0. 81); P = 0. 0004 HR = 0. 63 (0. 48, 0. 83); P = 0. 0008 P = 0. 008 12
OS and PFS by PD-L 1 expression: Check. Mate 017 Survival benefit with nivolumab was independent of PD-L 1 expression level • PD-L 1 expressiona Patients, n Nivolumab Docetaxel Unstratified HR (95% Cl) PD-L 1 -positive expression PD-L 1 -negative expression NQ Interaction P-value OS ≥ 1% <1% ≥ 5% <5% ≥ 10% <10% NQ 63 54 42 75 36 81 18 56 52 39 69 33 75 29 0. 69 0. 58 0. 53 0. 70 0. 50 0. 70 0. 39 (0. 45, 1. 05) (0. 37, 0. 92) (0. 31, 0. 89) (0. 47, 1. 02) (0. 28, 0. 89) (0. 48, 1. 01) (0. 19, 0. 82) 63 54 42 75 36 81 18 56 52 39 69 33 75 29 0. 67 0. 66 0. 54 0. 75 0. 58 0. 70 0. 45 (0. 44, 1. 01) (0. 43, 1. 00) (0. 32, 0. 90) (0. 52, 1. 08) (0. 33, 1. 02) (0. 49, 0. 99) (0. 23, 0. 89) 0. 56 0. 47 0. 41 PFS ≥ 1% <1% ≥ 5% <5% ≥ 10% <10% NQ a. PD-L 1 expression was measured in pretreatment tumor biopsies (DAKO automated IHC assay) 2 0. 70 0. 16 0. 35 0. 125 0. 25 NQ=not quantifiable. 1. Brahmer J, et al. New Engl J Med. 2015; 373: 123– 135. 2. Rizvi NA, et al. Lancet Oncol. 2015; 16: 257– 265. Nivolumab 13 0. 5 1. 0 2. 0 HR ± 95% CI Docetaxel
LCSS Average Symptom Burden Index: Mean Change From Baseline While on Treatment Docetaxel Nivolumab 15 LCSS ACBI Mean Change From Baseline 10 Worse 5 0 -5 -10 Better -15 -20 -25 3 4 6 8 9 12 15 16 18 20 21 24 30 36 42 48 54 Time (weeks) Only time points where data are available for >10 patients are plotted on the graph. MID (minimally important difference) consists of a change of ≥ 10 points (indicated by dotted lines). Bars represent 95% confidence intervals (based on parametric t-test). Bars that do not cross 0 indicate means that are significantly different from 0. ASBI = Average Symptom Burden Index
KEYNOTE-010: Phase 2/3 Pembrolizumab vs Docetaxel for PD-L 1–Positive NSCLC After Platinum-Based Therapy • • Patients Advanced NSCLC Confirmed PD after ≥ 1 line of chemotherapya No active brain metastases ECOG PS 0 -1 PD-L 1 TPS ≥ 1% (22 C 3 Ab) ( No serious autoimmune disease No ILD or pneumonitis requiring systemic steroids Stratification factors: • ECOG PS (0 vs 1) • Region (East Asia vs non-East Asia) • PD-L 1 statusb (TPS ≥ 50% vs 1%-49%) Pembrolizumab 2 mg/kg IV Q 3 W for 24 months R 1: 1: 1 Pembrolizumab 10 mg/kg IV Q 3 W for 24 months Docetaxel 75 mg/m 2 Q 3 W per local guidelinesc End points in the TPS ≥ 50% stratum and TPS ≥ 1% population • Primary: PFS and OS • Secondary: ORR, duration of response, safety Clinical. Trials. gov, NCT 01905657. a. Prior therapy must have included ≥ 2 cycles of platinum-doublet chemotherapy. An appropriate tyrosine kinase inhibitor was required for patients whose tumors had an EGFR sensitizing mutation or an ALK translocation. b. Added after 441 patients enrolled based on results from KEYNOTE-001 (Garon EB et al. N Engl J Med. 2015; 372: 2018 -28). c. Patients received the maximum number of cycles permitted by the local regulatory authority.
KEYNOTE-010. Baseline Characteristics Pembro 2 Q 3 W n = 344 Pembro 10 Q 3 W n = 346 Docetaxel n = 343 63 (29 -82) 63 (20 -88) 62 (33 -82) Male, % 62 62 61 ECOG PS, 1 67 65 65 Smoking status, % Former/current Never Unknown 81 18 1 82 17 <1 78 20 2 PD-L 1 TPS, % ≥ 50% 1 -49% 40 60 44 56 Histology, % Squamous Nonsquamous Other/unknown 22 70 8 23 71 6 19 70 11 71 27 68 20 69 22 Age, median (range), years Prior lines, advanced disease 1 ≥ 2 a 1 Analysis cut-off date: September 30, 2015. 66% with ≥ 1% 28% with ≥ 50% patient had unknown ECOG PS. 5/6 patients with ECOG PS ≥ 2 during screening resolved to ≤ 1 by treatment assignment.
Overall Survival KEYNOTE-010 OS, PD-L 1 TPS ≥ 50% Stratum Median (95% CI), mo HRa (95% CI) P Pembro 2 mg/kg 14. 9 (10. 4 -NR) 0. 54 (0. 38 -0. 77) 0. 0002 Pembro 10 mg/kg 17. 3 (11. 8 -NR) 0. 50 (0. 36 -0. 70) <0. 0001 Docetaxel 8. 2 (6. 4 -10. 7) — — Treatment Arm Median (95% CI), mo Rate at 1 y HRa (95% CI) P Pembro 2 mg/kg 10. 4 (9. 4 -11. 9) 43. 2% 0. 71 (0. 58 -0. 88) 0. 0008 Pembro 10 mg/kg 12. 7 (10. 0 -17. 3) 52. 3% 0. 61 (0. 49 -0. 75) <0. 0001 8. 5 (7. 5 -9. 8) 34. 6% — — Treatment Arm Docetaxel Pembro 2 vs 10 mg/kg: HR 1. 12, 95% CI 0. 77 -1. 62 100 90 90 80 80 Overall Survival, % OS, PD-L 1 TPS ≥ 1% (Total Population) 70 60 50 40 30 20 20 10 10 0 0 5 10 15 20 25 139 151 152 110 115 90 51 60 38 20 25 19 3 1 1 0 0 0 Time, months Pembro 2 vs 10 mg/kg: HR 1. 17, 95% CI 0. 94 -1. 45 0 0 5 344 346 343 259 255 212 10 15 Time, months 115 124 79 49 56 33 20 12 6 1
OS in Key Subgroups, PD-L 1 TPS ≥ 1% Subgroup No. of Events/ No. of Patients Hazard Ratio (95% CI) Overall 521/1033 Sex Male 332/634 Female 189/399 Age <65 years 317/604 204/429 ³ 65 years ECOG performance status 0 149/348 1 367/678 PD-L 1 tumor proportion score 204/442 ³ 50% 1%– 49% 317/591 Tumor sample Archival 266/455 New 255/578 Histology Squamous 128/222 Adenocarcinoma 333/708 EGFR status Mutant 46/86 Wild type 447/875 0. 1 Favors Pembrolizumab Analysis cut-off date: September 30, 2015. 0. 67 (0. 56 -0. 80) 0. 65 (0. 52 -0. 81) 0. 69 (0. 51 -0. 94) 0. 63 (0. 50 -0. 79) 0. 76 (0. 57 -1. 02) 0. 73 (0. 52 -1. 02) 0. 63 (0. 51 -0. 78) 0. 53 (0. 40 -0. 70) 0. 76 (0. 60 -0. 96) 0. 70 (0. 54 -0. 89) 0. 64 (0. 50 -0. 83) 0. 74 (0. 50 -1. 09) 0. 63 (0. 50 -0. 79) 0. 88 (0. 45 -1. 70) 0. 66 (0. 55 -0. 80) 1 10 Favors Docetaxel a. Data for the pembrolizumab doses were pooled.
Progression free Survival KEYNOTE-010 PFS (RECIST v 1. 1, Central Review), PD-L 1 TPS ≥ 50% Median (95% CI), mo HRa (95% CI) P Pembro 2 mg/kg 5. 0 (4. 0 -6. 5) 0. 59 (0. 44 -0. 78) 0. 0001 Pembro 10 mg/kg 5. 2 (4. 1 -8. 1) 0. 59 (0. 45 -0. 78) <0. 0001 Docetaxel 4. 1 (3. 6 -4. 3) — — Treatment Arm Median (95% CI), mo HRa (95% CI) P Pembro 2 mg/kg 3. 9 (3. 1 -4. 1) 0. 88 (0. 74 -1. 05) 0. 07 Pembro 10 mg/kg 4. 0 (2. 7 -4. 3) 0. 79 (0. 66 -0. 94) 0. 004 Docetaxel 4. 0 (3. 1 -4. 2) — — Treatment Arm 100 90 90 Pro gressio n-Free Survival, % Progression-Free Survival, % PFS (RECIST v 1. 1, Central Review), PD-L 1 TPS ≥ 1% 80 70 60 50 40 30 20 10 10 0 80 0 0 5 10 15 Time, months 139 151 152 66 72 45 29 36 17 6 12 5 20 25 0 0 0 0 344 346 343 122 137 103 10 15 Time, months 20 25 46 60 27 1 1 0 0 12 19 6 a. Comparison of pembrolizumab vs docetaxel.
a. Comparison ORR (RECIST v 1. 1, Central Review) PD-L 1 TPS ≥ 50% ORR, % (95% CI) PD-L 1 TPS ≥ 1% ORR, % (95% CI) Pembro 2 mg/kg Pembro 10 mg/kg 30 (23 -39) P < 0. 0001 a 29 (22 -37) P < 0. 0001 a Pembro 2 mg/kg Pembro 10 mg/kg 18 (14 -22) P = 0. 0005 a 18 (14 -23) P = 0. 0002 a of pembrolizumab vs docetaxel. Docetaxel 8 (4 -13) Docetaxel 9 (6 -13) Duration of response PD-L 1 TPS ≥ 50% 100 90 80 70 60 50 40 Response, % 100 90 80 70 60 50 40 30 20 10 0 PD-L 1 TPS ≥ 1% 0 5 42 44 12 27 31 7 10 15 20 11 18 0 4 4 0 0 Time, months 30 20 10 0 0 5 62 64 32 40 42 12 10 15 20 19 22 0 8 5 0 1 0 0 Time, months Treatment Arm Median mo Pembro 2 mg/kg NR (1+ to 17+) Pembro 2 mg/kg NR (1+ to 20+) Pembro 10 mg/kg NR (2+ to 18+) Docetaxel 6 (1+ to 9+)
Immune-Mediated AEs Occurring in ≥ 2 Patients in the Pembrolizumab Arms Patients, % 10 9 Pembrolizumab 2 mg/kg 8 Pembrolizumab 10 mg/kg 7 Docetaxel Grade 1 -2 ≥ 3 6 5 4 3 2 1 ab di Analysis cut-off date: September 30, 2015. 0 m Typ el e lit 1 us 0 et 00 su Ad ffi re cie na nc l y M yo sit is Th yr oi di tis Au to im he m pa un ti e Hy tis po ph ys iti s lit i 0 in yr rth Co oi di sm s pe Hy Pn eu m on iti sm oi di yr ot h Hy p 00 s Se v re ere ac sk tio in ns Pa nc re at iti s 0 0
22
23
24
25
26
QUIMIOTERAPIA INMUNOTERAPIA QUIMIOTERAPIA + ANTIANGIOGÉNICOS • D + RAMUCIRUMAB • D + NINTEDANIB EGFR-TKI 27
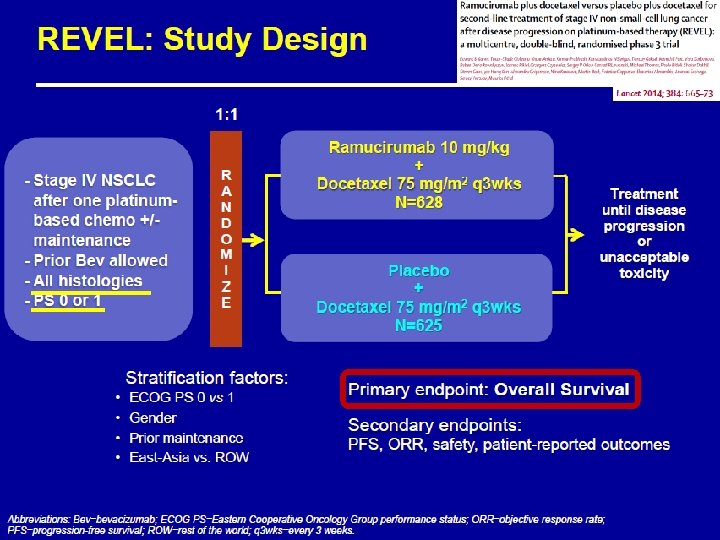
RESPONSE RATE Med OS: 10. 5 m (R) vs 9. 1 m (P) PFS Med PFS: 4, 5 m (R) vs 3, 0 m (P)
RESPONSE RATE Med OS: 10. 5 m (R) vs 9. 1 m (P) OVERALL SURVIVAL PFS Med OS: 10, 5 m (R) vs 9. 1 m (P) Med PFS: 4, 5 m (R) vs 3, 0 m (P)
Med OS: 11. 1 m (R) vs 9. 7 m (P) Med OS: 9. 5 m (R) vs 8. 2 m (P)
LUME-Lung 1: Study design • Stage IIIB/IV* or recurrent NSCLC • Failed 1 st-line chemotherapy • Any histology • ECOG PS 0 or 1 • No prior docetaxel or VEGF/VEGFR inhibitors** • No active brain metastases R A N D O M I S E N=1314 Nintedanib 200 mg BID PO, D 2– 21, + Docetaxel 75 mg/m 2 IV, D 1, 21 -day cycles (n=655) PD Placebo BID PO, D 2– 21, + Docetaxel 75 mg/m 2 IV, D 1, 21 -day cycles (n=659) PD 1: 1 Number of docetaxel cycles not restricted Monotherapy allowed after ≥ 4 cycles of combination therapy EXCLUSION CRITERIA: • Active Brain Mets • Cavitary/ necrotic tumours, centrally located tumours with radiographic evidence of invasion of major blood vessels • Recent history of clinically signifi cant haemoptysis or a major thrombotic. • Clinically relevant major bleeding event ** Other than bevacizumab Primary endpoint: PFS by independent central review Key secondary endpoint: OS preplanned analyses of adenocarcinoma and ITT
RESPONSE RATE
Progression Free Survival PFS total population: 3. 4 months vs 2. 7 months; HR 0· 79 (95% CI 0. 68– 0. 92), p=0. 0019). PFS Adenocarcinoma: 4, 0 months vs 2. 8 months; HR 0. 77, (95%CI 0. 62– 0. 96), p=0. 0193 PFS Squamous: 2, 9 months vs 2. 6 months; HR 0. 77, (95% CI 0. 62– 0. 96), p=0. 0200
Overall Survival ADK PD<9 m: 10. 9 months vs 7. 9 months; HR 0. 75 (95% CI 0. 60– 0. 92), p=0. 0073. (PFS 4. 2 months vs 1. 5 months; HR 0· 68 [95% CI 0· 54– 0· 84], p=0. 0005). All ADK: 12. 6 months vs 10. 3 months; HR 0· 83 (95% CI 0. 70– 0. 99), p=0. 0359. Total: 10. 1 months vs 9. 1 months; HR 0. 94 (95% CI 0. 83– 1. 05), p=0. 2720.
50 45 40 35 30 25 20 15 10 5 ≥ 15% incidence CTCAE grades ≥ 3 ≥ 1% incidence Nintedanib + docetaxel Placebo + docetaxel tr o LT Faph in tigils cr ue ea se A ST Na d A us pp et inc ea ite re d as ec ed re as D ys ed pn Vo oe m a it A ing lo pe ci C a ou Py gh C on rex st i ip a at io D n ec re as ed n eu tr A LT op in hil s cr ea se D d ia rr Fa hoe tig a ue D ys A pn ST oe in a cr Pn eas eu ed m on ia A st he ni A C pp a he et s t p ite ai d n ec re as ed 0 A ed n D re as ec D 50 45 40 35 30 25 20 15 10 5 eu ia rr ho 0 All CTCAE grades ea Patients (%) Safety in all treated patients Nintedanib + docetaxel (n=652) Placebo + docetaxel (n=655) Any AE leading to discontinuation 22. 7 21. 7 Any serious AE 34. 4 31. 5 Patients with AE, % 39
VEGF/VEGFR inhibitor-associated adverse events 20 14. 1 Nintedanib + docetaxel Placebo + docetaxel CTCAE Grade ≥ 3 (%) Nintedanib + docetaxel Placebo + docetaxel 15 11. 6 10 5 g in d ee Bl fo er p GI b m is ol E VT p Hy t er s en n io g in B d lee n io t ra fo er p GI Th r om b m e bo ism ol E VT E AT Hy 2 6 n io ns te r pe 0. 5 0. 2 E AT 0. 5 0. 6 1. 2 1. 1 1. 2. 8 2. 0. 9 1. 6 0. 5 0 m e bo om r Th n io t ra 0. 0 0. 5 1. 4 5 3 1 3. 1 2. 8 3. 5 4. 5 6 5. 1 10 0. Patients (%) 15 20 All CTCAE grades (%)
QUIMIOTERAPIA + ANTIANGIOGÉNICOS EGFR-TKI INMUNOTERAPIA • ERLOTINIB • AFATINIB 42
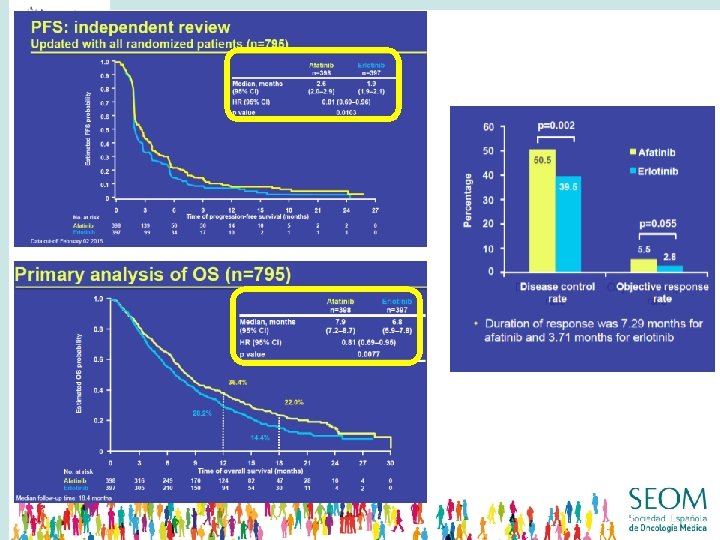
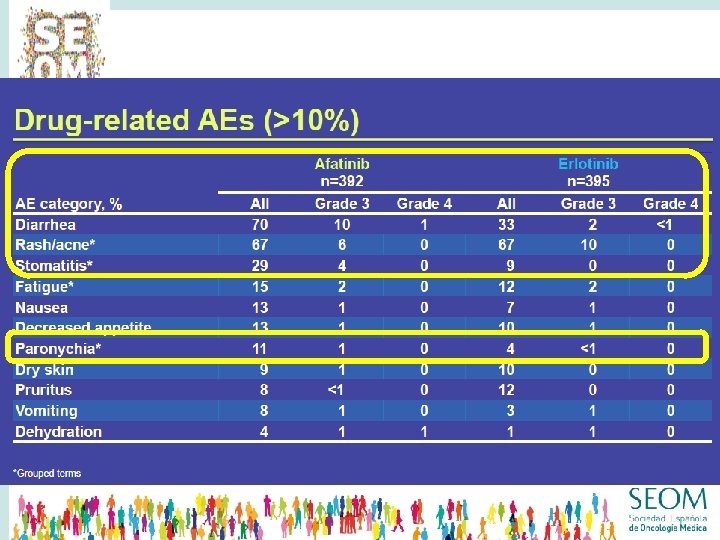
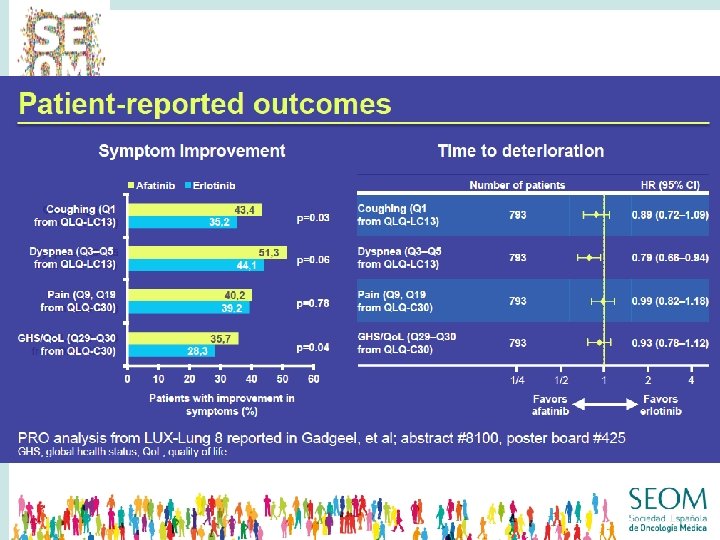
LUX-Lung 8: study design March 2012 - Jan 2014 Stratified by east Asian vs non-east Asian SCC of the lung (Stage IIIB/IV)1 Progressed after ≥ 4 cycles of a first-line platinum-doublet Afatinib 40 mg* QD 1: 1 ECOG PS 0– 1 Adequate organ function Erlotinib 150 mg† QD Primary endpoint PFS by independent review‡ Key secondary endpoint Overall survival Other secondary endpoints: ORR, DCR, tumor shrinkage, PRO, safety *Dose escalation to 50 mg and dose reduction to 30 or 20 mg permitted †Dose reduction to 100 or 50 mg permitted ‡Tumor assessment at baseline, Weeks 8, 12, 16; every 8 weeks thereafter 1. Edge S, et al. (Editor). AJCC Cancer Staging Manual. 7 th ed. New York: Springer-Verlag New York, 2010.
CARCINOMA ESCAMOSO QUIMIOTERAPIA • DOCETAXEL • PEMETREXED QUIMIOTERAPIA + ANTIANGIOGÉNICOS • D + RAMUCIRUMAB • D + NINTEDANIB INMUNOTERAPIA EGFR-TKI • NIVOLUMAB • PEMBROLIZUMAB • ATEZOLIZUMAB • ERLOTINIB • AFATINIB 48
CARCINOMA NO ESCAMOSO QUIMIOTERAPIA • DOCETAXEL • PEMETREXED QUIMIOTERAPIA + ANTIANGIOGÉNICOS • D + RAMUCIRUMAB • D + NINTEDANIB INMUNOTERAPIA EGFR-TKI • NIVOLUMAB • PEMBROLIZUMAB • ATEZOLIZUMAB • ERLOTINIB • AFATINIB 50
Final comments • Immunotherapy has become a cornerstone in the treatment of second line NSCLC. – Long–term survivors. – Better safety profile and Qo. L than CT. – Ongoing clinical trials in first line, neoadjuvant and adjuvant setting, or in combination with CT or anti-CTLA 4. – Different toxicity etiology, different management strategies. • Second line chemotherapy will also be considered at progression to immunotherapy or for patients not suitable for immunotherapy: – Clinical characteristics – Comorbidities – Histology
Tratamiento de segunda línea del CPNM, nuevos tiempos para nuevos fármacos Margarita Majem Hospital de la Santa Creu i Sant Pau Barcelona