Self Ionisation of Water undergoes Self Ionisation H
 ⇄ H+(aq) + OH-(aq)")

 ⇄ H+(aq) + OH-(aq) Kc = In")
 Kw (mol 2/litre 2) 0 0. 114 x")

 10 -1 OH- H+ 10 -7 H+ OH-")
 The p. H scale was invented by")


![p. H For H 2 O(l) ⇄ H+(aq) + OH-(aq) → [H+ ] =](https://slidetodoc.com/presentation_image_h/3555e8c7fb811fc978f2463aa086905f/image-14.jpg "p. H For H 2 O(l) ⇄ H+(aq) + OH-(aq) → [H+ ] =")
 p. H 0 7. 12 10 7.")

 10 -1 p. H =")
![�p. H describes both [H+ ] and [OH- ] 0 Acidic [H+ ] =](https://slidetodoc.com/presentation_image_h/3555e8c7fb811fc978f2463aa086905f/image-18.jpg "�p. H describes both [H+ ] and [OH- ] 0 Acidic [H+ ] =")

![More acidic More basic p. H [H+] [OH-] p. OH Na. OH, 0. 1](https://slidetodoc.com/presentation_image_h/3555e8c7fb811fc978f2463aa086905f/image-21.jpg "More acidic More basic p. H [H+] [OH-] p. OH Na. OH, 0. 1")
![Calculations and practice • You will need to memorize the following: [H+] = 10–p.](https://slidetodoc.com/presentation_image_h/3555e8c7fb811fc978f2463aa086905f/image-22.jpg "Calculations and practice • You will need to memorize the following: [H+] = 10–p.")
![p. H Calculations p. H = -log 10[H+] = 10 -p. H + p.](https://slidetodoc.com/presentation_image_h/3555e8c7fb811fc978f2463aa086905f/image-23.jpg "p. H Calculations p. H = -log 10[H+] = 10 -p. H + p.")

 p. H of 0. 02 M HCl p. H =")

![p. H = - log [H+] Given: p. H = 4. 6 2 nd](https://slidetodoc.com/presentation_image_h/3555e8c7fb811fc978f2463aa086905f/image-27.jpg "p. H = - log [H+] Given: p. H = 4. 6 2 nd")


 H+(aq) + In¯(aq) In")


- Slides: 51
Self Ionisation of Water undergoes Self Ionisation H 2 O(l) ⇄ H+(aq) + OH-(aq) or H 2 O(l) + H 2 O(l) ⇄ H 3 O+ (aq) + - OH (aq) The concentration of H+ ions and OH- ions is extremely small. Because the equilibrium lies very much on the left hand side.
Glossary Ionisation Strong/weak acids Ionic Product Strong/Weak bases p. H Curve Logarithm End-Point Kw Dissociation Constant Indicator p. H scale
Ionic Product of Water H 2 O(l) ⇄ H+(aq) + OH-(aq) Kc = In the above expression, the value of [H 2 O] may be taken as having a constant value because the degree of ionisation is so small. Kc = Kc [H 2 O] = [H+] [OH-] Both Kc and [H 2 O] are constant values so Kw = Kc [H 2 O] = [H+] [OH-] Kw = [H+] [OH-] is the ionic product of water
Kw is temperature dependent T (°C) Kw (mol 2/litre 2) 0 0. 114 x 10 -14 10 0. 293 x 10 -14 20 0. 681 x 10 -14 25 1. 008 x 10 -14 30 1. 471 x 10 -14 40 2. 916 x 10 -14 50 5. 476 x 10 -14 Kw of pure water decreases as the temperature increases
Acid–Base Concentrations in Solutions
Acid–Base Concentrations in Solutions concentration (moles/L) 10 -1 OH- H+ 10 -7 H+ OH- H+ 10 -14 [H+] > [OH-] acidic solution [H+] = [OH-] neutral solution [H+] < [OH-] basic solution
p. H Scale Sorensen (1868 - 1939) The p. H scale was invented by the Danish chemist Sorensen to measure the acidity of beer in a brewery. The p. H scale measured the concentration of hydrogen ions in solution. The more hydrogen ions, the stronger the acid.
The p. H Scale 1 2 Strong Acid 3 4 Weak Acid 5 6 7 Neutral 8 9 10 11 Weak Alkali 12 13 14 Strong Alkali
p. H Scale The quantity of hydrogen ions in solution can affect the color of certain dyes found in nature. These dyes can be used as indicators to test for acids and alkalis. An indicator such as litmus (obtained from lichen) is red in acid. If base is slowly added, the litmus will turn blue when the acid has been neutralized, at about 6 -7 on the p. H scale. Other indicators will change color at different p. H’s. A combination of indicators is used to make a universal indicator.
Measuring p. H �Universal Indicator Paper �Universal Indicator Solution �p. H meter
Measuring p. H can be measured in several ways � Usually it is measured with a coloured acid-base indicator or a p. H meter � Coloured indicators are a crude measure of p. H, but are useful in certain applications � p. H meters are more accurate, but they must be calibrated prior to use with a solution of known p. H
Limitations of p. H Scale The p. H scale ranges from 0 to 14 Values outside this range are possible but do not tend to be accurate because even strong acids and bases do not dissociate completely in highly concentrated solutions. p. H is confined to dilute aqueous solutions
p. H At 250 C Kw = 1 x 10 -14 mol 2/litre 2 [H+ ] x [OH- ] = 1 x 10 -14 mol 2/litre 2 This equilibrium constant is very important because it applies to all aqueous solutions - acids, bases, salts, and non-electrolytes - not just to pure water.
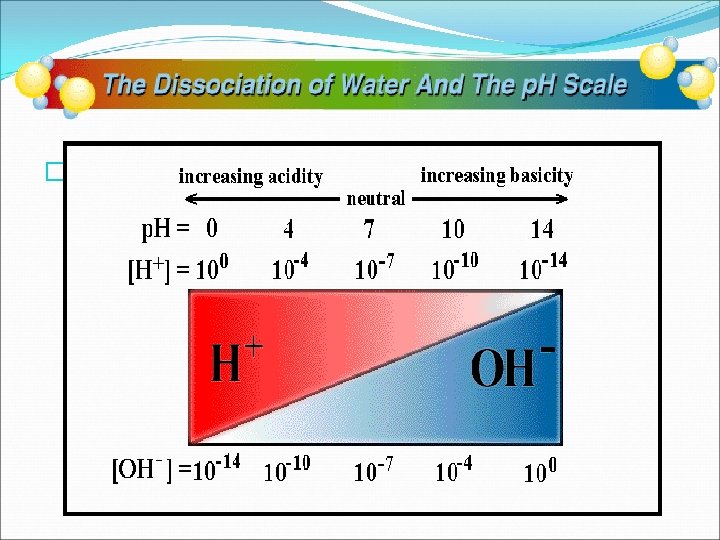
p. H For H 2 O(l) ⇄ H+(aq) + OH-(aq) → [H+ ] = [OH- ] [H+ ] x [OH- ] = 1 x 10 -14 = [1 x 10 -7 ] x [1 x 10 -7 ] [H+ ] of water is at 250 C is 1 x 10 -7 mol/litre Replacing [H+ ] with p. H to indicate acidity of solutions p. H 7 replaces [H+ ] of 1 x 10 -7 mol/litre where p. H = - Log 10 [H+ ]
p. H is temperature dependent T (°C) p. H 0 7. 12 10 7. 06 20 7. 02 25 7 30 6. 99 40 6. 97 p. H of pure water decreases as the temperature increases A word of warning! If the p. H falls as temperature increases, does this mean that water becomes more acidic at higher temperatures? NO! Remember a solution is acidic if there is an excess of hydrogen ions over hydroxide ions. In the case of pure water, there always the same number of hydrogen ions and hydroxide ions. This means that the water is always neutral - even if its p. H change
Students should be able to: • define p. H • describe the use of the p. H scale as a measure of the degree of acidity/alkalinity • discuss the limitations of the p. H scale • explain self-ionisation of water • write an expression for Kw
Acid – Base Concentrations and p. H concentration (moles/L) 10 -1 p. H = 11 p. H = 3 OH- H+ p. H = 7 10 -7 H+ OH- H+ 10 -14 [H 3 O+] > [OH-] [H 3 O+] = [OH-] acidic solution neutral solution [H 3 O+] < [OH-] basic solution
�p. H describes both [H+ ] and [OH- ] 0 Acidic [H+ ] = 100 p. H � Neutral [H+ ] = 10 -7 p. H � = 0 Basic p. H = 7 [H+ ] = 10 -14 = 14 [OH- ] =10 -14 p. OH = 14 [OH- ] =10 -7 p. OH = 7 [OH- ] = 100 p. OH = 0
p. H of Common Substances Acidic Neutral Basic
More acidic More basic p. H [H+] [OH-] p. OH Na. OH, 0. 1 M Household bleach Household ammonia Lime water Milk of magnesia Borax Baking soda Egg white, seawater Human blood, tears Milk Saliva Rain Black coffee Banana Tomatoes Wine Cola, vinegar Lemon juice Gastric juice 14 13 12 11 10 9 8 7 6 5 4 3 2 1 0 1 x 10 -14 1 x 10 -0 0 1 x 10 -13 1 x 10 -1 1 1 x 10 -12 1 x 10 -2 2 1 x 10 -11 1 x 10 -3 3 1 x 10 -10 1 x 10 -4 4 1 x 10 -9 1 x 10 -5 5 1 x 10 -8 1 x 10 -6 6 1 x 10 -7 7 1 x 10 -6 1 x 10 -8 8 1 x 10 -5 1 x 10 -9 9 1 x 10 -4 1 x 10 -10 10 1 x 10 -3 1 x 10 -11 11 1 x 10 -2 1 x 10 -12 12 1 x 10 -13 13 1 x 100 1 x 10 -14 14
Calculations and practice • You will need to memorize the following: [H+] = 10–p. H [OH–] = 10–p. OH p. H = – log 10[H+] p. OH = – log 10[OH–] p. H + p. OH = 14
p. H Calculations p. H = -log 10[H+] = 10 -p. H + p. OH = 14 p. OH [H+] [OH-] = 1 x 10 -14 p. OH = -log 10[OH-] = 10 -p. OH [OH-]
p. H for Strong Acids � Strong acids dissociate completely in solution �Strong alkalis (bases) also dissociate completely in solution. � It is easy to calculate the p. H of strong acids and strong bases; you only need to know the concentration
p. H Exercises a) p. H of 0. 02 M HCl p. H = – log 10 [H+] = – log 10 [0. 020] = 1. 6989 = 1. 70 b) p. H of 0. 0050 M Na. OH p. OH = – log 10 [OH–] = – log 10 [0. 0050] = 2. 3 p. H = 14 – p. OH = 14 – 2. 3 =11. 7 c) p. H of solution where [H +] is 7. 2 x 10 -8 M p. H = – log 10 [H+] = – log 10 [7. 2 x 10 -8] = 7. 14 (slightly basic)
p. H of dilute aqueous solutions of strong acids monoprotic e. g. HCl, HNO 3 HA(aq) 0. 3 M H 1+(aq) + A 1 -(aq) 0. 3 M p. H = ? p. H = - log 10 [H+] p. H = - log 10[0. 3 M] p. H = 0. 48 diprotic e. g. H 2 SO 4 H 2 A(aq) 0. 3 M 2 H 1+(aq) + A 2 -(aq) 0. 6 M 0. 3 M p. H = - log 10[H+] p. H = - log 10[0. 6 M] p. H = 0. 78
p. H = - log [H+] Given: p. H = 4. 6 2 nd determine the [hydrogen ion] p. H = - log 10 [H+] choose proper equation 4. 6 = - log 10 [H+] substitute p. H value in equation - 4. 6 = log 10[H+] multiply both sides by -1 log - 4. 6 = antilog [H+] take antilog of both sides [H+] = 2. 51 x 10 -5 M 10 x antilog You can check your answer by working backwards. p. H = - log 10[H+] p. H = - log 10[2. 51 x 10 -5 M] p. H = 4. 6
Most substances that are acidic in water are actually weak acids. Because weak acids dissociate only partially in aqueous solution, an equilibrium is formed between the acid and its ions. The ionization equilibrium is given by: HX(aq) H+(aq) + X-(aq) where X- is the conjugate base.
p. H calculations for Weak Acids and Weak Bases For Weak Acids p. H = -Log 10 For Weak Bases p. OH = Log 10 p. H = 14 - p. OH
Calculating p. H - weak acids A weak acid is one which only partially dissociates in aqueous solution A weak acid, HA, dissociates as follows HA(aq) Applying the Equilibrium Law Ka = [H+(aq)] [A¯(aq)] mol dm-3 therefore (2) [H+(aq)] = [A¯(aq)] therefore Ka = [H+(aq)]2 Rearranging (3) gives (1) [HA(aq)] The ions are formed in equal amounts, so H+(aq) + A¯(aq) (3) [HA(aq)] [H+(aq)]2 = [HA(aq)] Ka [H+(aq)] = [HA(aq)] Ka
p. H of solutions of weak concentrations Weak Acid p. H of a 1 M solution of ethanoic acid with a Ka value of 1. 8 x 10 5 p. H = -Log 10 p. H = 2. 3723
p. H of solutions of weak concentrations Weak Base p. H of a 0. 2 M solution of ammonia with a Kb value of 1. 8 x 10 -5 p. OH = -log 10 p. OH = 2. 7319 p. H = 14 – 2. 7319 p. H = 11. 2681
Theory of Acid Base Indicators Acid-base titration indicators are quite often weak acids. For the indicator HIn The equilibrium can be simply expressed as HIn(aq, colour 1) H+(aq) + In-(aq, colour 2) The un-ionised form (HIn) is a different colour to the anionic form (In¯).
Theory of Acid Base Indicators Applying Le Chatelier's equilibrium principle: Addition of acid • favours the formation of more HIn (colour 1) HIn(aq) H+(aq) + In-(aq) because an increase on the right of [H+] causes a shift to left increasing [HIn] (colour 1) to minimise 'enforced' rise in [H+].
Theory of Acid Base Indicators Applying Le Chatelier's equilibrium principle: Addition of base • favours the formation of more In- (colour 2) HIn(aq) H+(aq) + In-(aq) The increase in [OH-] causes a shift to right because the reaction H+(aq) + OH-(aq) ==> H 2 O(l) Reducing the [H+] on the right so more HIn ionises to replace the [H+] and so increasing In- (colour 2) to minimise 'enforced' rise in [OH-]
Theory of Acid Base Indicators Summary In acidic solution HIn(aq) H+(aq) + In¯(aq) In alkaline solution
Theory of Acid Base Indicators Acid-base titration indicators are also often weak bases. For the indicator MOH The equilibrium can be simply expressed as MOH(aq, colour 1) OH-(aq) + M+(aq, colour 2)
Theory of Acid Base Indicators Applying Le Chatelier's equilibrium principle: Addition of base • favours the formation of more MOH (colour 1) MOH(aq) M+(aq) + OH-(aq) because an increase on the right of [OH-] causes a shift to left increasing [MOH] (colour 1) to minimise 'enforced' rise in [OH ].
Theory of Acid Base Indicators Applying Le Chatelier's equilibrium principle: Addition of acid • favours the formation of more M+ (colour 2) MOH(aq) M+(aq) + OH-(aq) The increase in [H+] causes a shift to right because the reaction H+(aq) + OH-(aq) ==> H 2 O(l) Reducing the [OH-] on the right so more MOH ionises to replace the [OH-] and so increasing M+ (colour 2) to minimise 'enforced' rise in [H+]
Acid Base Titration Curves Strong Acid – Strong Base Weak Acid – Strong Base Strong Acid – Weak Base Weak Acid – Weak Base
Choice of Indicator for Titration Indicator must have a complete colour change in the vertical part of the p. H titration curve Indicator must have a distinct colour change Indicator must have a sharp colour change
Indicators for Strong Acid Strong Base Titration Both phenolphthalein and methyl orange have a complete colour change in the vertical section of the p. H titration curve
Indicators for Strong Acid Weak Base Titration Methyl Orange is used as indicator for this titration Only methyl orange has a complete colour change in the vertical section of the p. H titration curve Phenolphthalein has not a complete colour change in the vertical section on the p. H titration curve.
Indicators for Weak Acid Strong Base Titration Phenolphthalein is used as indicator for this titration Only phenolphthalein has a complete colour change in the vertical section of the p. H titration curve Methyl has not a complete colour change in the vertical section on the p. H titration curve.
Indicators for Weak Acid Weak Base Titration No indicator suitable for this titration because no vertical section Neither phenolphthalein nor methyl orange have completely change colour in the vertical section on the p. H titration curve
indicator p. H range litmus 5 -8 methyl orange 3. 1 - 4. 4 phenolphthalein 8. 3 - 10. 0
Colour Changes and p. H ranges
Methyl Orange
Phenolphthalein
Universal indicator components Indicator Low p. H color Transition p. H range High p. H color Thymol blue (first transition) red 1. 2– 2. 8 orange Methyl Orange red 4. 4– 6. 2 yellow Bromothymol blue yellow 6. 0– 7. 6 blue Thymol blue (second transition) yellow 8. 0– 9. 6 blue colourless 8. 3– 10. 0 purple Phenolphthalein
Students should be able to: • • • calculate the p. H of dilute aqueous solutions of strong acids and bases distinguish between the terms weak, strong, concentrated and dilute in relation to acids and bases calculate the p. H of weak acids and bases (approximate method of calculation to be used – assuming that ionisation does not alter the total concentration of the non-ionised form) define acid-base indicator explain theory of acid-base indicators justify the selection of an indicator for acid base titrations