New Concepts and Strategies for Prevention of Cardiovascular


. Source: NCHS")
 Source: NCHS and NHLBI.")


, Soft plaque (+), Fibrous plaque (+), Calcification (-) LAD Motoyama")
")
 Cigarette smoking")
 – Weight (kg)/height (m")


 Fat The dangerous inner fat! Front Visceral AT Subcutaneous AT Back")

 Men Women TG")

 and Total Mortality: US Men and Women Ages 30 -74 (age,")

 by Calcium Score Events by CAC Categories in")

 11 .")


- Slides: 59
New Concepts and Strategies for Prevention of Cardiovascular Disease Nathan D. Wong, Ph. D, FACC, FAHA Professor and Director, Heart Disease Prevention Program Division of Cardiology, University of California, Irvine Immediate Past President, American Society for Preventive Cardiology
CVD and other major causes of death for all males and females (United States: 2007). 450, 000 400, 000 421, 918 391, 886 350, 000 292, 857 Deaths 300, 000 270, 018 250, 000 200, 000 150, 000 79, 827 100, 000 66, 689 61, 235 52, 832 43, 879 35, 478 50, 000 35, 904 21, 800 0 A B C D E Males F A B D F C E Females Source: NCHS and NHLBI. A indicates CVD plus congenital CVD; B, cancer; C, accidents; D, CLRD; E, diabetes; and F, Alzheimer's disease. © 2010 American Heart Association, Inc. All rights reserved. Roger VL et al. Published online in Circulation Dec. 15, 2010
CVD disease mortality trends for males and females (United States: 1979 -2006). Source: NCHS and NHLBI.
Percentage breakdown of deaths from cardiovascular diseases (United States: 2004) Source: NCHS and NHLBI.
Women and Heart Disease • 1 in 3 women die of heart disease, but only 4% fear of dying from heart disease • 1 in 27 women die of breast cancer, but 40% fear of dying of breast cancer • Only 38% of women reported that their doctors had ever discussed heart disease with them.
www. goredforwomen. org/
Development of Atherosclerotic Plaques Fatty streak Normal Lipid-rich plaque Foam cells Fibrous cap Thrombus Ross R. Nature. 1993; 362: 801 -809. Lipid core
PDAY: Percentage of Right Coronary Artery Intimal Surface Affected With Early Atherosclerosis 30 Intimal surface (%) Men Raised lesions 30 Fatty streaks 20 20 10 10 0 30 0 15 -19 20 -24 25 -29 30 -34 White 30 20 20 10 10 0 0 15 -19 20 -24 25 -29 30 -34 Black Age (y) PDAY= Pathobiological Determinants of Atherosclerosis in Youth. Strong JP, et al. JAMA. 1999; 281: 727 -735. Women 15 -19 20 -24 25 -29 30 -34 White 15 -1920 -2425 -2930 -34 Black
Coronary Calcium Screening: Early Detection of Heart Disease
CT Angiographic Image of the Heart and Coronary Arteries
ACS Positive remodeling (+), Soft plaque (+), Fibrous plaque (+), Calcification (-) LAD Motoyama et al. JACC 2007; 50: 319 -26
Prevalence of Multi-Site Atherosclerosis by Gender and Age: MESA Study (CAC, ABI, and/or CIMT) Me n W o men Wong ND et al. Atherosclerosis 2011
Major Risk Factors • • Age (men 45 years; women 55 years) Cigarette smoking (and passive smoking) Elevated total or LDL-cholesterol Hypertension (BP 140/90 mm. Hg or on antihypertensive medication) • Low HDL cholesterol (<40 mg/d. L)† • Family history of premature CHD – CHD in male first degree relative <55 years – CHD in female first degree relative <65 years † HDL cholesterol 60 mg/d. L counts as a “negative” risk factor; its presence removes one risk factor from the total count.
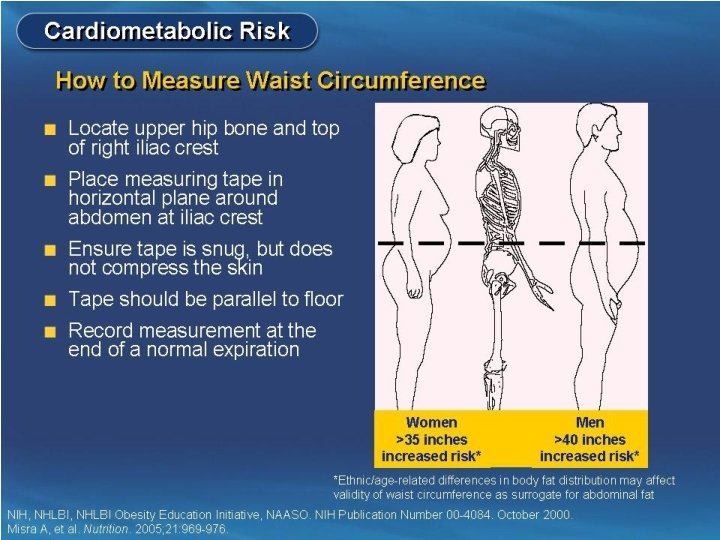
Other Recognized Risk Factors • Obesity: Body Mass Index (BMI) – Weight (kg)/height (m 2) – Weight (lb)/height (in 2) x 703 • Obesity BMI >30 kg/m 2 with overweight defined as 25 -<30 kg/m 2 • Abdominal obesity involves waist circumference >40 in. in men, >35 in. in women • Physical inactivity: most experts recommend at least 30 minutes moderate activity at least 4 -5 days/week • Psychosocial factors: depression, hostility, social isolation, job strain
Six of the top 10 causes of death are lifestyle-related risk factors for cardiovascular disease!
Obesity Trends* Among U. S. Adults: BRFSS - 1985 No Data <10% JAMA 1999; 282: 16, JAMA 2001; 286: 10. 10%-14% 15%-19% 20%-24% 25%-29% >30%
Obesity Trends* Among U. S. Adults: BRFSS - 1991 No Data <10% JAMA 1999; 282: 16, JAMA 2001; 286: 10. 10%-14% 15%-19% 20%-24% 25%-29% >30%
Obesity Trends* Among U. S. Adults: BRFSS - 1997 No Data <10% JAMA 1999; 282: 16, JAMA 2001; 286: 10. 10%-14% 15%-19% 20%-24% 25%-29% >30%
Obesity Trends* Among U. S. Adults: BRFSS - 2001 No Data <10% JAMA 1999; 282: 16, JAMA 2001; 286: 10. 10%-14% 15%-19% 20%-24% 25%-29% >30%
Obesity Trends* Among U. S. Adults: BRFSS - 2008 No Data <10% 10%-14% 15%-19% 20%-24% 25%-29% >30% By 2020, close to 40% of the US adult population is expected to be obese!
Trends in prevalence of overweight among U. S. children and adolescents by age and survey (NHANES, 1971 -74, 1976 -80, 1988 -94 and 2001 -2004). Source: Health, United States, 2006, unpublished data. NCHS.
Intra-abdominal (Visceral) Fat The dangerous inner fat! Front Visceral AT Subcutaneous AT Back
The Metabolic Syndrome Complex Dyslipidemia Endothelial Dysfunction Systemic Inflammation TG, LDL HDL Disordered Fibrinolysis Insulin Resistance Hypertension Type 2 Diabetes Adapted from the ADA. Diabetes Care. 1998; 21: 310 -314; Pradhan AD et al. JAMA. 2001; 286: 327 -334. Atherosclerosis Visceral Obesity
ATP III: The Metabolic Syndrome* Risk Factor Abdominal obesity† (Waist circumference‡) Men Women TG HDL-C Men Women Blood pressure Fasting glucose Defining Level >102 cm (>40 in) >88 cm (>35 in) 150 mg/d. L <40 mg/d. L <50 mg/d. L 130/ 85 mm Hg or on meds ** 110 mg/d. L *Diagnosis is established when 3 of these risk factors are present. †Abdominal obesity is more highly correlated with metabolic risk factors than is BMI. ‡Some men develop metabolic risk factors when circumference is only marginally ; ** new ADA guideline for impaired fasting glucose >=100 mg/dl increased. Expert Panel on Detection, Evaluation, and Treatment of High Blood Cholesterol in Adults. JAMA. 2001; 285: 2486 -2497. © 2001, Professional Postgraduate Services® www. lipidhealth. org
Diagnostic Criteria for Glycemic Abnormalities FPG Hemoglobin A 1 C 2 -Hour PG on OGTT Diabetes Mellitus 126 mg/d. L 7. 0 mmol/L 6. 5% Prediabetes 100 mg/d. L 200 mg/d. L Prediabetes 5. 6 mmol/L 6. 0% Normal 140 mg/d. L Normal Impaired Glucose Tolerance 11. 1 mmol/L 7. 8 mmol/L Normal To convert mg/d. L to mmol/L multiply mg/dl by 0. 055 FPG=Fasting plasma glucose, PG=Plasma glucose, OGTT=Oral glucose tolerance test The Expert Committee on the Diagnosis and Classification of Diabetes Mellitus. Diabetes Care 2001; 24: S 5 -S 20 American Diabetes Association. Diabetes Care 2010; 33: S 11 -61
Cardiovascular Disease (CVD) and Total Mortality: US Men and Women Ages 30 -74 (age, gender, and risk-factor adjusted Cox regression) NHANES II Follow-Up (n=6255)(Malik and Wong, et al. , Circulation Sept 8, 2004) **** ** **** * * p<. 05, ** p<. 01, **** p<. 0001 compared to none
Causes of Mortality in Patients With Diabetes is considered a “risk equivalent” for coronary heart disease
Annual CHD Event Rates (in %) by Calcium Score Events by CAC Categories in Subjects with DM, Met. S, or Neither Disease (Malik and Wong et al. , Diabetes Care 2011) Coronary Heart Disease Coronary Artery Calcium Score ACCF/AHA 2010 Guideline: CAC Scoring for CV risk assessment in asymptomatic adults aged 40 and over with diabetes (Class IIa-B)
Total Cholesterol Distribution: CHD vs Non-CHD Population Framingham Heart Study— 26 -Year Follow-up No CHD 35% of CHD Occurs in People with TC<200 mg/d. L 150 CHD 200 250 300 Total Cholesterol (mg/d. L) Castelli WP. Atherosclerosis. 1996; 124(suppl): S 1 -S 9. 1996 Reprinted with permission from Elsevier Science.
Low HDL-C Levels Increase CHD Risk Even When Total-C Is Normal (Framingham) 11 . 91 11. 24 11 9. 0 0. 7 1 5 6. 6 5. 5 6 6. 5 5 3. 7 7 2 260 230– 259 200– 229 < 200 . 78 2. 0 6 ) 4. 1 5 d. L 7 3 < 40 40– 49 50– 59 60 HDL-C (mg/d. L) l-C (m 4. 6 3. 8 g/ 4. 8 3 ta 14 12 10 8 6 4 2 0 . 50 To 14 -y incidence rates (%) for CHD 12 HDL-C Recommendations: >50 mg/dl women, >40 mg/dl men, optimal HDL-C >60 mg/dl. Castelli WP et al. JAMA 1986; 256: 2835– 2838
Primary and Secondary Prevention Trials With Statins 1° prevention statin 2° prevention statin 1° prevention placebo 2° prevention placebo 30 4 S Event Rate (%) 25 4 S 20 15 HPS 10 CARE LIPID AFCAPS 5 LIPID HPS CARE WOSCOPS AFCAPS 0 80 90 WOSCOPS 100 110 120 130 140 150 160 170 180 190 200 LDL-C Achieved (mg/d. L) Adapted from Ballantyne CM. Am J Cardiol. 1998; 82: 3 Q-12 Q.
NCEP ATP III: LDL-C Goals LDL-cholesterol level CHD or CHD risk equivalents ≥ 2 risk factors 190 Target 160 mg/d. L 160 130 100 <2 risk factors Target 130 mg/d. L Target 100 mg/d. L = 2. 6 mmol/L; 130 mg/d. L = 3. 4 mmol/L; 160 mg/d. L = 4. 1 mmol/L National Cholesterol Education Program, Adult Treatment Panel III, 2001. JAMA 2001: 285; 2486– 2497
Lipid Management Goal: Persons with Pre-existing CHD LDL-C should be less than 100 mg/d. L I IIa IIb III Further reduction to LDL-C to < 70 mg/d. L is reasonable If TG >200 mg/d. L, non-HDL-C should be < 130 mg/d. L* *Non-HDL-C = total cholesterol minus HDL-C
P. Ridker
Relative Risk hs-CRP Adds to Predictive Value of TC: HDL Ratio in Determining Risk of First MI Total Cholesterol: HDL Ratio Ridker et al, Circulation. 1998; 97: 2007– 2011. P R -C s h
4 -Year Progression To Hypertension: The Framingham Heart Study Participants age 36 and older (<120/80 mm (130/85 mm Hg) Vasan, et al. Lancet 2001; 358: 1682 -86 (130 -139/85 -89 mm Hg)
Distribution of Hypertension Subtype in the untreated Hypertensive Population in NHANES III by Age ISH (SBP 140 mm Hg and DBP <90 mm Hg) SDH (SBP 140 mm Hg and DBP 90 mm Hg) IDH (SBP <140 mm Hg and DBP 90 mm Hg) 100 17% 16% <40 40 -49 16% 20% 11% 50 -59 60 -69 Age (y) 70 -79 80+ 80 Frequency of hypertension 60 subtypes in all untreated 40 hypertensives (%) 20 0 Numbers at top of bars represent the overall percentage distribution of untreated hypertension by age. Franklin et al. Hypertension 2001; 37: 869 -874.
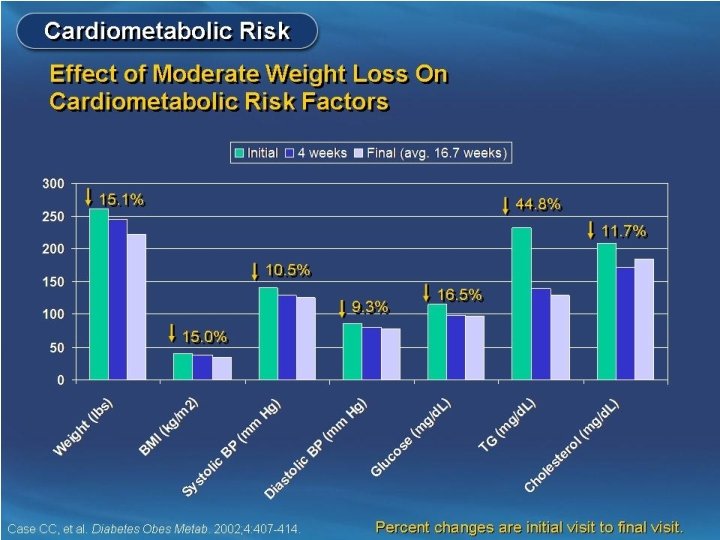
Diabetes Prevention Program: Reduction in Diabetes Incidence
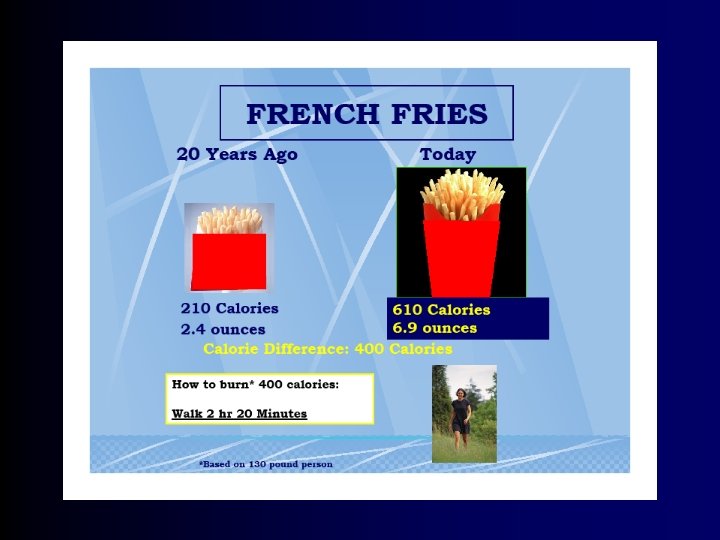
The 2010 Dietary Guidelines 23 Recommendations Jan 31, 2011 • • • Enjoy your food, but eat less. Avoid oversized portions. Make half your plate fruits & vegetables. Switch to fat free or low fat milk (1%). Compare sodium in foods e. g. soup, bread & frozen meals & choose foods with lower numbers. • Drink water instead of sweetened beverages. www. dietaryguidelines. gov
Eight Diet/lifestyle Recommendations Amer Heart Assoc: 2006 1. Balance kcal intake & physical activity to achieve optimal body weight. 2. Consume a high fiber diet rich in fruits & vegetables, legumes & whole grains. 3. Consume fish, especially oily fish at least 2 x /wk.
AHA 2006 Eight Diet & Lifestyle Recommendations 4. Limit saturated fat <7%, trans fat <1%, cholesterol intake<300 mg/d. – Choose lean meat, poultry, fish & vegetarian alternatives – Select fat free, 1% fat or low fat dairy products – Minimize intake of partially hydrogenated fats
AHA 2006 Eight Diet & Lifestyle Recommendations 5. Minimize sugar in food & beverages 6. Choose foods with little or no salt (2011 recommendation: sodium intake <1500 mg/day) 7. If you consume alcohol, use moderation 8. When eating out, use AHA recommendations
Reading Food Labels Be wary of “healthier foods” that advertise containing whole grains but that may also significant amounts of sugar and trans fat (e. g. , partially hydrogenated oils) Always check dietary fiber, fat, and sugar content per serving
Choose whole or multigrain bread, check dietary fiber content
Encourage Increased Physical Activity • Brisk walking is an ideal physical activity for those without orthopedic issues • Walking uses the patient’s increased body weight to increase energy expenditure • Pedometers provide daily feedback - 10, 000 Steps Per Day
Mylifecheck. heart. org
Age-standardized prevalence estimates for poor, intermediate and ideal cardiovascular health for each of the seven metrics of cardiovascular health in the AHA 2020 goals, among US adults >20 years of age, NHANES 2005 -2006 (baseline available data as of January 1, 2010). Fewer than 1% of US adults are at ideal levels for all 7 measures of cardiovascular health! © 2010 American Heart Association, Inc. All rights reserved. Roger VL et al. Published online in Circulation Dec. 15, 2010
UCI Preventive Cardiology Program • • • OC’s only multidisciplinary cardiovascular prevention program Patients meet regularly with cardiologist, dietitian, and exercise physiologist Focus on cardiac risk factor reduction and weight loss through lifestyle modification For persons with and without prior heart disease who have one or more risk factors Specialized biomarker and imaging tests (e. g. , calcium scan) are available Call 714 -456 -6699
Thank You! For more information: www. heart. uci. edu or www. heart. org Email: Nathan D. Wong, Ph. D at: ndwong@uci. edu