MPR 2007 2 070620 Figure 1 Repo rate


- Slides: 104

MPR 2007: 2 070620

Figure 1. Repo rate with uncertainty bands Per cent, quarterly averages Source: The Riksbank

Figure 2. GDP with uncertainty bands Annual percentage change Sources: Statistics Sweden and the Riksbank

Figure 3. CPI with uncertainty bands Annual percentage change Sources: Statistics Sweden and the Riksbank

Figure 4. UND 1 X with uncertainty bands Annual percentage change Sources: Statistics Sweden and the Riksbank

Figure 5. Number of employed Thousands, seasonally adjusted data Note. Broken lines represent the Riksbank's forecast. Sources: Statistics Sweden and the Riksbank

Figure 6. Proportion of open unemployed and total unemployed Percentage of the labour force, seasonally adjusted data Sources: National Labour Market Board, Statistics Sweden and the Riksbank

Figure 7. Different agents' expectations of the rate of wage increase two years ahead Per cent Sources: National Mediation Office and Prospera Research AB

Figure 8. Unit labour costs for the economy as a whole Annual percentage change, seasonally adjusted data Sources: Statistics Sweden and the Riksbank

Figure 9. GDP for the United States and the euro area Quarterly change in per cent, seasonally adjusted data Sources: Bureau of Economic Analysis, Eurostat, and the Riksbank

Figure 10. Swedish export market growth Annual percentage change Note. Broken lines represent the Riksbank's forecast. Sources: National sources and the Riksbank

Figure 11. TCW exchange rate Index, 18 November 1992 = 100 Source: The Riksbank

Figure 12. Household consumption, disposable income and saving ratio Annual percentage change and percentage of disposable income Sources: Statistics Sweden and the Riksbank

Figure 13. General government balance Proportion of GDP Sources: Statistics Sweden and the Riksbank

Figure 14. Government consumption expenditure Annual percentage change, fixed prices Note. Striped bars represent the Riksbank's forecast. Sources: Statistics Sweden and the Riksbank

Figure 15. GDP Quarterly change in per cent, seasonally adjusted data Note. Broken lines represent the Riksbank's forecast. Sources: Statistics Sweden and the Riksbank

Figure 16. CPI and UND 1 X Annual percentage change Note. Broken lines represent the Riksbank's forecast. Sources: Statistics Sweden and the Riksbank

Figure 17. UND 1 X excluding energy Annual percentage change Note. Broken lines represent the Riksbank's forecast. Sources: Statistics Sweden and the Riksbank

Figure 18. UND 1 X at different repo rates Annual percentage change, quarterly averages Note. Broken lines represent the Riksbank's forecast. Sources: Statistics Sweden and the Riksbank

Figure 19. Repo rate forecasts on different occasions Per cent, quarterly averages Note. Broken lines represent the Riksbank's forecast. Source: The Riksbank

Figure 20. Oil price, Brent crude USD per barrel Sources: Intercontinental Exchange and the Riksbank

Table 1. Inflation Annual percentage change Sources: Statistics Sweden and the Riksban

Table 2. Key figures Annual percentage change unless otherwise stated *Excluding PPM (Premium Pension Authority) savings Sources: IMF, Intercontinental Exchange, National Mediation Office, Statistics Sweden and the Riks

Table 3. Repo rate forecast Per cent, quarterly average Source: The Riksbank

Figure 21. Repo rate assumptions Per cent, quarterly averages Note. Broken lines represent the Riksbank's forecast. Sources: The Riksbank

Figure 22. UND 1 X Annual percentage change Note. Broken lines represent the Riksbank's forecast. Sources: Statistics Sweden and the Riksbank

Figure 23. GDP Annual percentage change, seasonally adjusted data Note. Broken lines represent the Riksbank's forecast. Sources: Statistics Sweden and the Riksbank

Figure 24. Number of hours worked Annual percentage change, seasonally adjusted data Note. Broken lines represent the Riksbank's forecast. Sources: Statistics Sweden and the Riksbank

Figure 25. Estimated labour market gaps Percentage deviation from the HP trend Note. Broken lines represent the Riksbank's forecast. Sources: Statistics Sweden and the Riksbank

Figure 26. Estimated output gaps (GDP) Percentage deviation from the HP trend Note. Broken lines represent the Riksbank's forecast. Sources: Statistics Sweden and the Riksbank

Figure 27. Employment rate Per cent Note. Broken lines represent the Riksbank's forecast. Sources: Statistics Sweden and the Riksbank

Figure 28. Open unemployment Percentage of the labour force, seasonally adjusted data Note. Broken lines represent the Riksbank's forecast. Sources: Statistics Sweden and the Riksbank

Figure 29. Nominal wages, overheating scenario Annual percentage change Note. Broken lines represent the Riksbank's forecast. Sources: Statistics Sweden and the Riksbank

Figure 30. UND 1 X, overheating scenario Annual percentage change Note. Broken lines represent the Riksbank's forecast. Sources: Statistics Sweden and the Riksbank

Figure 31. Repo rate, overheating scenario Per cent, quarterly averages Note. Broken lines represent the Riksbank's forecast. Source: The Riksbank

Figure 32. GDP in Sweden and in the scenarios with a weaker supply and weaker demand in the U. S. Annual percentage change Note. Broken lines represent the Riksbank's forecast. Sources: Statistics Sweden and the Riksbank

Figure 33. UND 1 X in Sweden and in the scenarios with a weaker supply and weaker demand in the U. S. Annual percentage change Note. Broken lines represent the Riksbank's forecast. Sources: Statistics Sweden and the Riksbank

Figure 34. Repo rate in Sweden and in the scenarios with a weaker supply and weaker demand in the U. S. Per cent, quarterly averages Note. Broken lines represent the Riksbank's forecast. Source: The Riksbank

Figure 35. GDP Annual percentage change Sources: Eurostat, OECD and the US Department of Commerce

Figure 36. Employment and private consumption in the United States Annual percentage change Sources: Bureau of Labor Statistics and US Department of Commerce

Figure 37. Purchasing managers index in the US Index, unchanged activity = 50 Source: Institute for Supply Management

Figure 38. Confidence indicators for the manufacturing industry in the euro area, France and Germany Balance Source: European Commission

Figure 39. CPI Annual percentage change Source: OECD

Figure 40. Monetary policy expectations in the euro area and the United States Per cent Source: The Riksbank

Figure 41. Implied forward rates Per cent Sources: Prospera Research AB and the Riksbank

Figure 42. Long-term interest rates Per cent Note. Government bonds with approximately 10 years left to maturity. Source: The Riksbank

Figure 43. TCW exchange rate Index, 18 November 1992 = 100 Source: The Riksbank

Figure 44. P/E ratios for the Stockholm Stock Exchange Note. P/E ratios are calculated on expected profits. Sources: JCF and the Riksbank

Figure 45. The money supply Annual percentage change Sources: Statistics Sweden and the Riksbank

Figure 46. House prices and total lending to Swedish households Annual percentage change Note. Quarterly observations of house prices and monthly observations of lending to households. Sources: Statistics Sweden and the Riksbank

Figure 47. GDP, outcomes and the Riksbank's forecast, and forecasts based on indicator models Quarterly changes in per cent, seasonally adjusted data Sources: Statistics Sweden and the Riksbank

Figure 48. Confidence indicators for major industries Seasonally adjusted balance Source: National Institute of Economic Research

Figure 49. Gross fixed capital formation Annual percentage change Source: Statistics Sweden

Figure 50. Foreign trade with goods at fixed prices Annual percentage change, seasonally adjusted data Note. Three-month moving average. Sources: Statistics Sweden and the Riksbank

Figure 51. Household expectations of the future Balance Source: National Institute of Economic Research

Figure 52. Vacancies and redundancy notices Thousands, seasonally adjusted data Note. Three-month moving average. Source: National Labour Market Board

Figure 53. Labour productivity for the economy as a whole Annual percentage change, seasonally adjusted data Sources: Statistics Sweden and the Riksbank

Figure 54. Estimated HP gaps Percentage deviation from HP trend Sources: Statistics Sweden and the Riksbank

Figure 55. Proportion of firms reporting a shortage of labour Per cent, seasonally adjusted data Source: National Institute of Economic Research

Figure 56. Wages in the construction, service and manufacturing sectors Annual percentage change Note. Three-month moving average. Sources: National Mediation Office

Figure 57. Unit labour costs for the economy as a whole Annual percentage change, seasonally adjusted data Sources: Statistics Sweden and the Riksbank

Figure 58. Profits in the business sector according to the National Accounts Percentage of value added Sources: National Institute of Economic Research and Statistics Sweden

Figure 59. Actual inflation (CPI) and households' and companies' expectations of inflation one year ahead Annual percentage change Sources: National Institute of Economic Research and Statistics Sweden

Figure 60. Different agents' expectations of inflation two years ahead Annual percentage change Source: Prospera Research AB

Figure 61. The difference between nominal and inflation-linked five-year rates (break-even inflation) Percentage points Source: The Riksbank

Figure 62. Metal prices and consumer import prices Annual percentage change Sources: IMF and Statistics Sweden

Figure 63. UND 1 X excluding energy, broken down into goods, services and food Annual percentage change Sources: Statistics Sweden and The Riksbank

Figure 64. UND 1 X excluding energy Annual percentage change Sources: Statistics Sweden and the Riksbank

Figure 65. Different measures of underlying inflation Annual percentage change Sources: Statistics Sweden and the Riksbank

Table A 1. Inflation Annual percentage change Sources: Statistics Sweden and the Riksban

Table A 2. Change in CPI compared to change in UND 1 X Annual percentage change and percentage points Note. Due to rounding the contributions may not add up Sources: Statistics Sweden and the Riksban

Table A 3. Interest rates, exchange rates and public finances Per cent, Annual average * Excluding PPM (Premium Pension Authority) savings, per cent of GDP Source: The Riksbank

Table A 4. International conditions Annual percentage change Sources: IMF, Intercontinental Exchange, OECD and the

Table A 5. GDP and GDP by expenditure Annual percentage change Sources: Statistics Sweden and the Riksba

Table A 6. Output, employment and unemployment Annual percentage change *Calendar-adjusted Sources: National Labour Market Board, Statistics Sweden and the Riksban

Table A 7. Wages, productivity and labour costs for the economy as a whole Annual percentage change, calendar-adjusted data Note. Due to rounding the contributions may not add up Sources: National Mediation Office, Statistics Sweden and the Riksb

Table A 8. Expected inflation according to various surveys Per cent, average Note. Results from the previous survey in January 2007 are given in parentheses unless otherwise stated. Most recent survey from May 2007 unless otherwise stated. Sources: National Institute of Economic Research and Prospera Research

Table A 9. Repo rate Per cent, annual average Source: The Riksbank

Table A 10. UND 1 X Annual percentage change Sources: Statistics Sweden and the Riksban

Table A 11. GDP Annual percentage change, calendar-adjusted data Sources: Statistics Sweden and the Riksban

Table A 12. Hours worked Annual percentage change, calendar-adjusted data Sources: Statistics Sweden and the Riksba

Table A 13. Open unemployment Per cent of labour force Sources: Statistics Sweden and the Riksban

Table A 14. Nominal wage Annual percentage change Sources: Statistics Sweden and the Riksba

Table A 15. Hours worked Annual percentage change Sources: Statistics Sweden and the Riksban

Table A 16. GDP Annual percentage change, calendar-adjusted data Sources: Statistics Sweden and the Riksban

Table A 17. UND 1 X Annual percentage change Sources: Statistics Sweden and the Riksban

Table A 18. Repo rate Per cent, annual average Source: The Riksbank

Table A 19. TCW-weighted countries: Deviations from the main scenario, spread in percentage points Annual percentage change, annual average Source: The Riksbank

Figure B 1. The number of employees whose agreements expire in this/these month(s) in 2007 Thousands Source: National Mediation Office

Figure B 2. Total wage increases, centrally agreed wage increases according to the National Mediation Office's calculations and wage increases outside the scope of the agreement for the entire economy Annual percentage change Sources: National Mediation Office, Statistics Sweden and the Riksbank

Table B 1. Expected agreement outcomes based on the industrial norm and agreement outcomes to date in the agreement areas of the Swedish Trade Union Confederation (LO) Sources: Social Partners, the Swedish Trade Union Confederation, Statistics Sweden and the

Table. B 2 Agreed levels in a sample of agreements concluded to date during the 2007 wage bargaining rounds Sources: Social partners, LO-tidningen and the

Figure B 3. Actual and trend labour productivity for the economy as a whole Annual percentage change, seasonally adjusted data Sources: Statistics Sweden and the Riksbank

Figure B 4. Contributions to labour productivity growth for the economy as a whole Percentage points Source: M. P. Timmer, G. Ypma and B. van Ark (2003)

Figure B 5. Average productivity growth 2001 -2005 in a sample of OECD countries Annual percentage change Source: OECD Productivity Database, September 2006

Figure B 6. Proportion of firms reporting a shortage of labour Per cent, seasonally adjusted data Source: National Institute of Economic Research

Figure B 7. Beveridge curve 1980 -2006 Sources: The National Labour Market Board and Statistics Sweden

Figure B 8. New vacancies and unfilled vacancies Thousands, seasonally adjusted data Note. Three-month moving average. Source: The National Labour Market Board

Figure B 9. Job openings and vacancies in the private sector Thousands, seasonally adjusted data Source: Statistics Sweden

Figure B 10. Recruitment rate in the private sector Per cent, seasonally adjusted data Source: Statistics Sweden

Figure B 11. Vacancy rate in the private sector Per cent, seasonally adjusted data Source: Statistics Sweden

Figure B 12. Average recruitment time in the private sector Months, seasonally adjusted data Source: Statistics Sweden

Figure B 13. Open unemployment, total unemployment and full-time students who have looked for work Thousands, seasonally adjusted data Sources: National Labour Market Board and Statistics Sweden

Figure B 14. Proportion of unemployed young people and long-term unemployed in relation to total unemployment Per cent, seasonally adjusted data Source: National Labour Market Board
 Repo rate formula
 Repo rate definition
 Repo
Repo Private suse repository
 Callie wall
 Multiplicator monetar
 Gesamtbanksteuerung vorlesung
 50 repo
 Rami aboul naga
 Mpr marketing
 Mpr
Mpr Perbedaan cpr dan mpr
 Visi misi mpr
 Mrp 1 in operations management
 Mpr jaaroverzicht
 Taktik mpr
 Thomas l harris marketing public relations
 Mpr monthly report
 Marketing public relations (mpr)
 What is mpr in marketing
 Mip mpr
 Ricostruzioni multiplanari
 Bsk koe
 Mpr project
 Taktik mpr
 Tc mpr
 Reactive mpr
 Marketing public relations (mpr)
 Insemineren koe
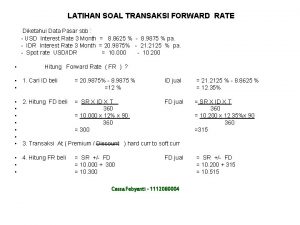
 Contoh transaksi forward
 Cap rate interest rate relationship
 Difference between rate and unit rate
 Real exchange rate vs nominal exchange rate
 Real vs nominal interest rate
 Oas spread
 What is growth analysis
 Spot rate and forward rate
 Abcye
Abcye Washing machine solid or plane figure
 An operation that maps an original figure called the
 How to work out 6 figure grid references
 2007-1945
 Keputusan menteri pupr no 1044/kpts/m/2018
 W 2007 r przeciętny polak zjada około 40 kg owoców
 12 nin çeyreği
 Keeleteadlane 1919-2007
 Monitor 9 2007
 Owasp top 10 2007
 Bs 25999-2:2007
 2007 greek forest fires
 Kdnf 2007
 Office project 2007
 Dau 2007
 Calculated field access 2007
 Calendario mayo 2007
 T. trimpe 2007 http //sciencespot.net/
 Sale of goods and supply of services act 1980
 Hisd 2007 bond
 2007-1953
 Goal seek automates the trial-and-error
 2007 ce english paper 2
 Solver
 2007 dat
 Gradiente excel
 Xxxxxxx 22
 Sustainable communities act 2007
 Ose exe
 Iajr
Iajr Microsoft decision tree
 Ms word 2010 view tab
 Medicare set-aside flow chart
 2007 office system
 Tutorial project 2007
 Lei 171 de 2007
 Raja hasan saregamapa 2007
 Ray winstone beowulf
 Visio 2007
 Procurement act 2007
 Boardworks ltd 2007
 Thomson higher education 2007
 Decreto 2870 de 2007
 Bs 1192:2007
 Autocad electrical 2007
 Tarikh puasa 2007
 Sinionimi
 Tugas suruhanjaya reid
 Office groove 2007
 What is the mental health act 2007
 Lær excel 2007
 4/8/2007
 Decreto 197/2007
 Decreto 231 del 2007
 Fathers day 2007
 Power failure by andrew forster
 Ipcc 2007 report
 Inpc 2007
 Word 2003 to 2007
 Ive porkon
 Iso 17025 laboratory management system
 Virtual pc 2007
 Standard toolbar in ms word 2013
 Webaccess lm
 Maturita 2006
 Biosafety act 2007
 28 september 2007 hari apa


