Kari Alanne Heating and Cooling Systems EENE 4002

- Slides: 75
© Kari Alanne Heating and Cooling Systems EEN-E 4002 (5 cr) Introduction: Need of heating and cooling Theoretical principles and tools
Learning objectives Student will learn to • know the significance of heating and cooling in terms of economics, indoor climate and the energy use of buildings • know climatic factors behind heating and cooling demand • understand the fundamentals of incompressible fluid mechanics and heat transfer in the context of building energy systems • apply the aforementioned theories to calculate flow rates, pressure losses and heat transfer in the above context
Lesson outline 1. 2. 3. 4. 5. 6. 7. Significance of heating and cooling Climatic factors behind heating and cooling demand Fundamentals of fluid flow Conservation laws Energy and mass balances for open system Bernoulli and continuity equations Fundamentals of heat transfer
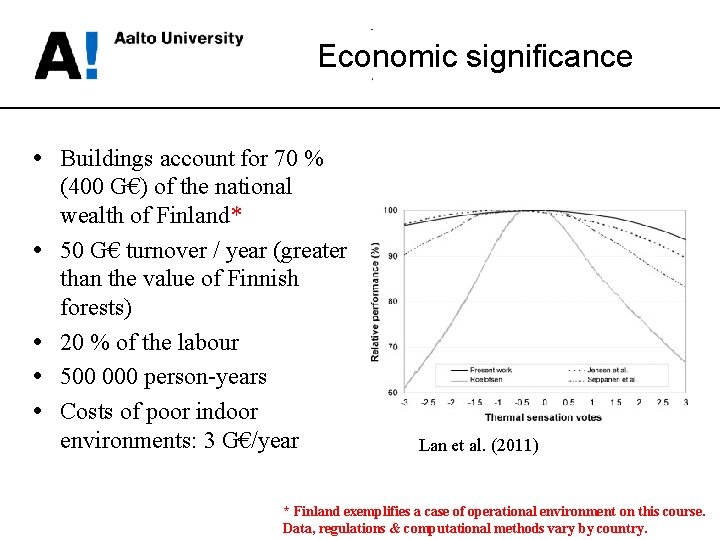
Economic significance • Buildings account for 70 % • • (400 G€) of the national wealth of Finland* 50 G€ turnover / year (greater than the value of Finnish forests) 20 % of the labour 500 000 person-years Costs of poor indoor environments: 3 G€/year Lan et al. (2011) * Finland exemplifies a case of operational environment on this course. Data, regulations & computational methods vary by country.
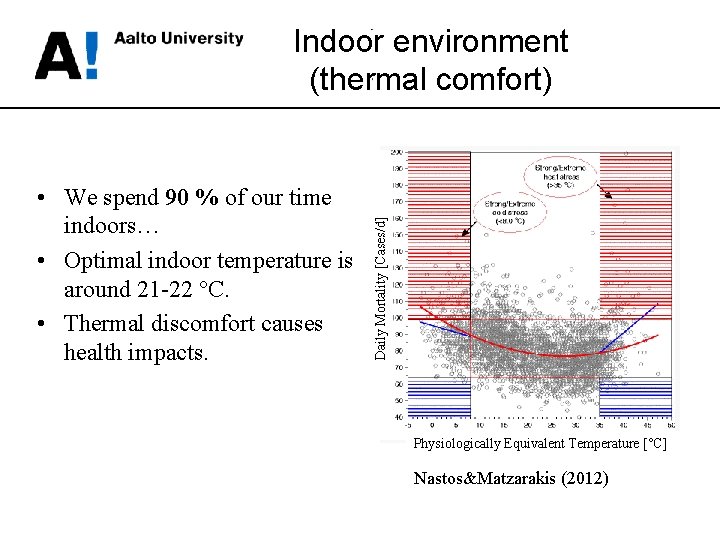
• We spend 90 % of our time indoors… • Optimal indoor temperature is around 21 -22 °C. • Thermal discomfort causes health impacts. Daily Mortality [Cases/d] Indoor environment (thermal comfort) Physiologically Equivalent Temperature [°C] Nastos&Matzarakis (2012)
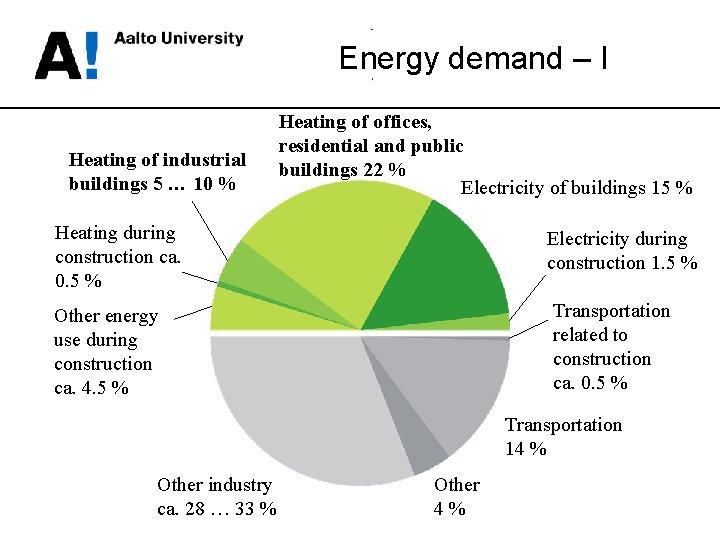
Energy demand – I Heating of industrial buildings 5 … 10 % Heating of offices, residential and public buildings 22 % Electricity of buildings 15 % Heating during construction ca. 0. 5 % Electricity during construction 1. 5 % Transportation related to construction ca. 0. 5 % Other energy use during construction ca. 4. 5 % Transportation 14 % Other industry ca. 28 … 33 % Other 4%
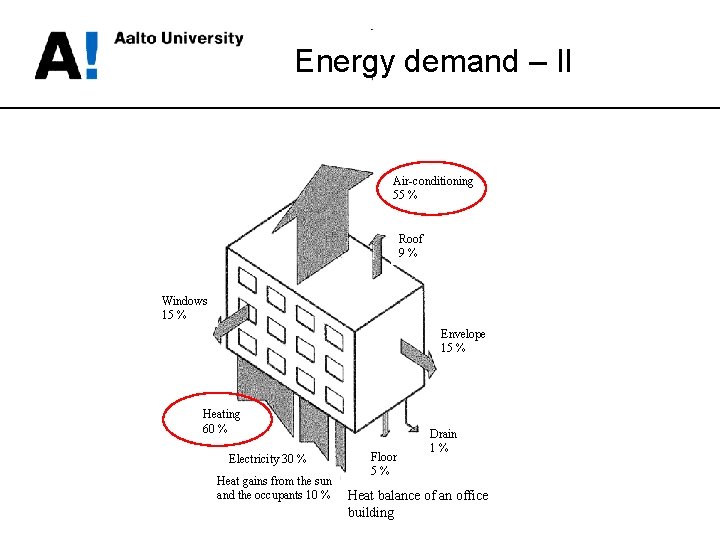
Energy demand – II Air-conditioning 55 % Roof 9% Windows 15 % Envelope 15 % Heating 60 % Electricity 30 % Heat gains from the sun and the occupants 10 % Floor 5% Drain 1% Heat balance of an office building
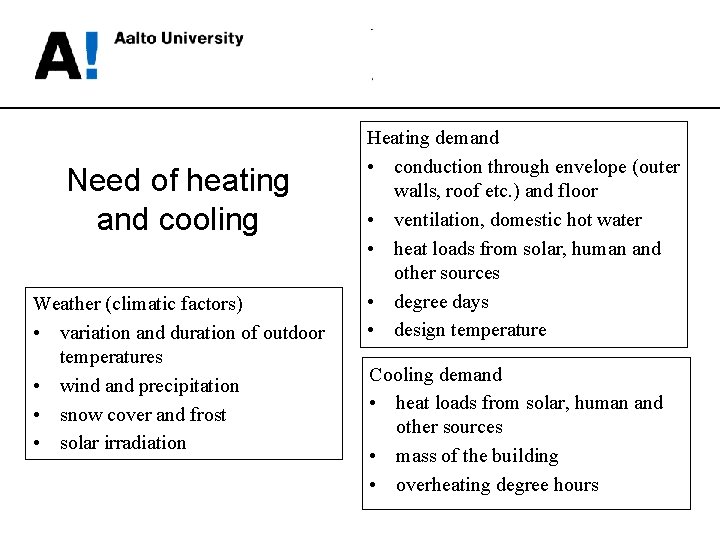
Need of heating and cooling Weather (climatic factors) • variation and duration of outdoor temperatures • wind and precipitation • snow cover and frost • solar irradiation Heating demand • conduction through envelope (outer walls, roof etc. ) and floor • ventilation, domestic hot water • heat loads from solar, human and other sources • degree days • design temperature Cooling demand • heat loads from solar, human and other sources • mass of the building • overheating degree hours
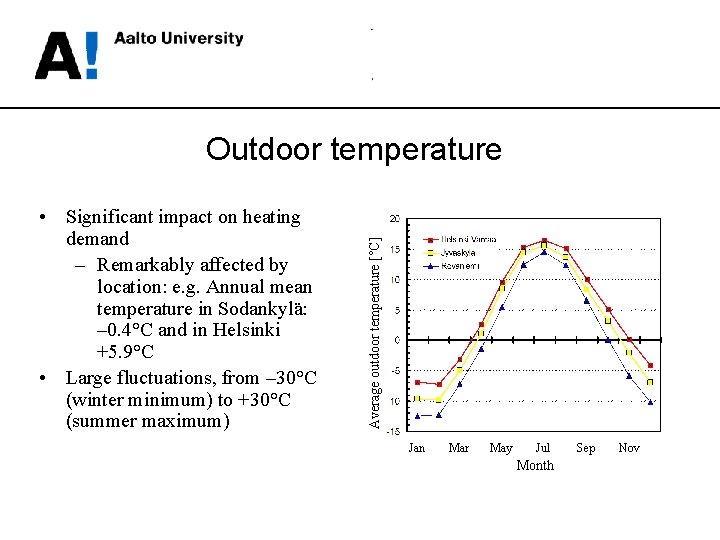
• Significant impact on heating demand – Remarkably affected by location: e. g. Annual mean temperature in Sodankylä: – 0. 4°C and in Helsinki +5. 9°C • Large fluctuations, from – 30°C (winter minimum) to +30°C (summer maximum) Average outdoor temperature [°C] Outdoor temperature Jan Mar May Jul Month Sep Nov
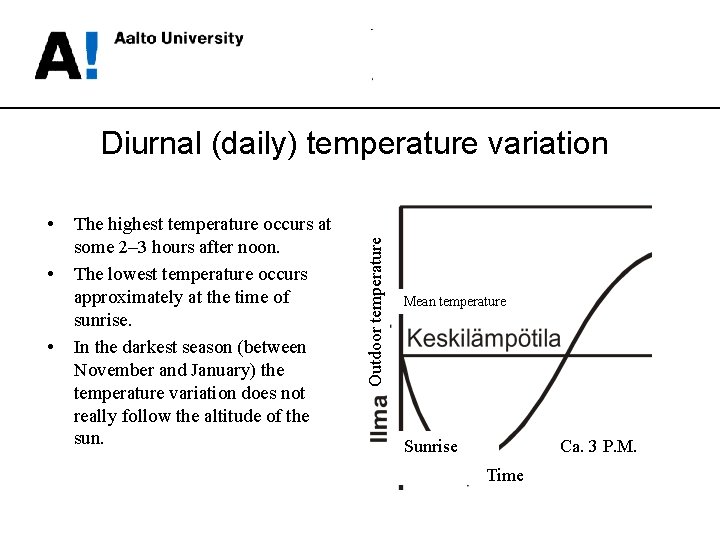
• • • The highest temperature occurs at some 2– 3 hours after noon. The lowest temperature occurs approximately at the time of sunrise. In the darkest season (between November and January) the temperature variation does not really follow the altitude of the sun. Outdoor temperature Diurnal (daily) temperature variation Mean temperature Sunrise Ca. 3 P. M. Time
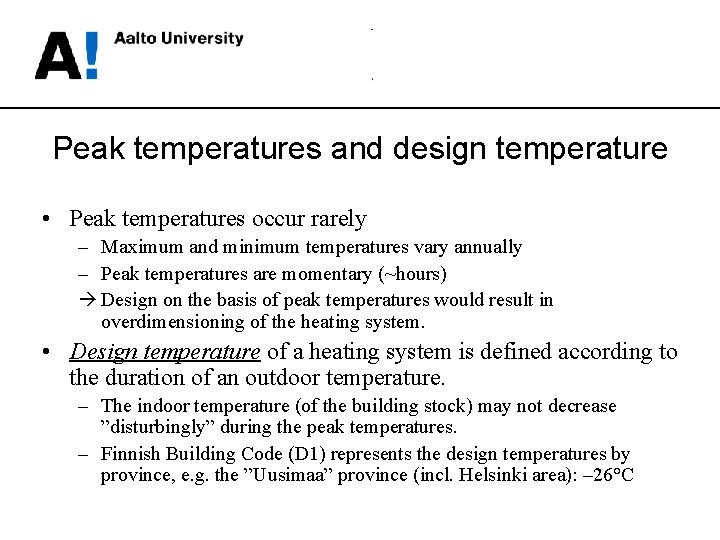
Peak temperatures and design temperature • Peak temperatures occur rarely – Maximum and minimum temperatures vary annually – Peak temperatures are momentary (~hours) à Design on the basis of peak temperatures would result in overdimensioning of the heating system. • Design temperature of a heating system is defined according to the duration of an outdoor temperature. – The indoor temperature (of the building stock) may not decrease ”disturbingly” during the peak temperatures. – Finnish Building Code (D 1) represents the design temperatures by province, e. g. the ”Uusimaa” province (incl. Helsinki area): – 26°C
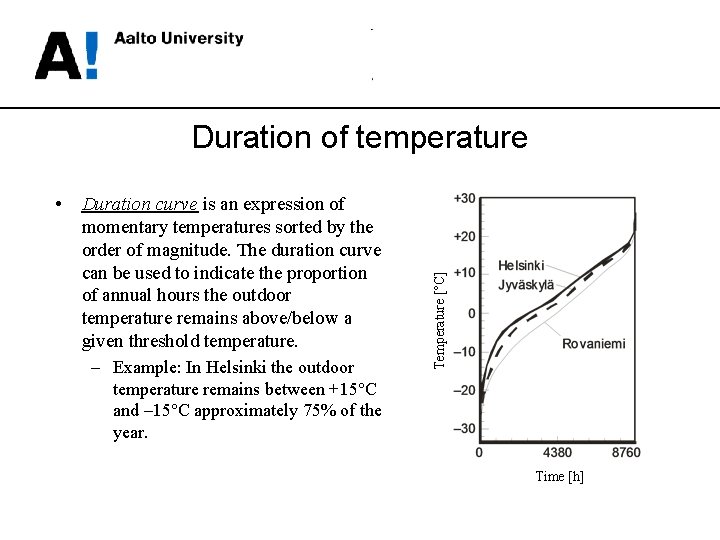
• Duration curve is an expression of momentary temperatures sorted by the order of magnitude. The duration curve can be used to indicate the proportion of annual hours the outdoor temperature remains above/below a given threshold temperature. – Example: In Helsinki the outdoor Temperature [°C] Duration of temperature remains between +15°C and – 15°C approximately 75% of the year. Time [h]
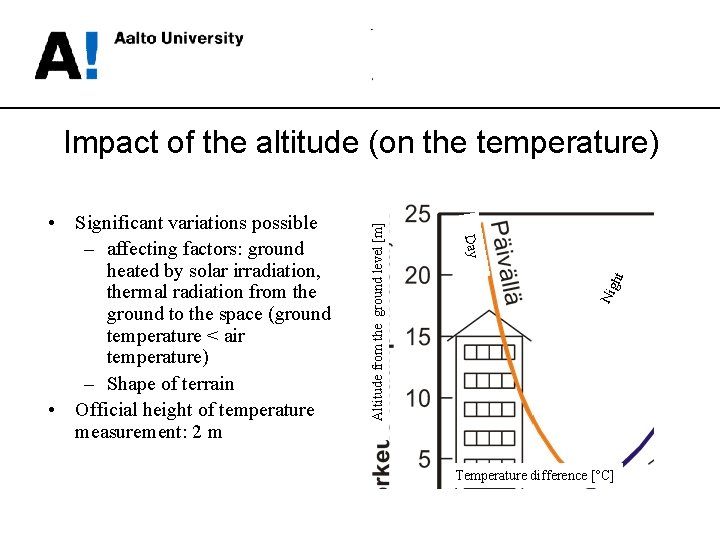
Nig ht Day • Significant variations possible – affecting factors: ground heated by solar irradiation, thermal radiation from the ground to the space (ground temperature < air temperature) – Shape of terrain • Official height of temperature measurement: 2 m Altitude from the ground level [m] Impact of the altitude (on the temperature) Temperature difference [°C]
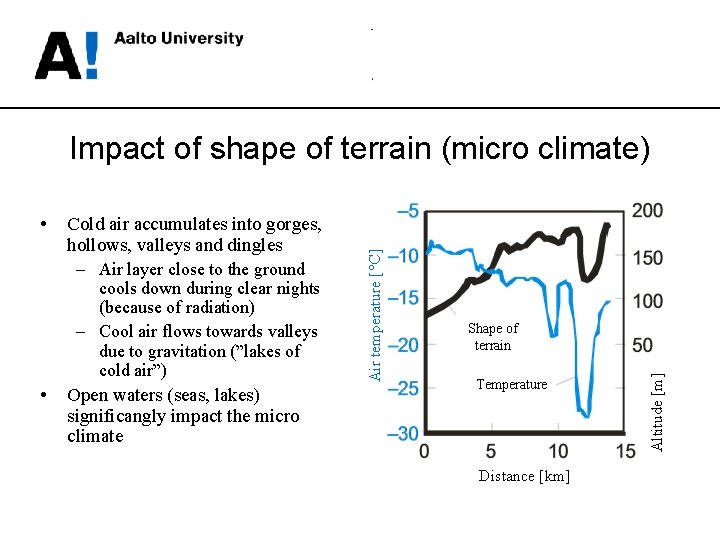
Cold air accumulates into gorges, hollows, valleys and dingles – Air layer close to the ground cools down during clear nights (because of radiation) – Cool air flows towards valleys due to gravitation (”lakes of cold air”) • Open waters (seas, lakes) significangly impact the micro climate Shape of terrain Temperature Distance [km] Altitude [m] • Air temperature [°C] Impact of shape of terrain (micro climate)
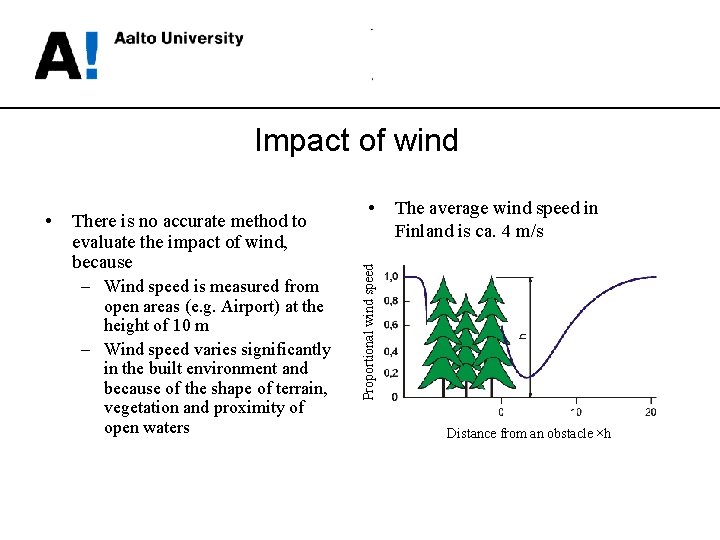
Impact of wind There is no accurate method to evaluate the impact of wind, because – Wind speed is measured from open areas (e. g. Airport) at the height of 10 m – Wind speed varies significantly in the built environment and because of the shape of terrain, vegetation and proximity of open waters • The average wind speed in Finland is ca. 4 m/s Proportional wind speed • Distance from an obstacle ×h
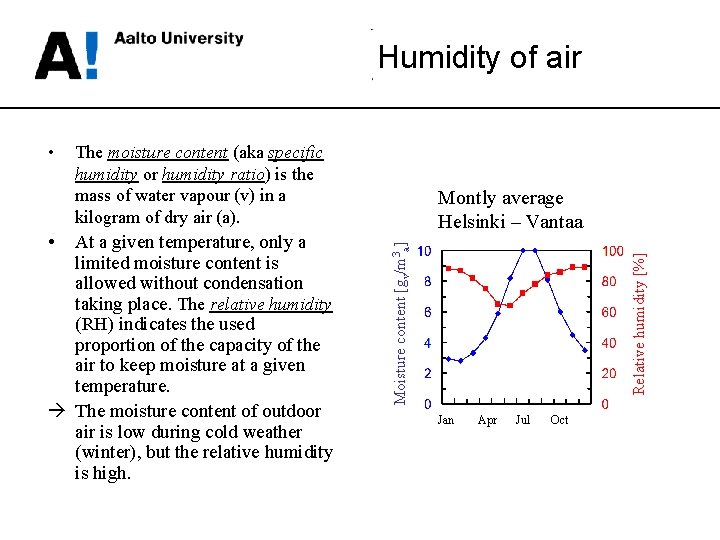
Humidity of air At a given temperature, only a limited moisture content is allowed without condensation taking place. The relative humidity (RH) indicates the used proportion of the capacity of the air to keep moisture at a given temperature. à The moisture content of outdoor air is low during cold weather (winter), but the relative humidity is high. Montly average Helsinki – Vantaa Relative humidity [%] • The moisture content (aka specific humidity or humidity ratio) is the mass of water vapour (v) in a kilogram of dry air (a). Moisture content [gv/m 3 a] • Jan Apr Jul Oct
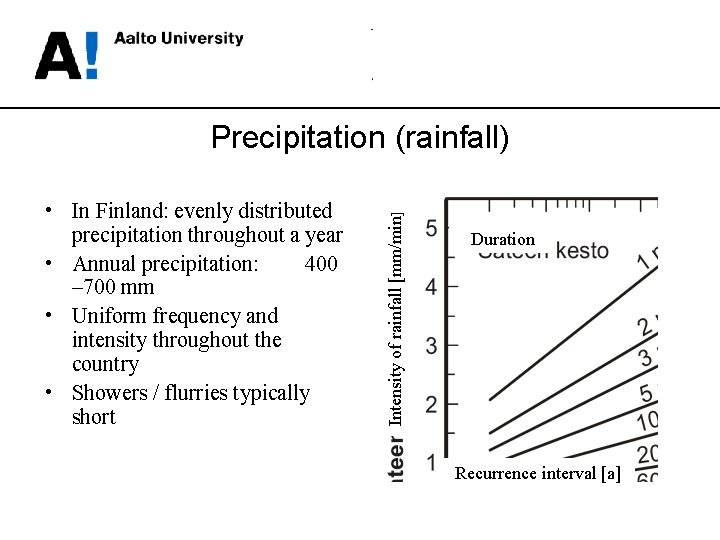
• In Finland: evenly distributed precipitation throughout a year • Annual precipitation: 400 – 700 mm • Uniform frequency and intensity throughout the country • Showers / flurries typically short Intensity of rainfall [mm/min] Precipitation (rainfall) Duration Recurrence interval [a]
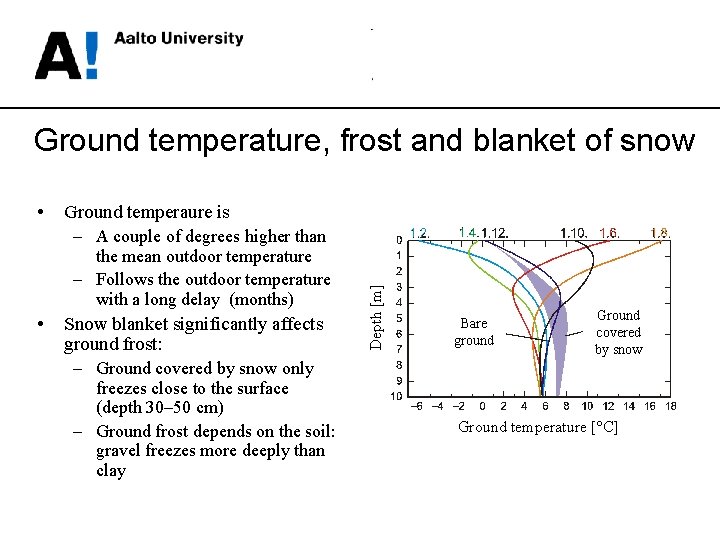
Ground temperature, frost and blanket of snow Ground temperaure is – A couple of degrees higher than the mean outdoor temperature – Follows the outdoor temperature with a long delay (months) • Snow blanket significantly affects ground frost: – Ground covered by snow only freezes close to the surface (depth 30– 50 cm) – Ground frost depends on the soil: gravel freezes more deeply than clay Depth [m] • Bare ground Ground covered by snow Ground temperature [°C]
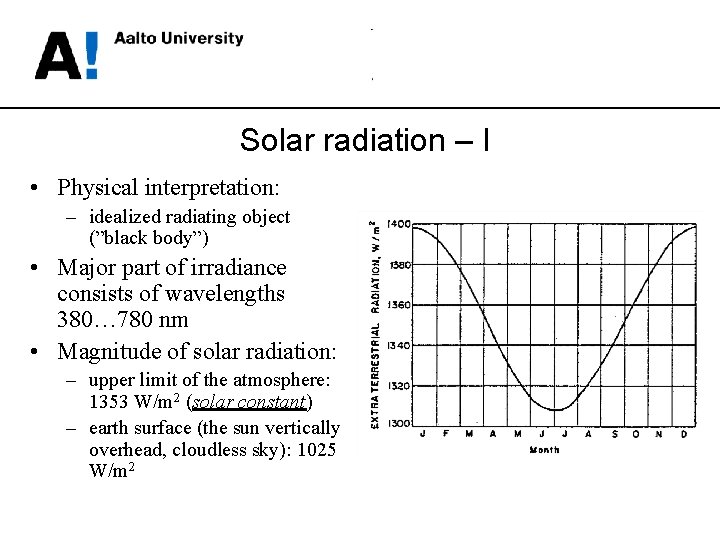
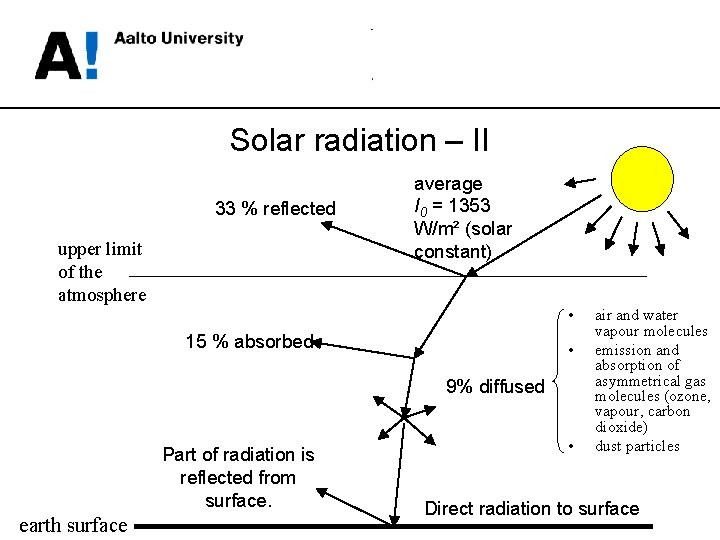
Solar radiation – I • Physical interpretation: – idealized radiating object (”black body”) • Major part of irradiance consists of wavelengths 380… 780 nm • Magnitude of solar radiation: – upper limit of the atmosphere: 1353 W/m 2 (solar constant) – earth surface (the sun vertically overhead, cloudless sky): 1025 W/m 2
Solar radiation – II 33 % reflected upper limit of the atmosphere average I 0 = 1353 W/m² (solar constant) • 15 % absorbed • 9% diffused Part of radiation is reflected from surface. earth surface • air and water vapour molecules emission and absorption of asymmetrical gas molecules (ozone, vapour, carbon dioxide) dust particles Direct radiation to surface
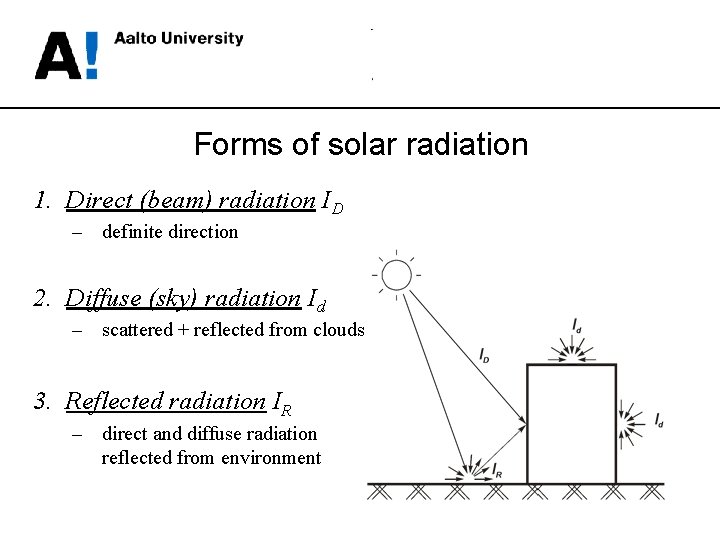
Forms of solar radiation 1. Direct (beam) radiation ID – definite direction 2. Diffuse (sky) radiation Id – scattered + reflected from clouds 3. Reflected radiation IR – direct and diffuse radiation reflected from environment
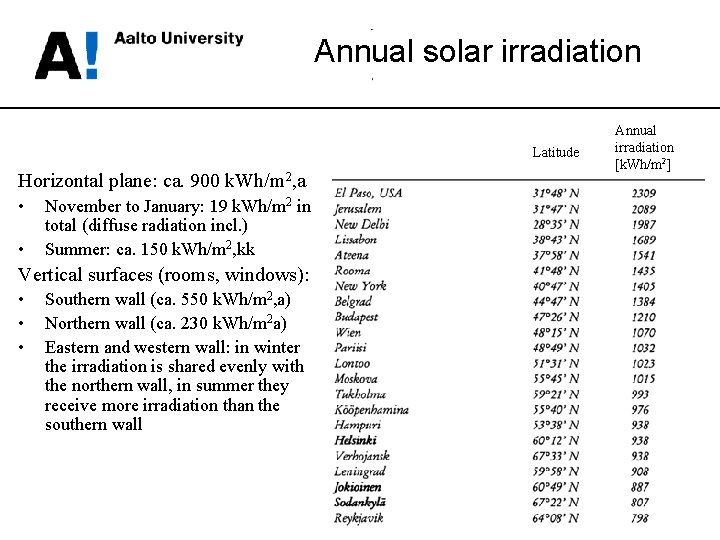
Annual solar irradiation Latitude Horizontal plane: ca. 900 k. Wh/m 2, a • • November to January: 19 k. Wh/m 2 in total (diffuse radiation incl. ) Summer: ca. 150 k. Wh/m 2, kk Vertical surfaces (rooms, windows): • • • Southern wall (ca. 550 k. Wh/m 2, a) Northern wall (ca. 230 k. Wh/m 2 a) Eastern and western wall: in winter the irradiation is shared evenly with the northern wall, in summer they receive more irradiation than the southern wall Annual irradiation [k. Wh/m 2]
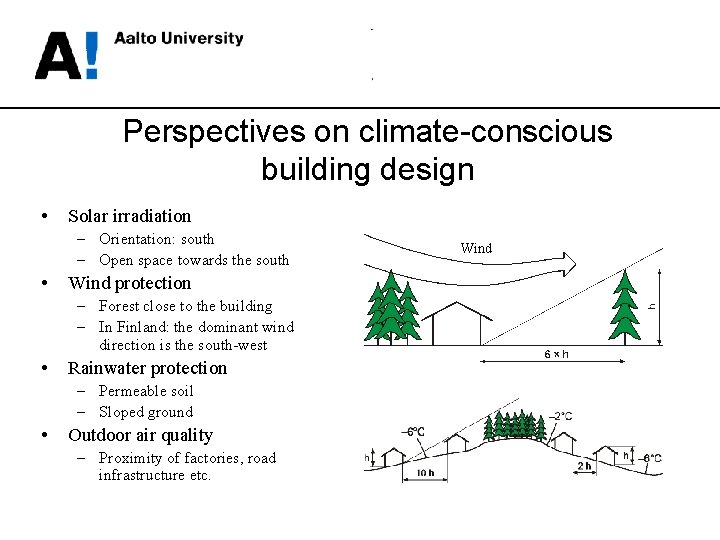
Perspectives on climate-conscious building design • Solar irradiation – Orientation: south – Open space towards the south • Wind protection – Forest close to the building – In Finland: the dominant wind direction is the south-west • Rainwater protection – Permeable soil – Sloped ground • Outdoor air quality – Proximity of factories, road infrastructure etc. Wind
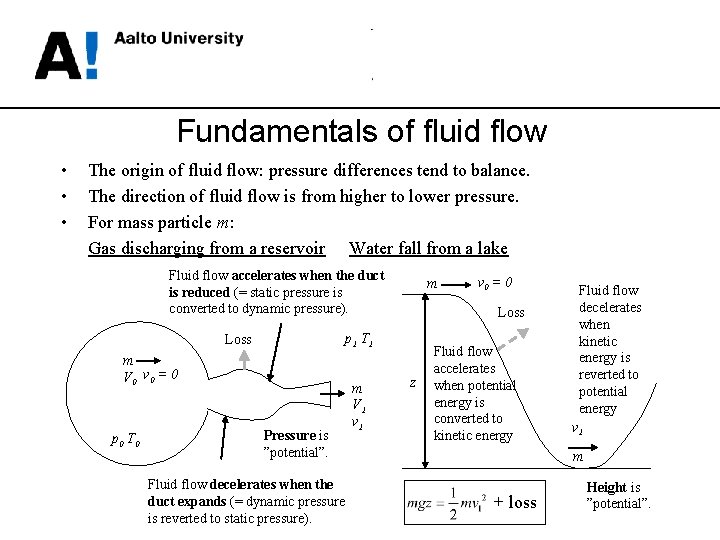
Fundamentals of fluid flow • • • The origin of fluid flow: pressure differences tend to balance. The direction of fluid flow is from higher to lower pressure. For mass particle m: Gas discharging from a reservoir Water fall from a lake Fluid flow accelerates when the duct is reduced (= static pressure is converted to dynamic pressure). m V 0 v 0 = 0 Pressure is ”potential”. Fluid flow decelerates when the duct expands (= dynamic pressure is reverted to static pressure). m V 1 v 0 = 0 Loss p 1 T 1 Loss p 0 T 0 m z Fluid flow accelerates when potential energy is converted to kinetic energy Fluid flow decelerates when kinetic energy is reverted to potential energy v 1 m + loss Height is ”potential”.
Definitions • Static pressure is the force per unit area normal to a surface at any point on any plane in a fluid at rest (=p) • Dynamic pressure (aka velocity pressure) is the kinetic energy per unit volume of a fluid particle in a flowing fluid (= ½ ρv 2). • Hydrostatic pressure is the pressure exerted by a fluid at equilibrium at a given point within the fluid, due to the force of gravity (= ρgz). • Total pressure is the sum of static, dynamic and hydrostatic pressures (see: the left side of the Bernoulli equation). • Absolute pressure is the pressure zero-referenced against a perfect vacuum. • Gauge pressure is the pressure zero-referenced against the local atmospheric pressure. • Datum (zero-referenced elevation) can be established case by case, e. g. at the lowest elevation of the target system or at the sea level. • Flow rate is the mass or volume of fluid which passes through a predefined cross-section per given time.
Pressures • Atmospheric pressure: – Sea level: 101325 Pa • Selected pressures in heating and piping technology: – – – District heating (primary): City water: Cold water distribution system: Pressure difference over a radiator valve: Pressure drop of a heat distribution network: +1. 5 Mpa (15 bar) (max. ) +300 k. Pa +200. . . 250 k. Pa 2. . . 4 k. Pa > 10 k. Pa
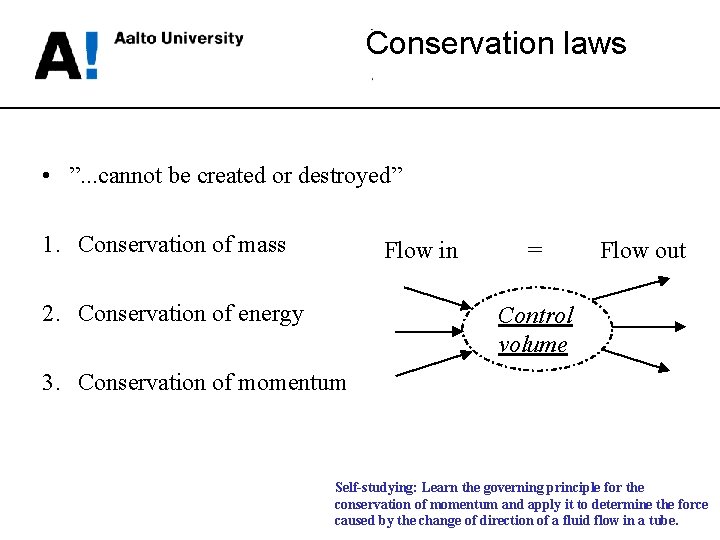
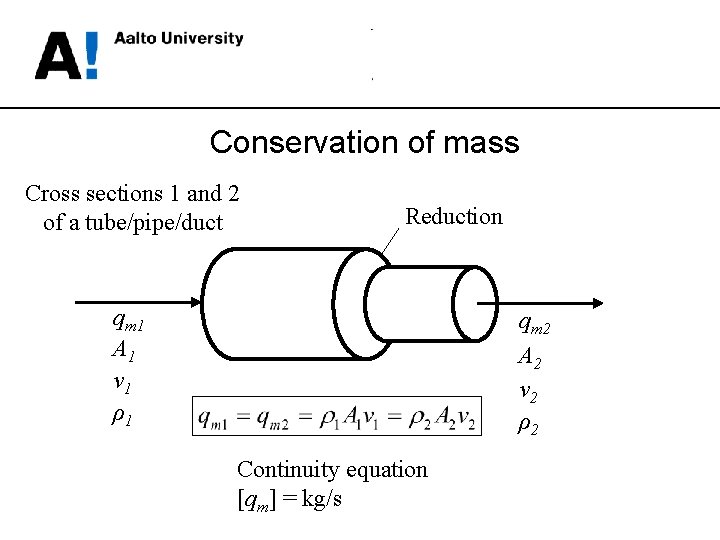
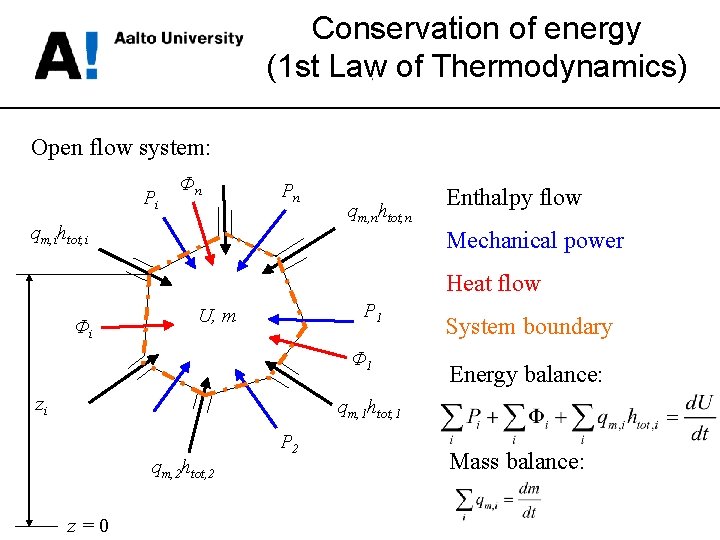
Conservation laws • ”. . . cannot be created or destroyed” 1. Conservation of mass Flow in 2. Conservation of energy = Flow out Control volume 3. Conservation of momentum Self-studying: Learn the governing principle for the conservation of momentum and apply it to determine the force caused by the change of direction of a fluid flow in a tube.
Conservation of mass Cross sections 1 and 2 of a tube/pipe/duct Reduction qm 1 A 1 v 1 ρ1 qm 2 A 2 v 2 ρ2 Continuity equation [qm] = kg/s
Conservation of energy (1 st Law of Thermodynamics) Open flow system: Pi Φn Pn qm, ihtot, i qm, nhtot, n Enthalpy flow Mechanical power Heat flow Φi P 1 U, m Φ 1 zi System boundary Energy balance: qm, 1 htot, 1 qm, 2 htot, 2 z=0 P 2 Mass balance:
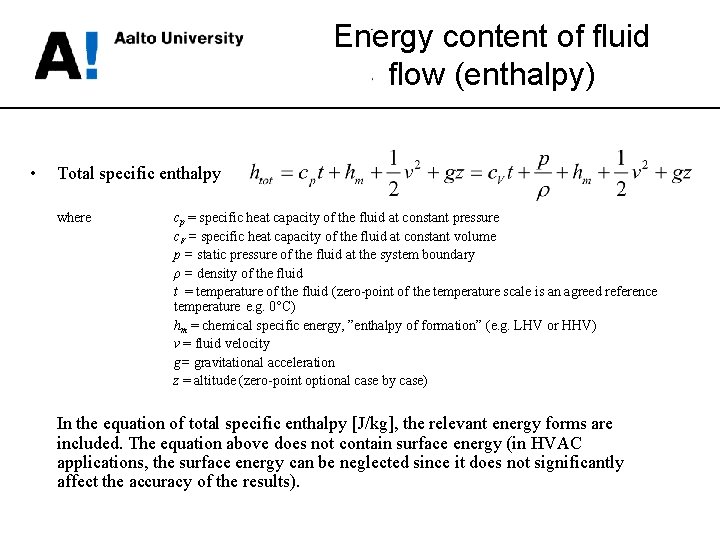
Energy content of fluid flow (enthalpy) • Total specific enthalpy where cp = specific heat capacity of the fluid at constant pressure c. V = specific heat capacity of the fluid at constant volume p = static pressure of the fluid at the system boundary ρ = density of the fluid t = temperature of the fluid (zero-point of the temperature scale is an agreed reference temperature e. g. 0°C) hm = chemical specific energy, ”enthalpy of formation” (e. g. LHV or HHV) v = fluid velocity g= gravitational acceleration z = altitude (zero-point optional case by case) In the equation of total specific enthalpy [J/kg], the relevant energy forms are included. The equation above does not contain surface energy (in HVAC applications, the surface energy can be neglected since it does not significantly affect the accuracy of the results).
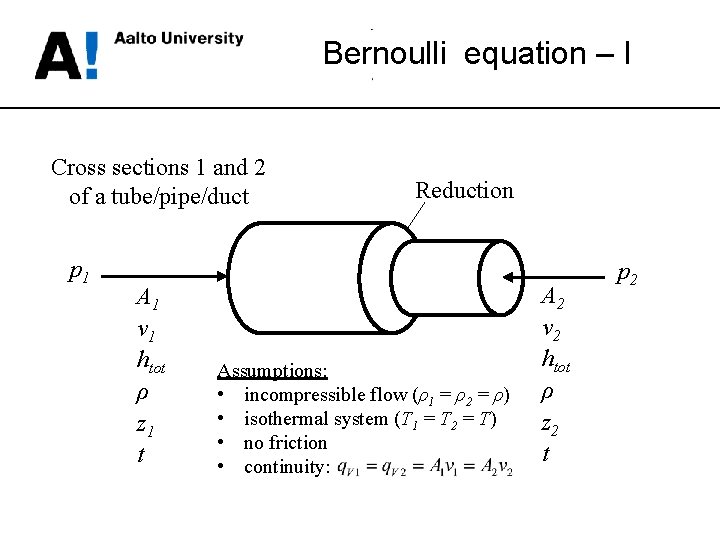
Bernoulli equation – I Cross sections 1 and 2 of a tube/pipe/duct p 1 A 1 v 1 htot ρ z 1 t Reduction Assumptions: • incompressible flow (ρ1 = ρ2 = ρ) • isothermal system (T 1 = T 2 = T) • no friction • continuity: A 2 v 2 htot ρ z 2 t p 2
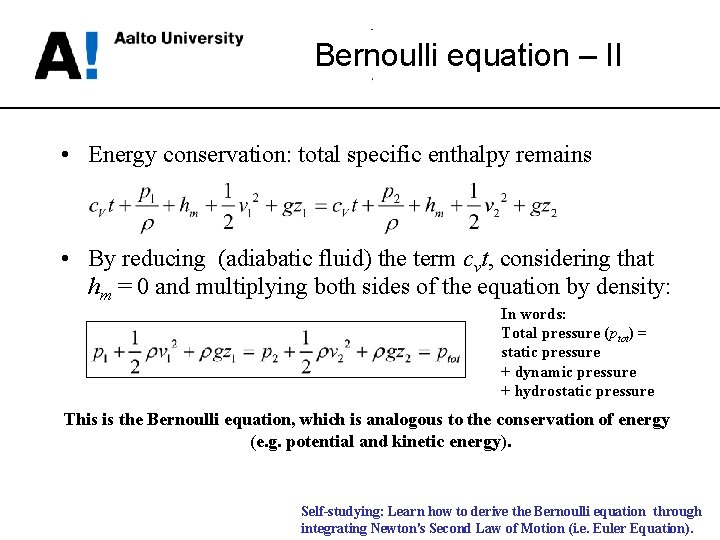
Bernoulli equation – II • Energy conservation: total specific enthalpy remains • By reducing (adiabatic fluid) the term cvt, considering that hm = 0 and multiplying both sides of the equation by density: In words: Total pressure (ptot) = static pressure + dynamic pressure + hydrostatic pressure This is the Bernoulli equation, which is analogous to the conservation of energy (e. g. potential and kinetic energy). Self-studying: Learn how to derive the Bernoulli equation through integrating Newton's Second Law of Motion (i. e. Euler Equation).
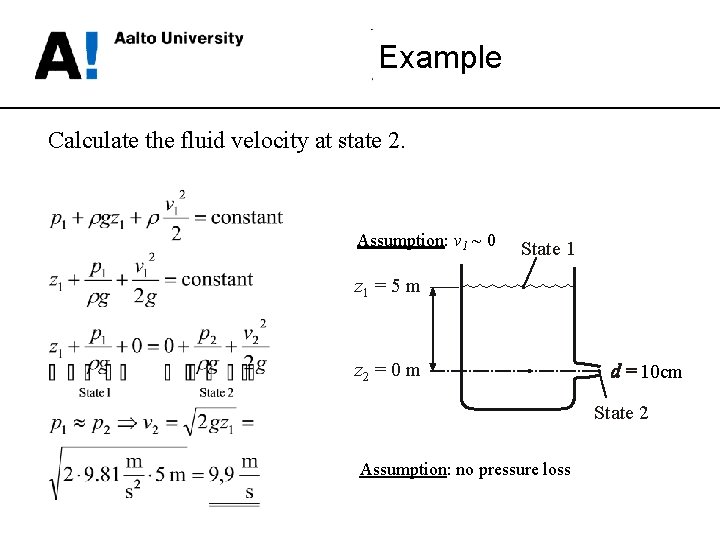
Example Calculate the fluid velocity at state 2. Assumption: v 1 ~ 0 State 1 z 1 = 5 m z 2 = 0 m 10 cm State 2 Assumption: no pressure loss
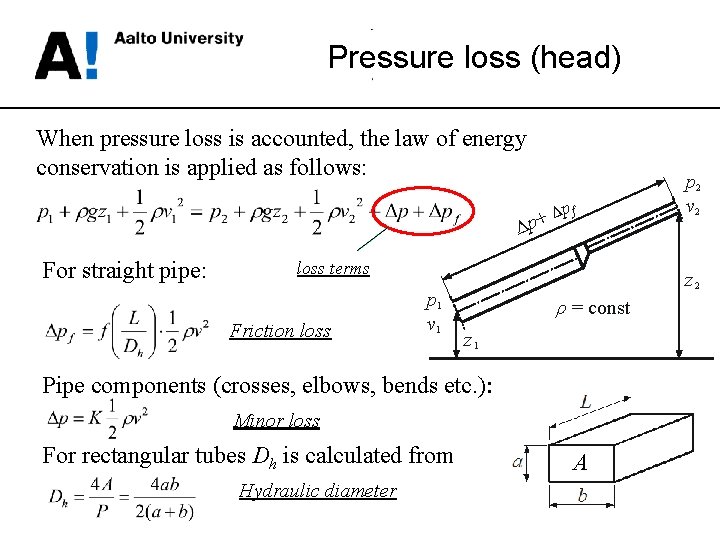
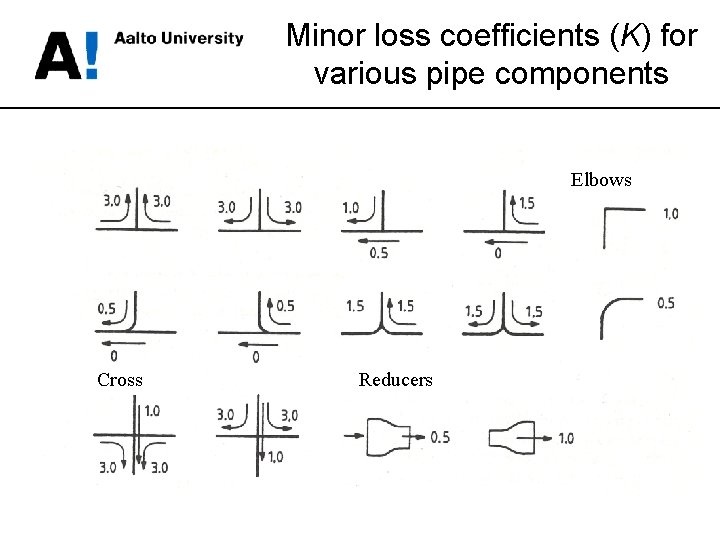
Pressure loss (head) When pressure loss is accounted, the law of energy conservation is applied as follows: Δ + p Δ For straight pipe: pf loss terms Friction loss p 1 v 1 z 2 ρ = const z 1 Pipe components (crosses, elbows, bends etc. ): Minor loss For rectangular tubes Dh is calculated from Hydraulic diameter p 2 v 2 A
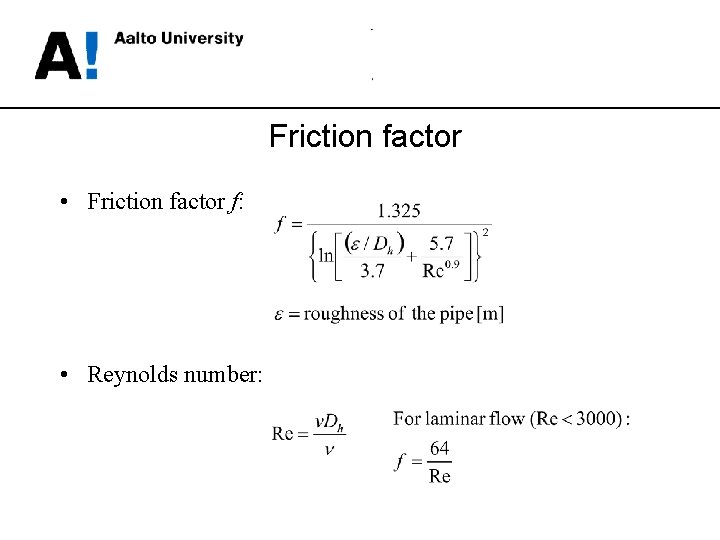
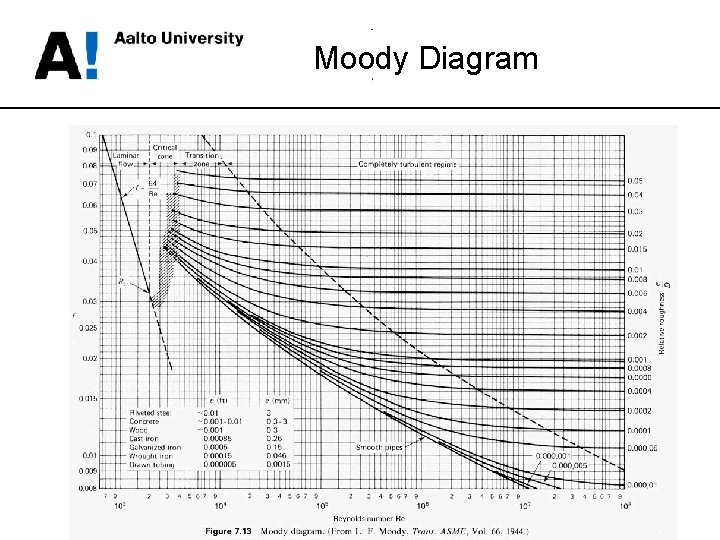
Friction factor • Friction factor f: • Reynolds number:
Moody Diagram
Minor loss coefficients (K) for various pipe components Elbows Cross Reducers
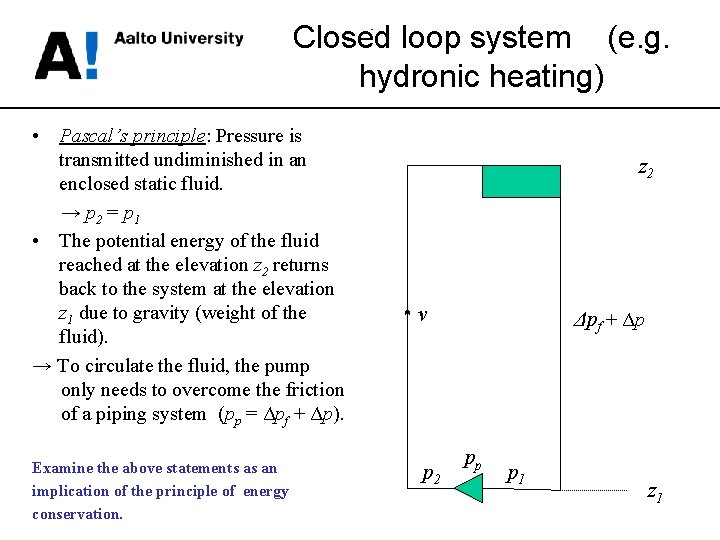
Closed loop system (e. g. hydronic heating) • Pascal’s principle: Pressure is transmitted undiminished in an enclosed static fluid. → p 2 = p 1 • The potential energy of the fluid reached at the elevation z 2 returns back to the system at the elevation z 1 due to gravity (weight of the fluid). → To circulate the fluid, the pump only needs to overcome the friction of a piping system (pp = Δpf + Δp). Examine the above statements as an implication of the principle of energy conservation. z 2 v p 2 Δpf + Δp pp p 1 z 1
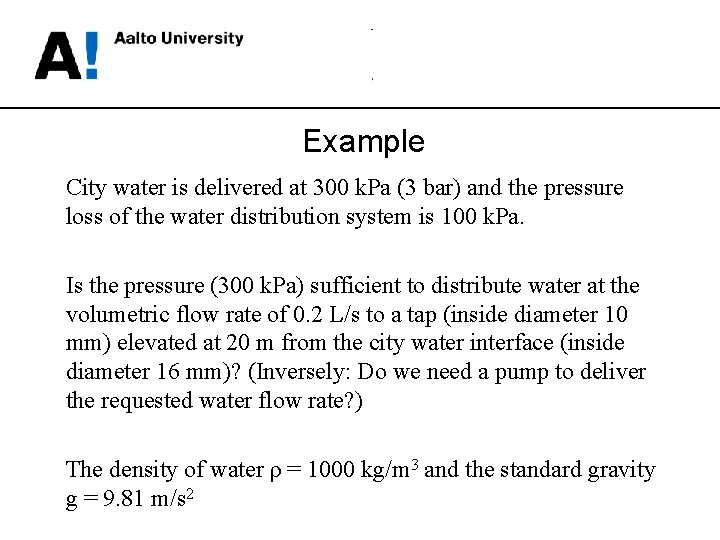
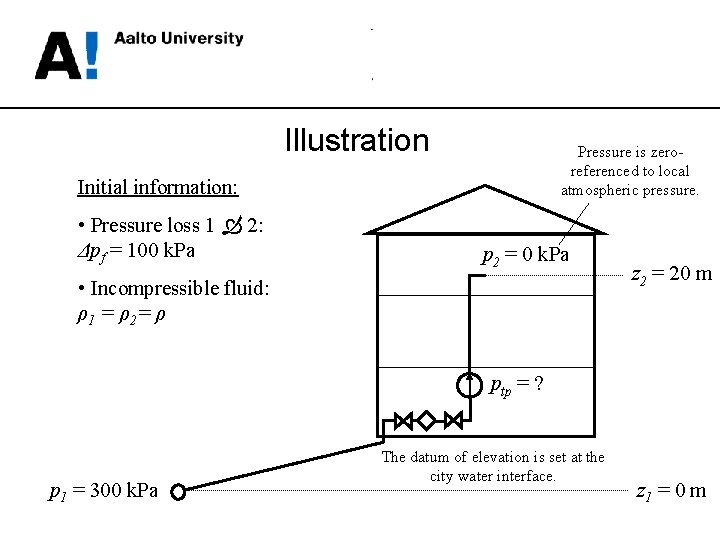
Example City water is delivered at 300 k. Pa (3 bar) and the pressure loss of the water distribution system is 100 k. Pa. Is the pressure (300 k. Pa) sufficient to distribute water at the volumetric flow rate of 0. 2 L/s to a tap (inside diameter 10 mm) elevated at 20 m from the city water interface (inside diameter 16 mm)? (Inversely: Do we need a pump to deliver the requested water flow rate? ) The density of water ρ = 1000 kg/m 3 and the standard gravity g = 9. 81 m/s 2
Illustration Pressure is zeroreferenced to local atmospheric pressure. Initial information: • Pressure loss 1 2: Δpf = 100 k. Pa p 2 = 0 k. Pa • Incompressible fluid: ρ 1 = ρ 2= ρ z 2 = 20 m ptp = ? p 1 = 300 k. Pa The datum of elevation is set at the city water interface. z 1 = 0 m
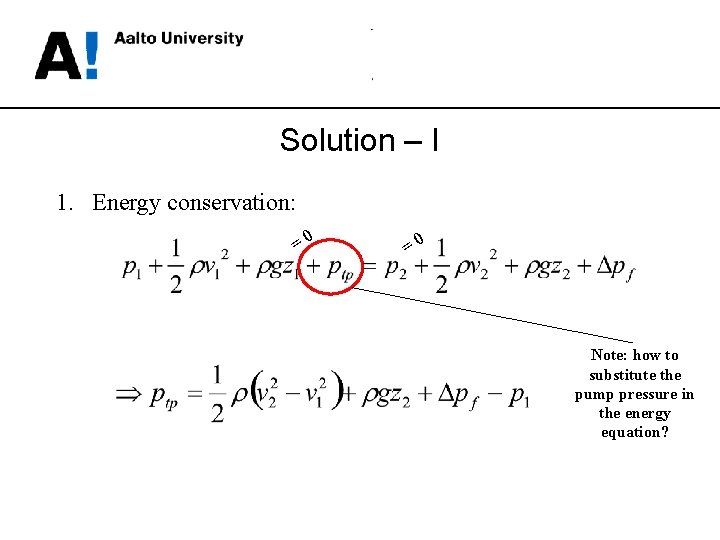
Solution – I 1. Energy conservation: =0 =0 Note: how to substitute the pump pressure in the energy equation?
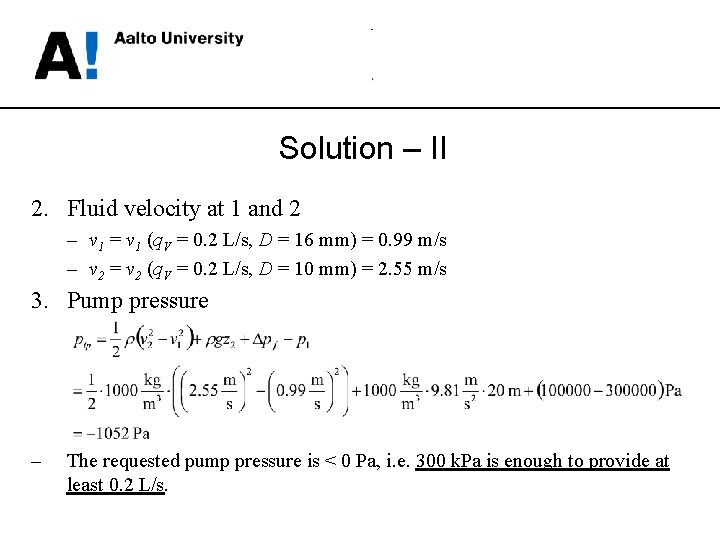
Solution – II 2. Fluid velocity at 1 and 2 – v 1 = v 1 (q. V = 0. 2 L/s, D = 16 mm) = 0. 99 m/s – v 2 = v 2 (q. V = 0. 2 L/s, D = 10 mm) = 2. 55 m/s 3. Pump pressure – The requested pump pressure is < 0 Pa, i. e. 300 k. Pa is enough to provide at least 0. 2 L/s.
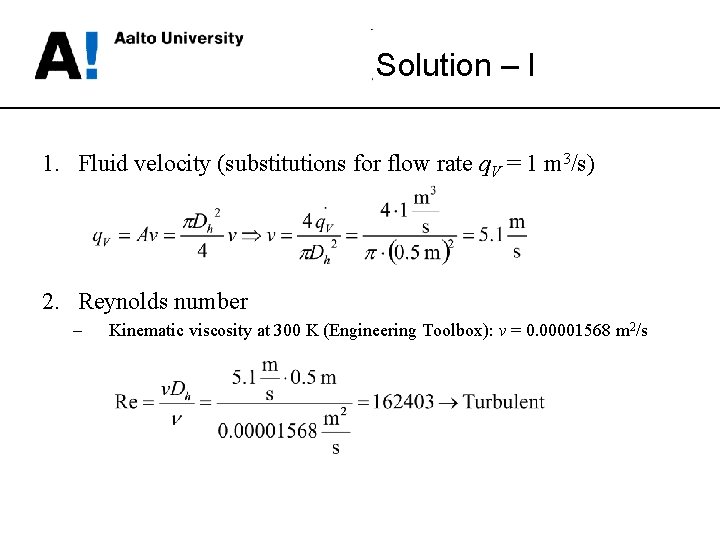
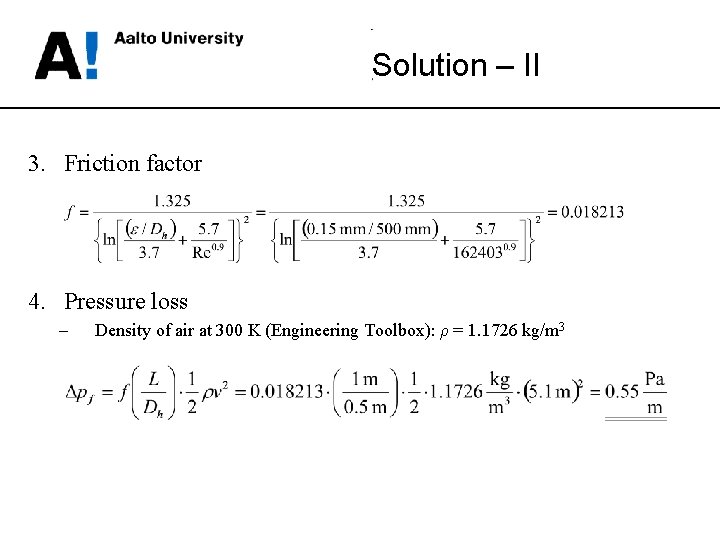
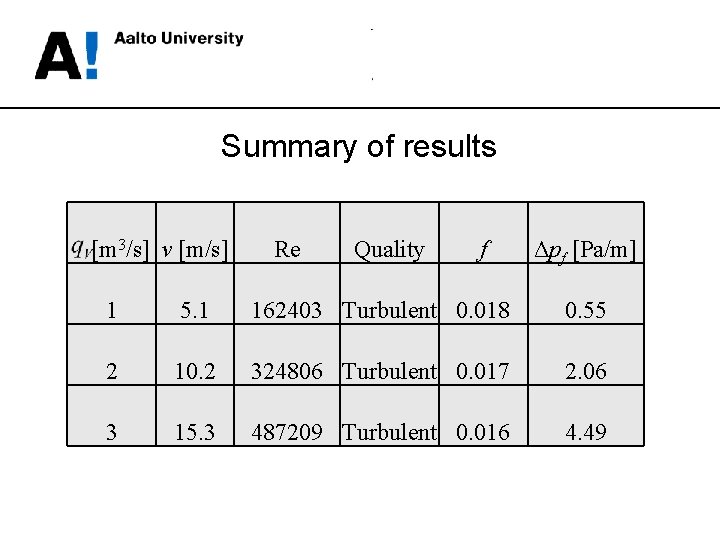
Example Calculate the friction loss per 1 m of a straight air duct (diameter 500 mm, roughness 0. 15 mm) at volumetric flow rates 1, 2 and 3 m 3/s. The air temperature is 300 K.
Solution – I 1. Fluid velocity (substitutions for flow rate q. V = 1 m 3/s) 2. Reynolds number – Kinematic viscosity at 300 K (Engineering Toolbox): ν = 0. 00001568 m 2/s
Solution – II 3. Friction factor 4. Pressure loss – Density of air at 300 K (Engineering Toolbox): ρ = 1. 1726 kg/m 3
Summary of results [m 3/s] v [m/s] Re Quality f Δpf [Pa/m] 1 5. 1 162403 Turbulent 0. 018 0. 55 2 10. 2 324806 Turbulent 0. 017 2. 06 3 15. 3 487209 Turbulent 0. 016 4. 49
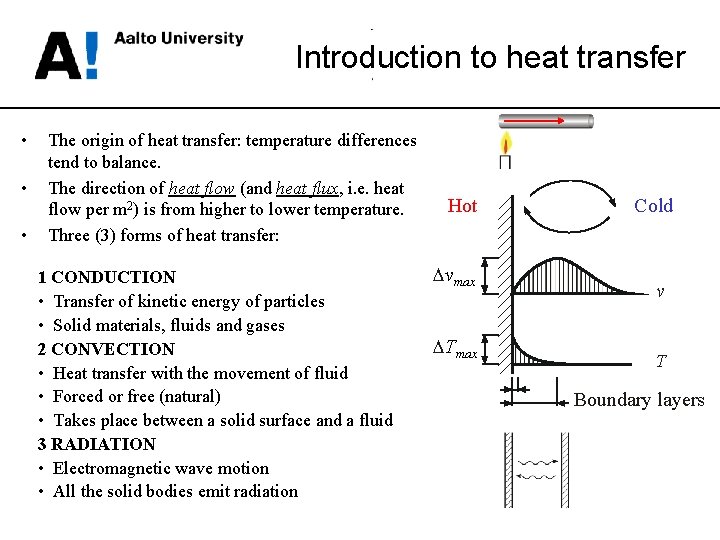
Introduction to heat transfer • • • The origin of heat transfer: temperature differences tend to balance. The direction of heat flow (and heat flux, i. e. heat flow per m 2) is from higher to lower temperature. Three (3) forms of heat transfer: 1 CONDUCTION • Transfer of kinetic energy of particles • Solid materials, fluids and gases 2 CONVECTION • Heat transfer with the movement of fluid • Forced or free (natural) • Takes place between a solid surface and a fluid 3 RADIATION • Electromagnetic wave motion • All the solid bodies emit radiation Hot Dvmax DTmax Cold v T Boundary layers
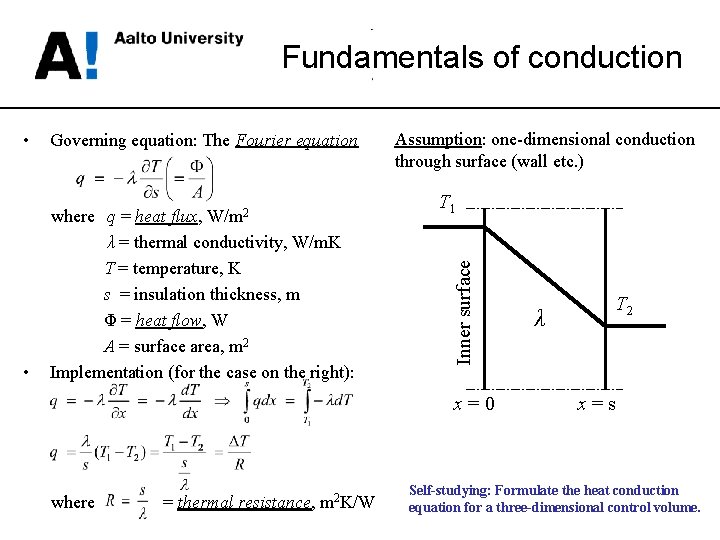
Fundamentals of conduction Governing equation: The Fourier equation • where q = heat flux, W/m 2 λ = thermal conductivity, W/m. K T = temperature, K s = insulation thickness, m Φ = heat flow, W A = surface area, m 2 Implementation (for the case on the right): Assumption: one-dimensional conduction through surface (wall etc. ) T 1 Inner surface • x=0 where = thermal resistance, m 2 K/W λ T 2 x=s Self-studying: Formulate the heat conduction equation for a three-dimensional control volume.
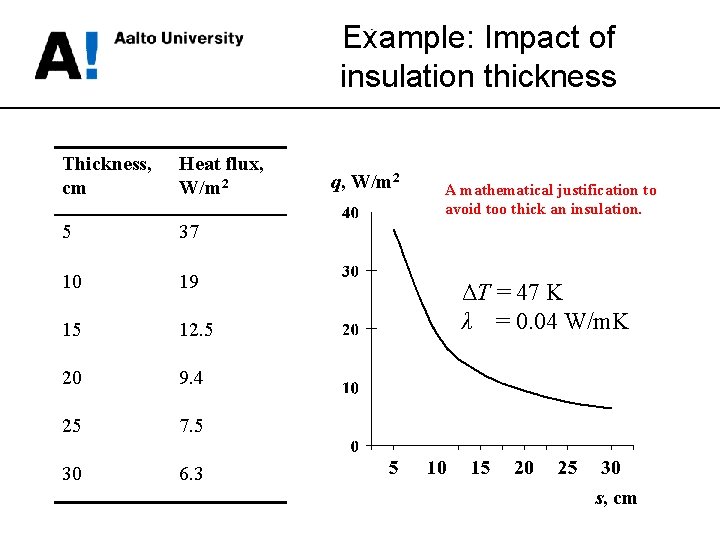
Example: Impact of insulation thickness Thickness, cm Heat flux, W/m 2 5 37 10 19 15 12. 5 20 9. 4 25 7. 5 30 6. 3 q, W/m 2 A mathematical justification to avoid too thick an insulation. ΔT = 47 K λ = 0. 04 W/m. K s, cm
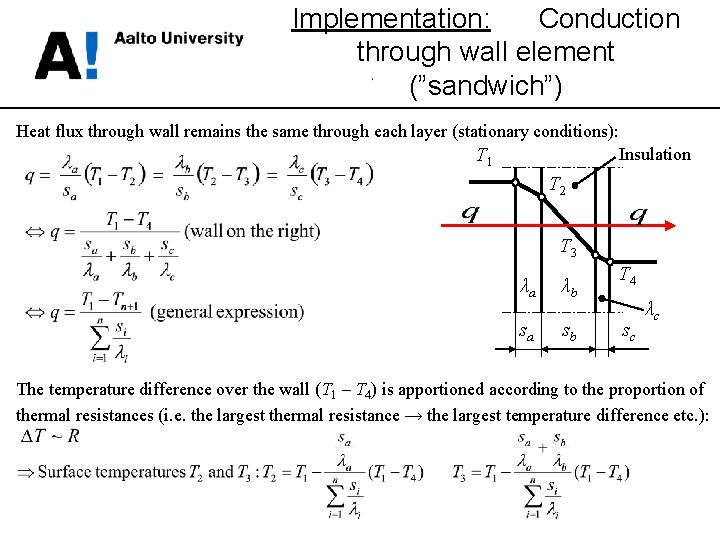
Implementation: Conduction through wall element (”sandwich”) Heat flux through wall remains the same through each layer (stationary conditions): Insulation T 1 T 2 T 3 λa λb sa sb T 4 sc λc The temperature difference over the wall (T 1 – T 4) is apportioned according to the proportion of thermal resistances (i. e. the largest thermal resistance → the largest temperature difference etc. ):
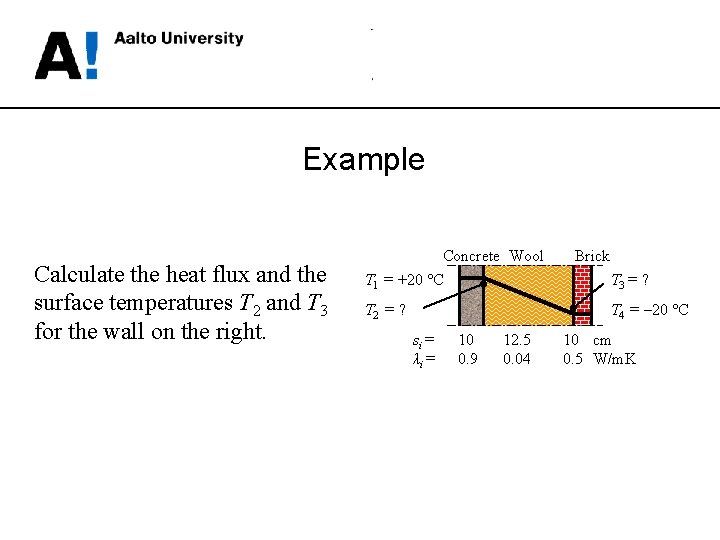
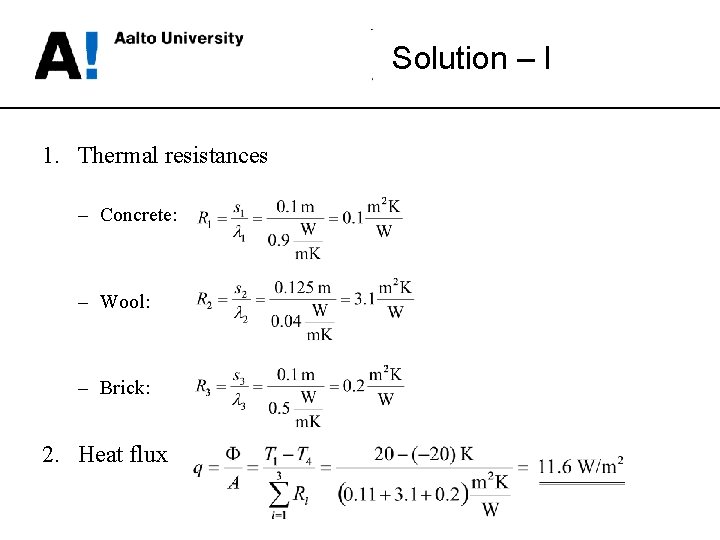
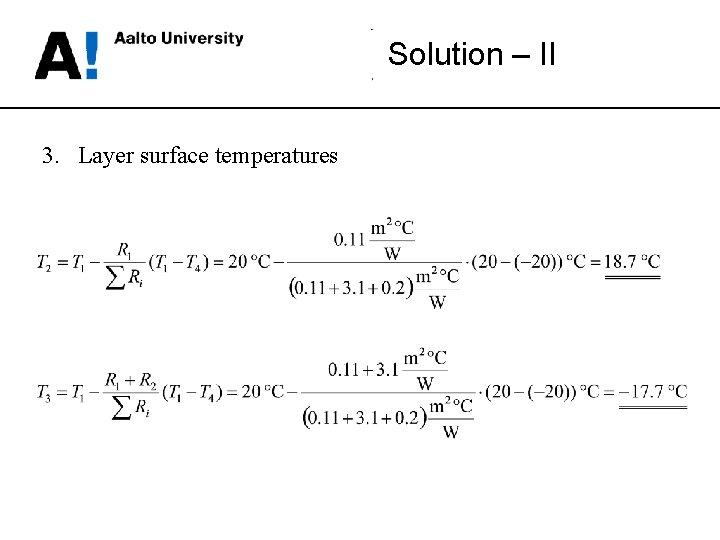
Example Calculate the heat flux and the surface temperatures T 2 and T 3 for the wall on the right. Concrete Wool T 1 = +20 °C T 2 = ? Brick T 3 = ? T 4 = – 20 °C si = λi = 10 0. 9 12. 5 0. 04 10 cm 0. 5 W/m. K
Solution – I 1. Thermal resistances – Concrete: – Wool: – Brick: 2. Heat flux
Solution – II 3. Layer surface temperatures
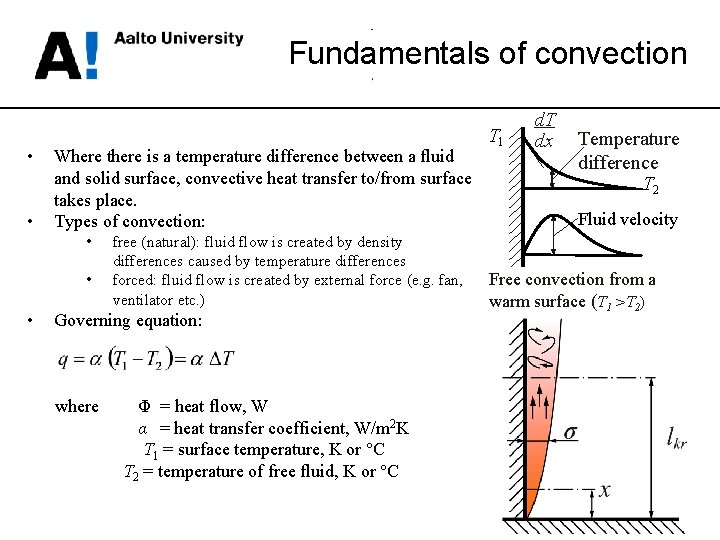
Fundamentals of convection • • Where there is a temperature difference between a fluid and solid surface, convective heat transfer to/from surface takes place. Types of convection: • • • free (natural): fluid flow is created by density differences caused by temperature differences forced: fluid flow is created by external force (e. g. fan, ventilator etc. ) Governing equation: where Φ = heat flow, W α = heat transfer coefficient, W/m 2 K T 1 = surface temperature, K or °C T 2 = temperature of free fluid, K or °C T 1 d. T dx Temperature difference T 2 Fluid velocity Free convection from a warm surface (T 1 >T 2)
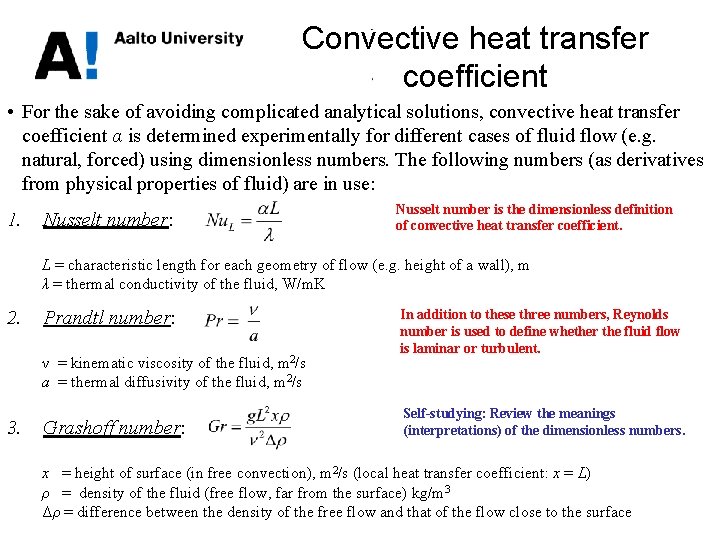
Convective heat transfer coefficient • For the sake of avoiding complicated analytical solutions, convective heat transfer coefficient α is determined experimentally for different cases of fluid flow (e. g. natural, forced) using dimensionless numbers. The following numbers (as derivatives from physical properties of fluid) are in use: 1. Nusselt number: Nusselt number is the dimensionless definition of convective heat transfer coefficient. L = characteristic length for each geometry of flow (e. g. height of a wall), m λ = thermal conductivity of the fluid, W/m. K 2. Prandtl number: ν = kinematic viscosity of the fluid, m 2/s a = thermal diffusivity of the fluid, m 2/s 3. Grashoff number: In addition to these three numbers, Reynolds number is used to define whether the fluid flow is laminar or turbulent. Self-studying: Review the meanings (interpretations) of the dimensionless numbers. x = height of surface (in free convection), m 2/s (local heat transfer coefficient: x = L) ρ = density of the fluid (free flow, far from the surface) kg/m 3 Δρ = difference between the density of the free flow and that of the flow close to the surface
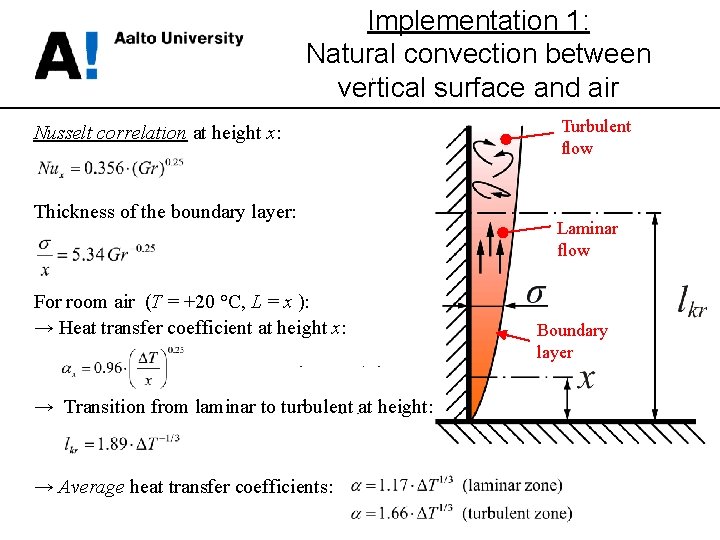
Implementation 1: Natural convection between vertical surface and air Nusselt correlation at height x: Thickness of the boundary layer: For room air (T = +20 °C, L = x ): → Heat transfer coefficient at height x: → Transition from laminar to turbulent at height: → Average heat transfer coefficients: Turbulent flow Laminar flow Boundary layer
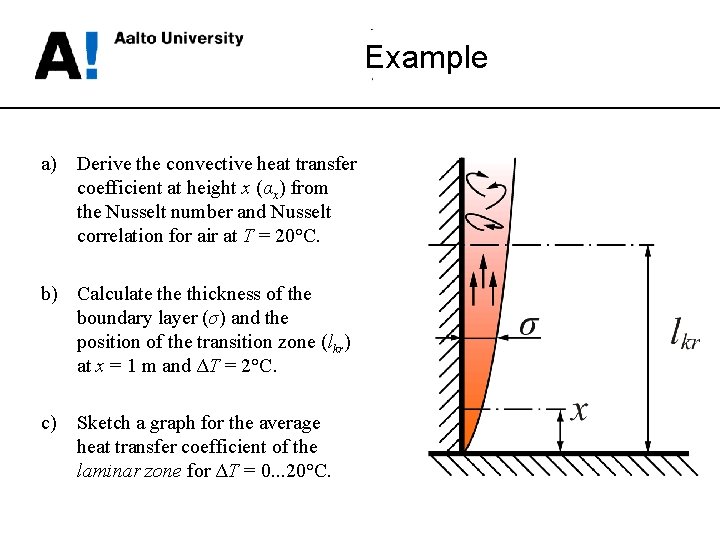
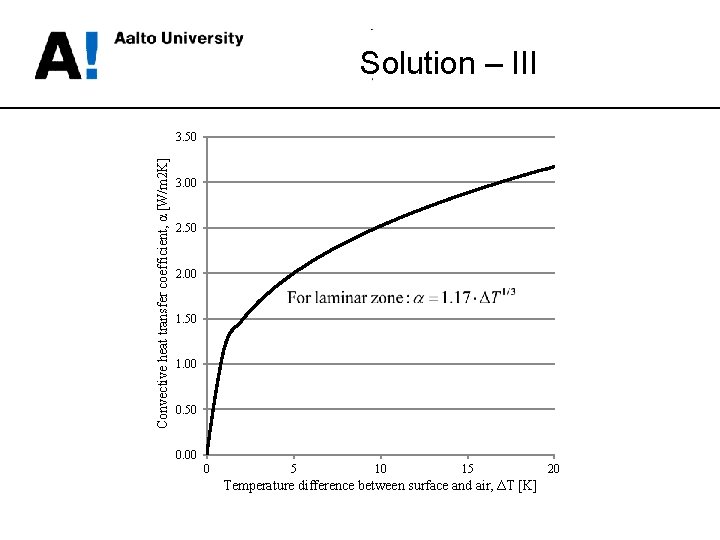
Example a) Derive the convective heat transfer coefficient at height x (αx) from the Nusselt number and Nusselt correlation for air at T = 20°C. b) Calculate thickness of the boundary layer (σ) and the position of the transition zone (lkr) at x = 1 m and ΔT = 2°C. c) Sketch a graph for the average heat transfer coefficient of the laminar zone for ΔT = 0. . . 20°C.
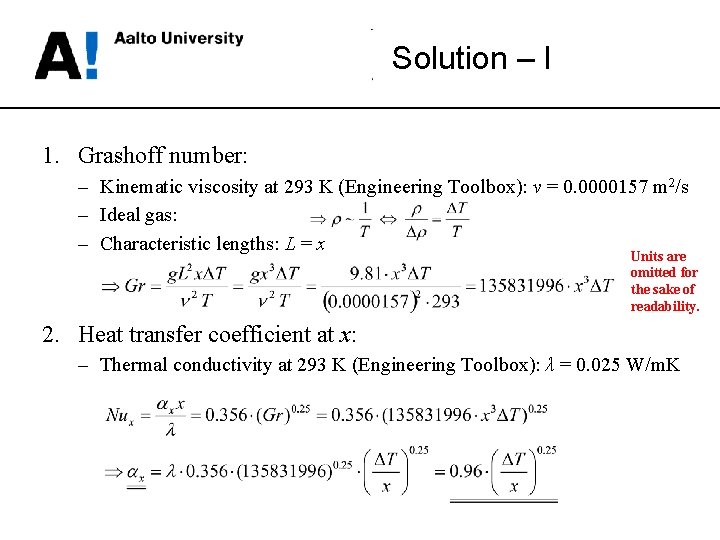
Solution – I 1. Grashoff number: – Kinematic viscosity at 293 K (Engineering Toolbox): ν = 0. 0000157 m 2/s – Ideal gas: – Characteristic lengths: L = x Units are omitted for the sake of readability. 2. Heat transfer coefficient at x: – Thermal conductivity at 293 K (Engineering Toolbox): λ = 0. 025 W/m. K
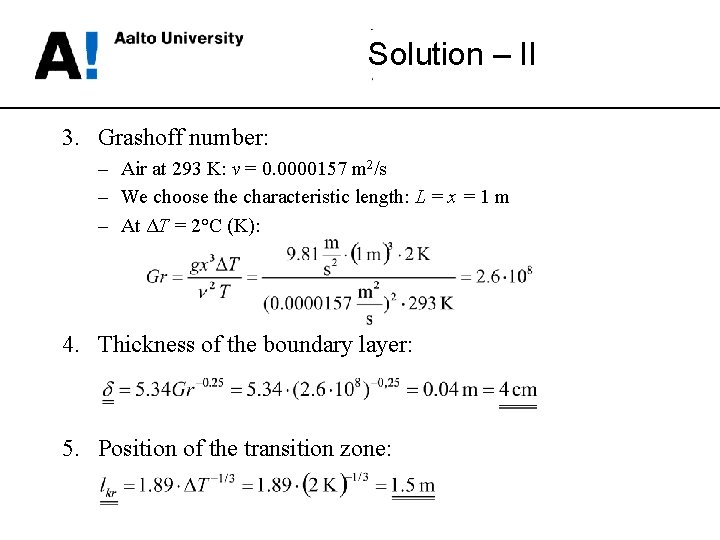
Solution – II 3. Grashoff number: – Air at 293 K: ν = 0. 0000157 m 2/s – We choose the characteristic length: L = x = 1 m – At ΔT = 2°C (K): 4. Thickness of the boundary layer: 5. Position of the transition zone:
Solution – III Convective heat transfer coefficient, α [W/m 2 K] 3. 50 3. 00 2. 50 2. 00 1. 50 1. 00 0. 50 0. 00 0 5 10 15 Temperature difference between surface and air, ΔT [K] 20
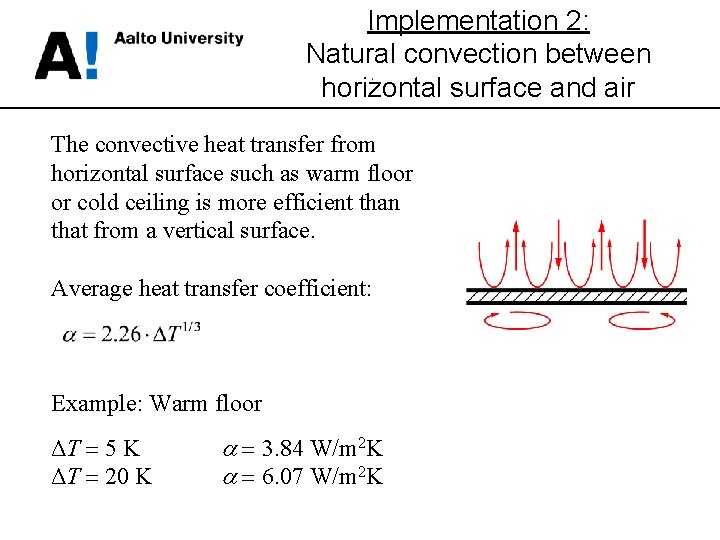
Implementation 2: Natural convection between horizontal surface and air The convective heat transfer from horizontal surface such as warm floor or cold ceiling is more efficient than that from a vertical surface. Average heat transfer coefficient: Example: Warm floor ΔT = 5 K ΔT = 20 K = 3. 84 W/m 2 K = 6. 07 W/m 2 K
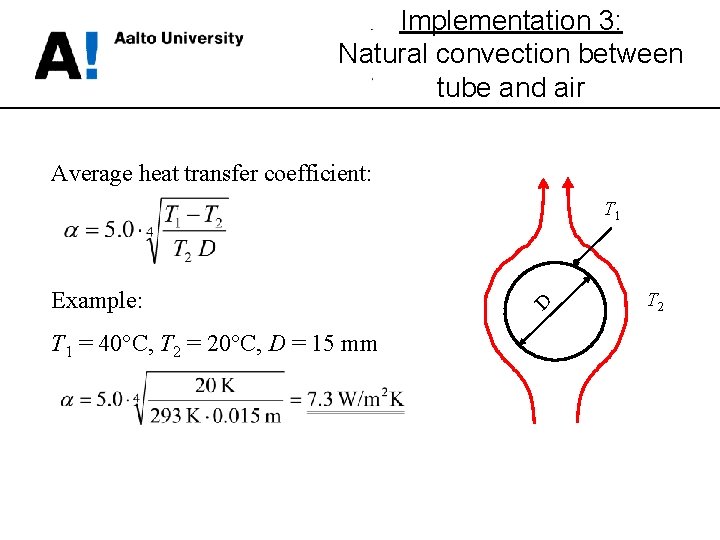
Implementation 3: Natural convection between tube and air Average heat transfer coefficient: Example: T 1 = 40°C, T 2 = 20°C, D = 15 mm D T 1 T 2
Implementation 4: Forced convection Nusselt correlation: Dh a For rectangle: For gap: Average heat transfer coefficients (v = fluid velocity, m/s): b d
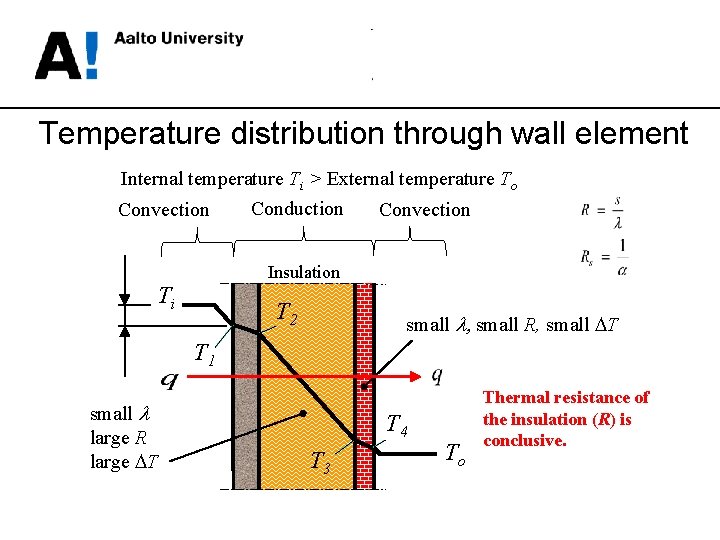
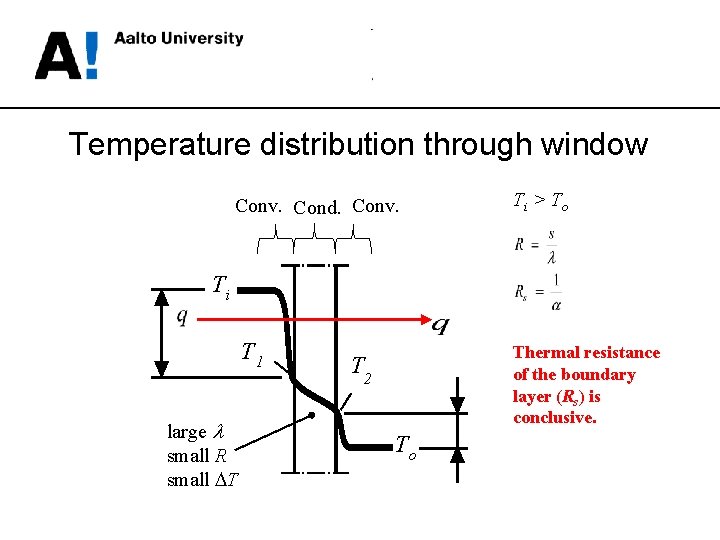
Temperature distribution through wall element Internal temperature Ti > External temperature To Conduction Convection Insulation Ti T 2 small l, small R, small DT T 1 small l large R large DT T 4 T 3 To Thermal resistance of the insulation (R) is conclusive.
Temperature distribution through window Conv. Cond. Conv. Ti > To Ti T 1 large l small R small DT Thermal resistance of the boundary layer (Rs) is conclusive. T 2 To
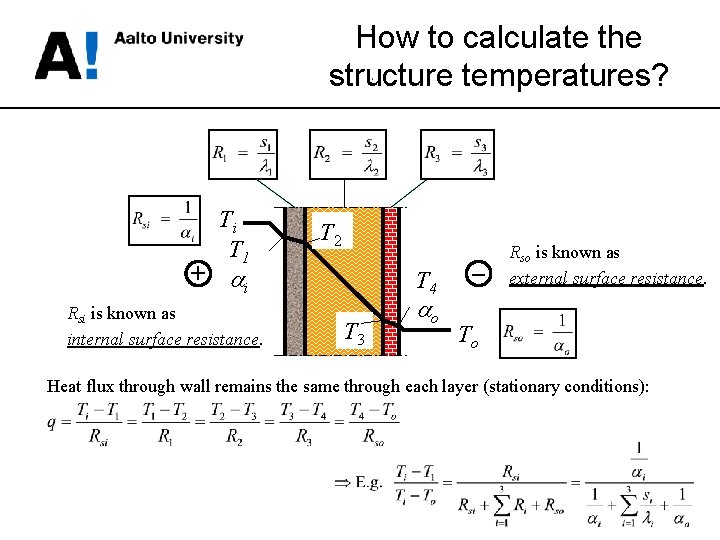
How to calculate the structure temperatures? Ti T 1 T 2 + i Rsi is known as internal surface resistance. T 4 T 3 o – Rso is known as external surface resistance. To Heat flux through wall remains the same through each layer (stationary conditions):
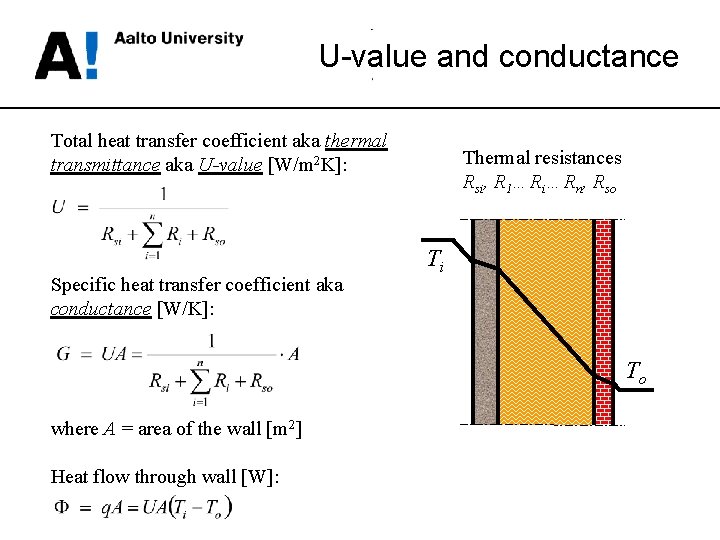
U-value and conductance Total heat transfer coefficient aka thermal transmittance aka U-value [W/m 2 K]: Specific heat transfer coefficient aka conductance [W/K]: Thermal resistances Rsi, R 1…Ri…Rn, Rso Ti To where A = area of the wall [m 2] Heat flow through wall [W]:
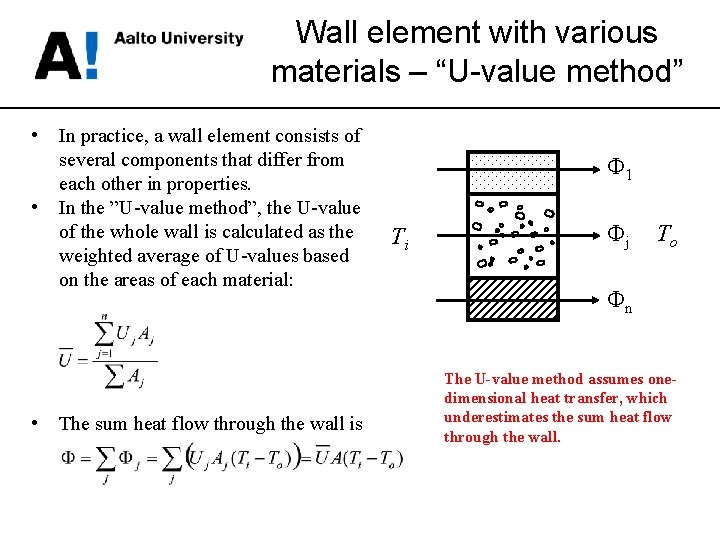
Wall element with various materials – “U-value method” • • • In practice, a wall element consists of several components that differ from each other in properties. In the ”U-value method”, the U-value of the whole wall is calculated as the weighted average of U-values based on the areas of each material: The sum heat flow through the wall is Φ 1 Ti Φj To Φn The U-value method assumes onedimensional heat transfer, which underestimates the sum heat flow through the wall.
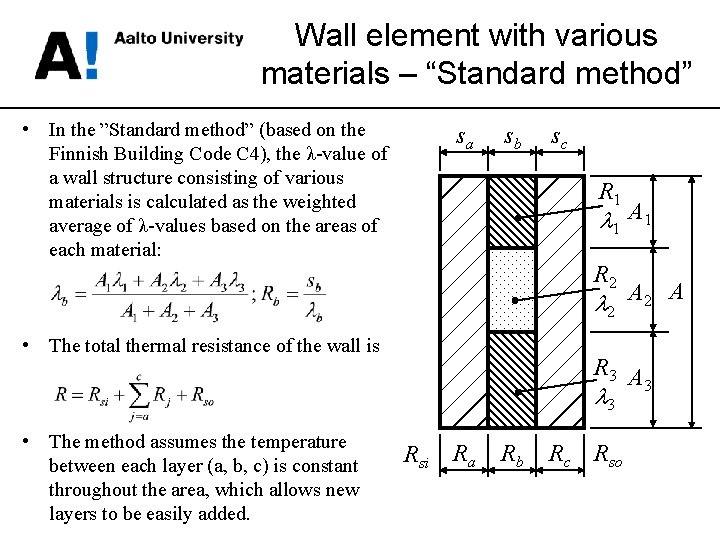
Wall element with various materials – “Standard method” • In the ”Standard method” (based on the Finnish Building Code C 4), the λ-value of a wall structure consisting of various materials is calculated as the weighted average of λ-values based on the areas of each material: sa sb sc R 1 l 1 A 1 R 2 l 2 A • The total thermal resistance of the wall is R 3 A 3 l 3 • The method assumes the temperature between each layer (a, b, c) is constant throughout the area, which allows new layers to be easily added. Rsi Ra Rb Rc Rso
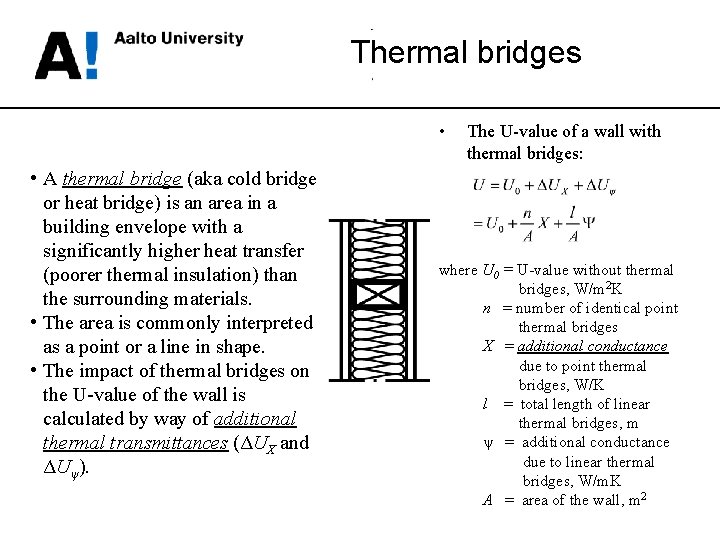
Thermal bridges • • A thermal bridge (aka cold bridge or heat bridge) is an area in a building envelope with a significantly higher heat transfer (poorer thermal insulation) than the surrounding materials. • The area is commonly interpreted as a point or a line in shape. • The impact of thermal bridges on the U-value of the wall is calculated by way of additional thermal transmittances (ΔUX and ΔUψ). The U-value of a wall with thermal bridges: where U 0 = U-value without thermal bridges, W/m 2 K n = number of identical point thermal bridges X = additional conductance due to point thermal bridges, W/K l = total length of linear thermal bridges, m ψ = additional conductance due to linear thermal bridges, W/m. K A = area of the wall, m 2
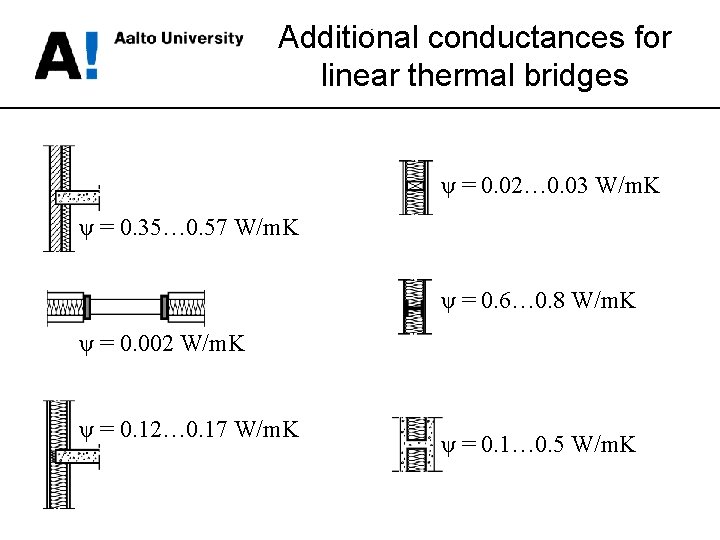
Additional conductances for linear thermal bridges ψ = 0. 02… 0. 03 W/m. K ψ = 0. 35… 0. 57 W/m. K ψ = 0. 6… 0. 8 W/m. K ψ = 0. 002 W/m. K ψ = 0. 12… 0. 17 W/m. K ψ = 0. 1… 0. 5 W/m. K
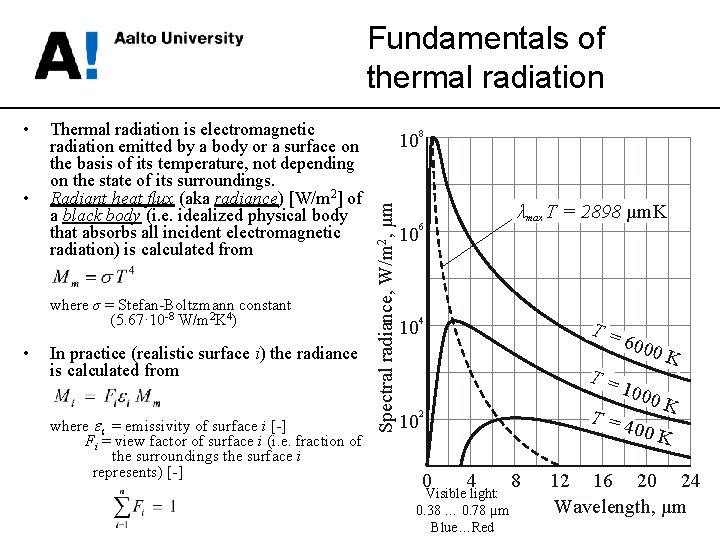
• • Thermal radiation is electromagnetic radiation emitted by a body or a surface on the basis of its temperature, not depending on the state of its surroundings. Radiant heat flux (aka radiance) [W/m 2] of a black body (i. e. idealized physical body that absorbs all incident electromagnetic radiation) is calculated from where σ = Stefan-Boltzmann constant (5. 67· 10 -8 W/m 2 K 4) • In practice (realistic surface i) the radiance is calculated from where ei = emissivity of surface i [-] Fi = view factor of surface i (i. e. fraction of the surroundings the surface i represents) [-] Spectral radiance, W/m 2, μm Fundamentals of thermal radiation 10 8 10 6 10 4 λmax T = 2898 µm. K T= T= 10 100 0 K T=4 00 K 2 0 600 0 K 4 Visible light: 0. 38 … 0. 78 µm Blue…Red 8 12 16 20 24 Wavelength, µm
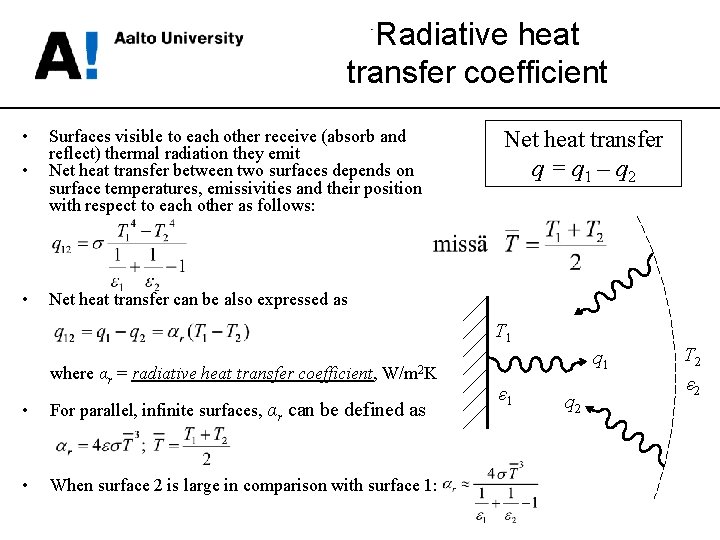
Radiative heat transfer coefficient • • Surfaces visible to each other receive (absorb and reflect) thermal radiation they emit Net heat transfer between two surfaces depends on surface temperatures, emissivities and their position with respect to each other as follows: • Net heat transfer can be also expressed as Net heat transfer q = q 1 – q 2 T 1 where αr = radiative heat transfer coefficient, W/m 2 K • For parallel, infinite surfaces, αr can be defined as • When surface 2 is large in comparison with surface 1: q 1 ε 1 q 2 T 2 ε 2
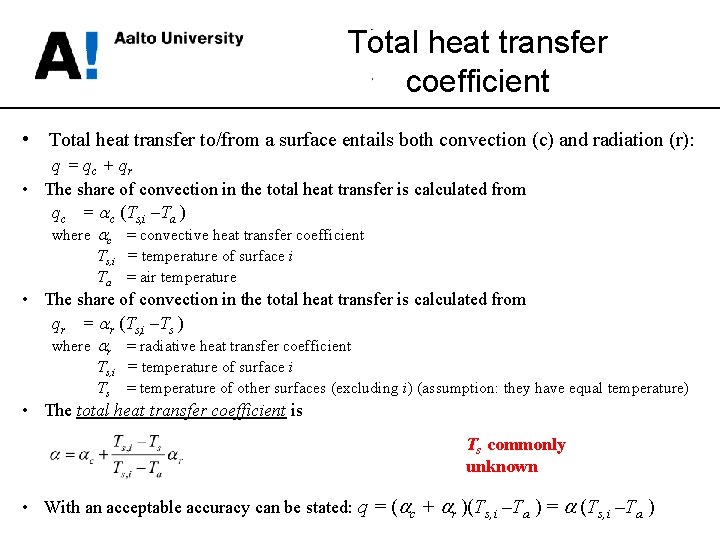
Total heat transfer coefficient • Total heat transfer to/from a surface entails both convection (c) and radiation (r): q = qc + qr • The share of convection in the total heat transfer is calculated from qc = c (Ts, i –Ta ) where c = convective heat transfer coefficient Ts, i = temperature of surface i Ta = air temperature • The share of convection in the total heat transfer is calculated from qr = r (Ts, i –Ts ) where r = radiative heat transfer coefficient Ts, i = temperature of surface i Ts = temperature of other surfaces (excluding i) (assumption: they have equal temperature) • The total heat transfer coefficient is Ts commonly unknown • With an acceptable accuracy can be stated: q = ( c + r )(Ts, i –Ta ) = (Ts, i –Ta )
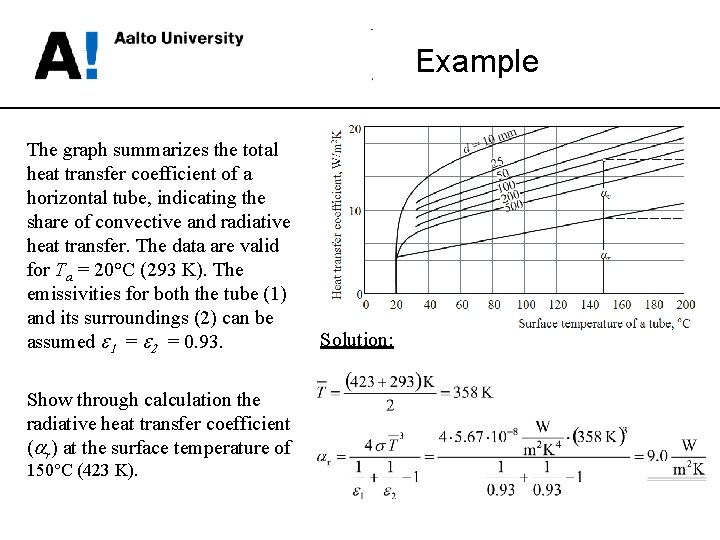
Example The graph summarizes the total heat transfer coefficient of a horizontal tube, indicating the share of convective and radiative heat transfer. The data are valid for Ta = 20°C (293 K). The emissivities for both the tube (1) and its surroundings (2) can be assumed e 1 = e 2 = 0. 93. Show through calculation the radiative heat transfer coefficient ( r) at the surface temperature of 150°C (423 K). Solution: