
Goddard Latent Heating Retrieval Algorithm for TRMMGPM WeiKuo

- Slides: 24
Goddard Latent Heating Retrieval Algorithm for TRMM/GPM Wei-Kuo Tao 1 and Steve Lang 1, 2, Takamichi Iguchi 1, 3, and Yi Song 1 1 NASA Goddard Space Flight Center 2 Science Systems and Applications, Inc. Lanham, MD 3 Earth System Science Interdisciplinary Center University of Maryland, College Park, MD
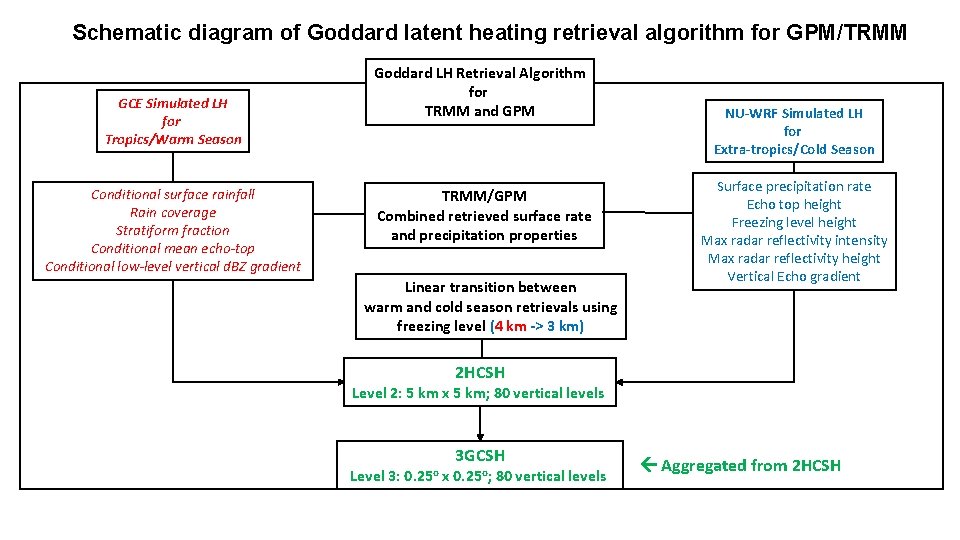
Schematic diagram of Goddard latent heating retrieval algorithm for GPM/TRMM GCE Simulated LH for Tropics/Warm Season Conditional surface rainfall Rain coverage Stratiform fraction Conditional mean echo-top Conditional low-level vertical d. BZ gradient Goddard LH Retrieval Algorithm for TRMM and GPM TRMM/GPM Combined retrieved surface rate and precipitation properties Linear transition between warm and cold season retrievals using freezing level (4 km -> 3 km) NU-WRF Simulated LH for Extra-tropics/Cold Season Surface precipitation rate Echo top height Freezing level height Max radar reflectivity intensity Max radar reflectivity height Vertical Echo gradient 2 HCSH Level 2: 5 km x 5 km; 80 vertical levels 3 GCSH Level 3: 0. 25 o x 0. 25 o; 80 vertical levels Aggregated from 2 HCSH
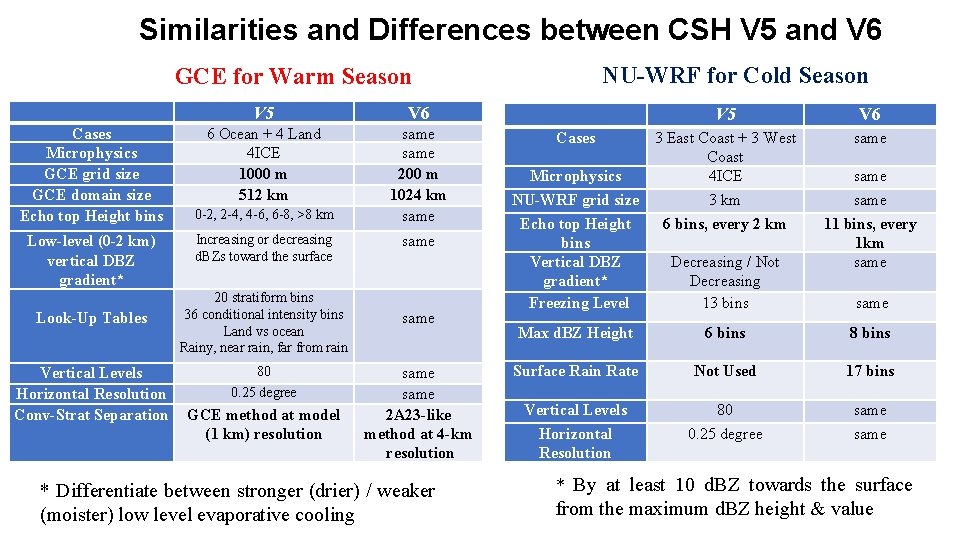
Similarities and Differences between CSH V 5 and V 6 NU-WRF for Cold Season GCE for Warm Season Cases Microphysics GCE grid size GCE domain size Echo top Height bins Low-level (0 -2 km) vertical DBZ gradient* Look-Up Tables Vertical Levels Horizontal Resolution Conv-Strat Separation V 5 V 6 6 Ocean + 4 Land 4 ICE 1000 m 512 km 0 -2, 2 -4, 4 -6, 6 -8, >8 km same 200 m 1024 km same Increasing or decreasing d. BZs toward the surface same 20 stratiform bins 36 conditional intensity bins Land vs ocean Rainy, near rain, far from rain same 80 0. 25 degree GCE method at model (1 km) resolution same 2 A 23 -like method at 4 -km resolution * Differentiate between stronger (drier) / weaker (moister) low level evaporative cooling V 5 Cases 3 East Coast + 3 West Coast Microphysics 4 ICE NU-WRF grid size 3 km Echo top Height 6 bins, every 2 km bins Vertical DBZ Decreasing / Not gradient* Decreasing Freezing Level 13 bins V 6 same 11 bins, every 1 km same Max d. BZ Height 6 bins 8 bins Surface Rain Rate Not Used 17 bins Vertical Levels Horizontal Resolution 80 0. 25 degree same * By at least 10 d. BZ towards the surface from the maximum d. BZ height & value
The Goddard CSH Algorithm for GPM: Updates of high-latitude algorithm using NU-WRF towards version 7
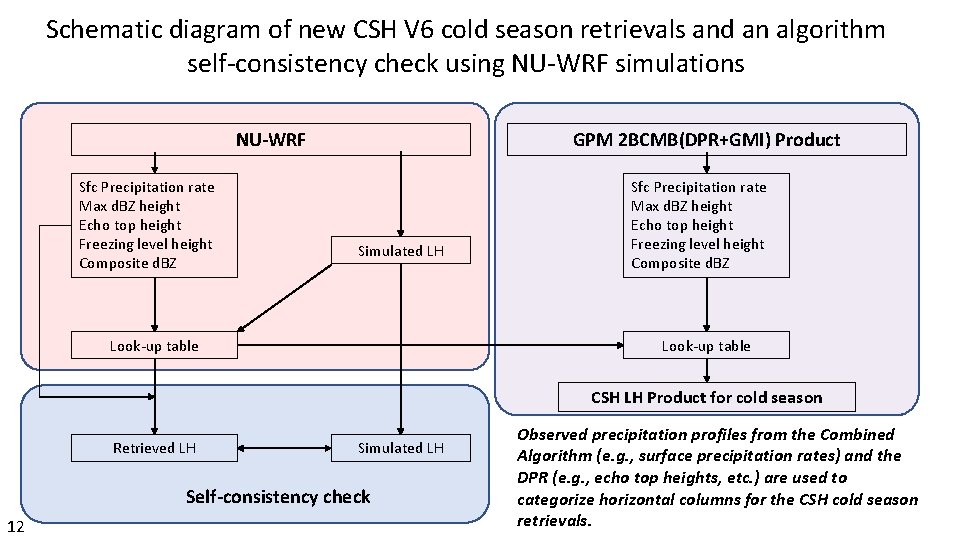
Schematic diagram of new CSH V 6 cold season retrievals and an algorithm self-consistency check using NU-WRF simulations NU-WRF Sfc Precipitation rate Max d. BZ height Echo top height Freezing level height Composite d. BZ GPM 2 BCMB(DPR+GMI) Product Simulated LH Look-up table Sfc Precipitation rate Max d. BZ height Echo top height Freezing level height Composite d. BZ Look-up table CSH LH Product for cold season Retrieved LH Simulated LH Self-consistency check 12 Observed precipitation profiles from the Combined Algorithm (e. g. , surface precipitation rates) and the DPR (e. g. , echo top heights, etc. ) are used to categorize horizontal columns for the CSH cold season retrievals.
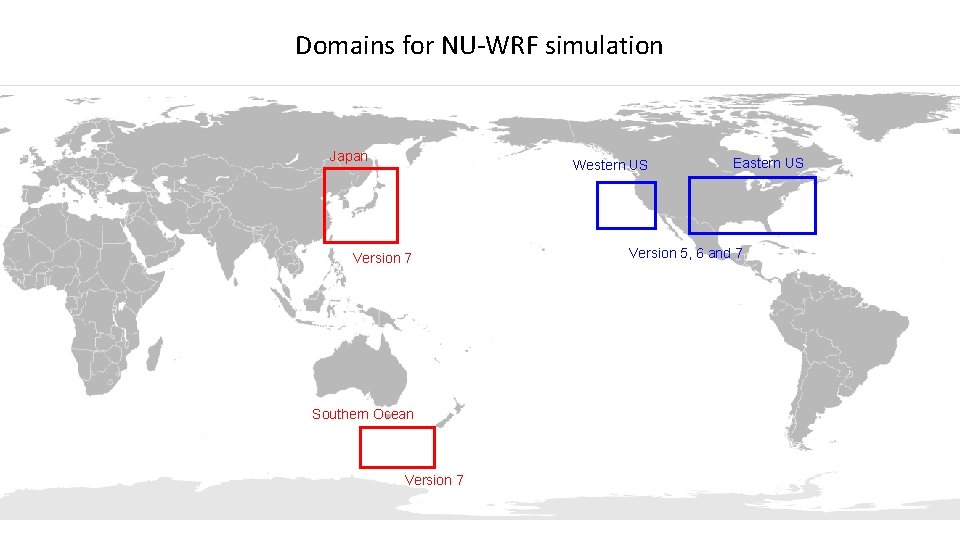
Domains for NU-WRF simulation Japan Western US Version 7 Southern Ocean Version 7 Eastern US Version 5, 6 and 7
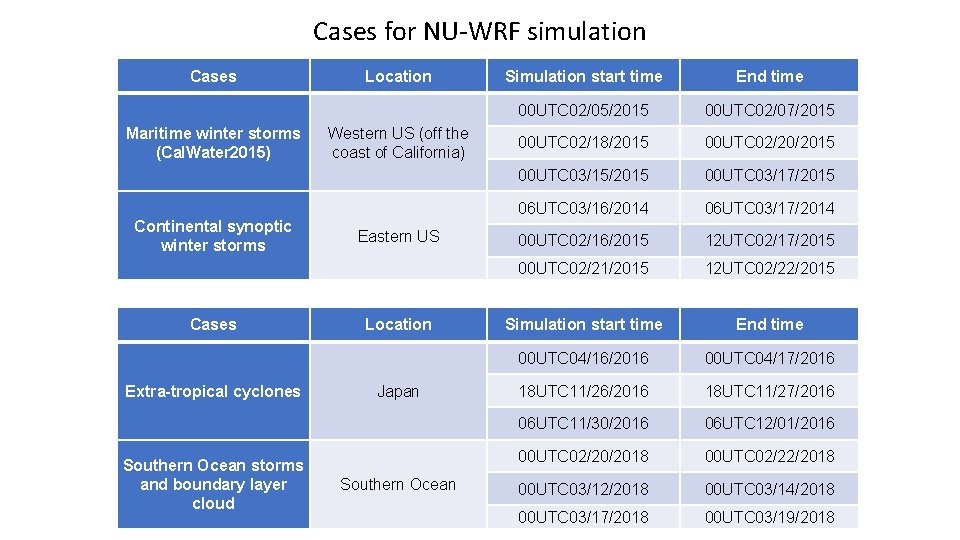
Cases for NU-WRF simulation Cases Maritime winter storms (Cal. Water 2015) Continental synoptic winter storms Cases Extra-tropical cyclones Southern Ocean storms and boundary layer cloud Location Western US (off the coast of California) Eastern US Location Japan Southern Ocean Simulation start time End time 00 UTC 02/05/2015 00 UTC 02/07/2015 00 UTC 02/18/2015 00 UTC 02/20/2015 00 UTC 03/15/2015 00 UTC 03/17/2015 06 UTC 03/16/2014 06 UTC 03/17/2014 00 UTC 02/16/2015 12 UTC 02/17/2015 00 UTC 02/21/2015 12 UTC 02/22/2015 Simulation start time End time 00 UTC 04/16/2016 00 UTC 04/17/2016 18 UTC 11/26/2016 18 UTC 11/27/2016 06 UTC 11/30/2016 06 UTC 12/01/2016 00 UTC 02/20/2018 00 UTC 02/22/2018 00 UTC 03/14/2018 00 UTC 03/17/2018 00 UTC 03/19/2018
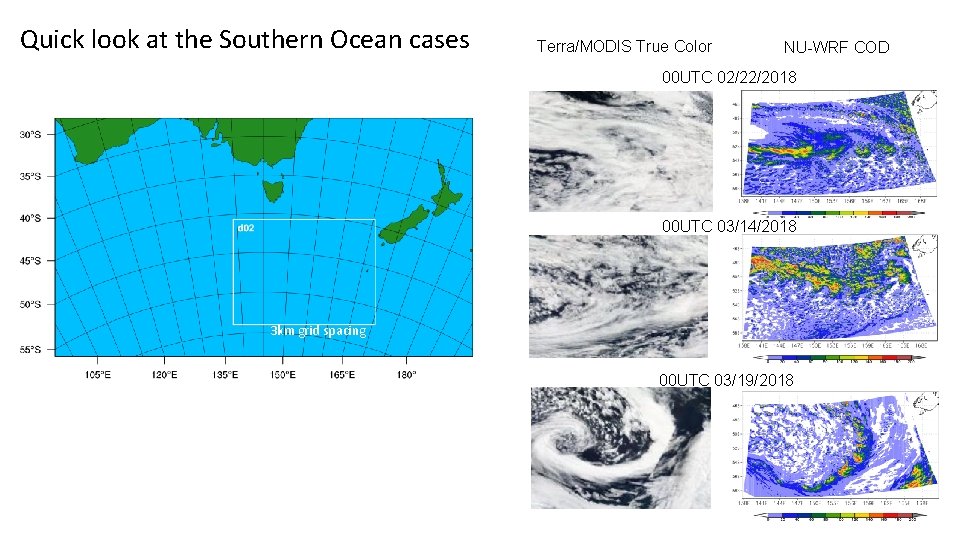
Quick look at the Southern Ocean cases Terra/MODIS True Color NU-WRF COD 00 UTC 02/22/2018 00 UTC 03/14/2018 3 km grid spacing 00 UTC 03/19/2018
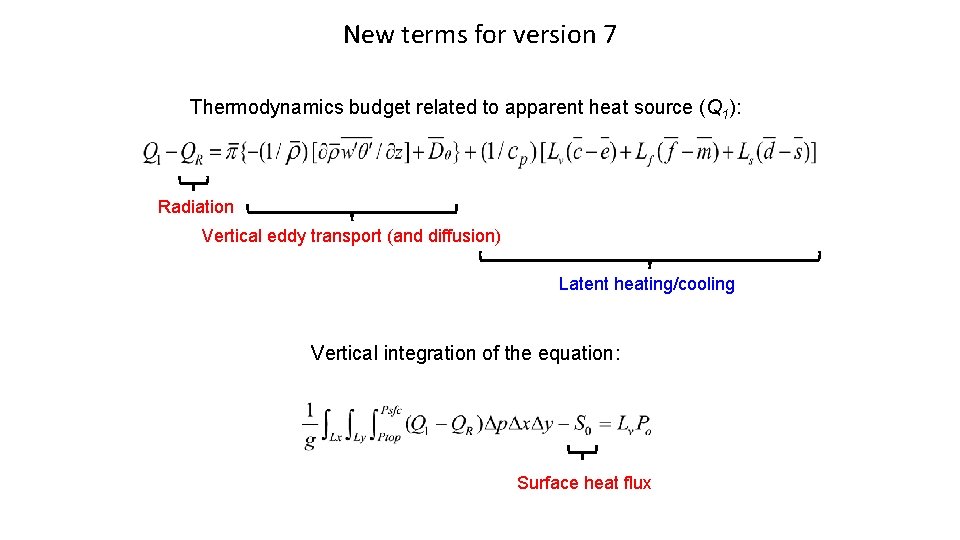
New terms for version 7 Thermodynamics budget related to apparent heat source (Q 1): Radiation Vertical eddy transport (and diffusion) Latent heating/cooling Vertical integration of the equation: Surface heat flux
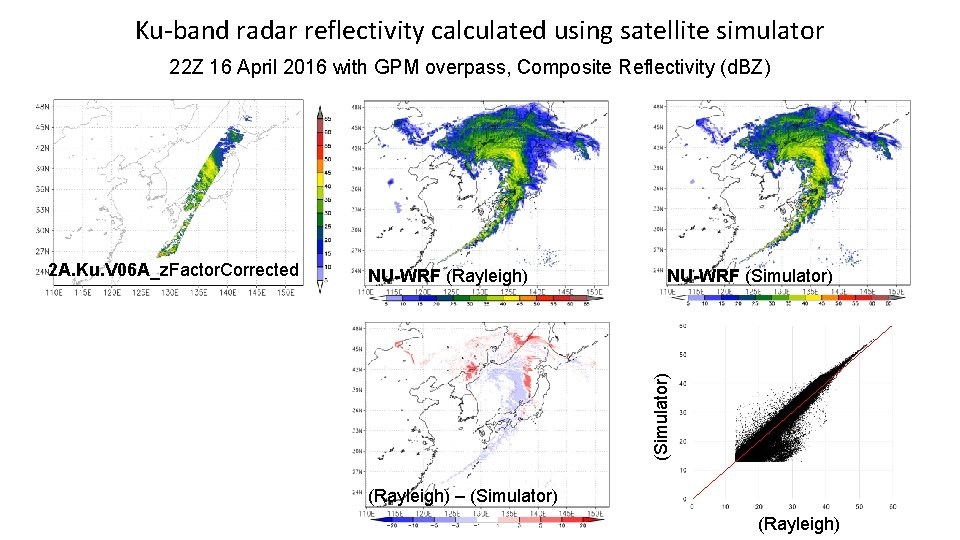
Ku-band radar reflectivity calculated using satellite simulator 22 Z 16 April 2016 with GPM overpass, Composite Reflectivity (d. BZ) NU-WRF (Rayleigh) NU-WRF (Simulator) 2 A. Ku. V 06 A_z. Factor. Corrected (Rayleigh) – (Simulator) (Rayleigh)
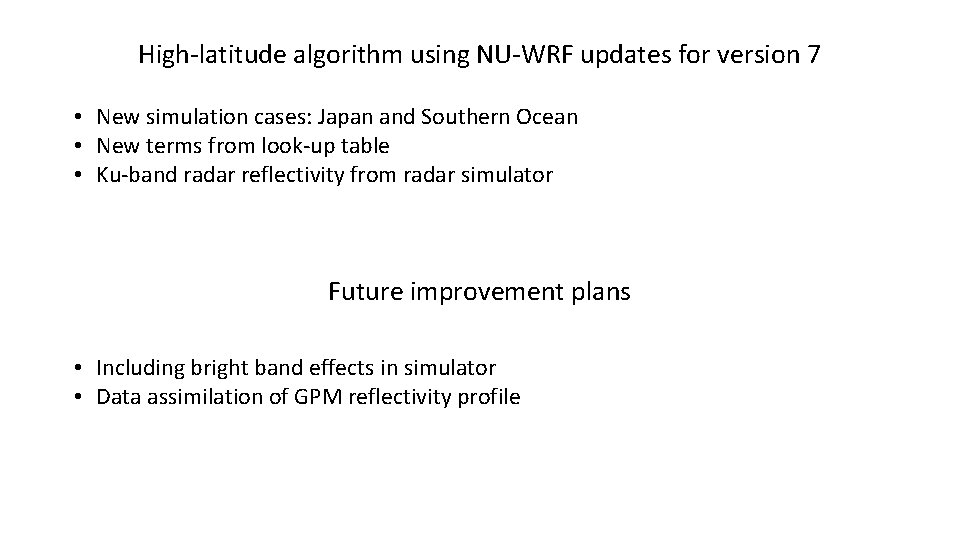
High-latitude algorithm using NU-WRF updates for version 7 • New simulation cases: Japan and Southern Ocean • New terms from look-up table • Ku-band radar reflectivity from radar simulator Future improvement plans • Including bright band effects in simulator • Data assimilation of GPM reflectivity profile
Transitioning to a 3 D GCE database for the warm-season CSH LUTs
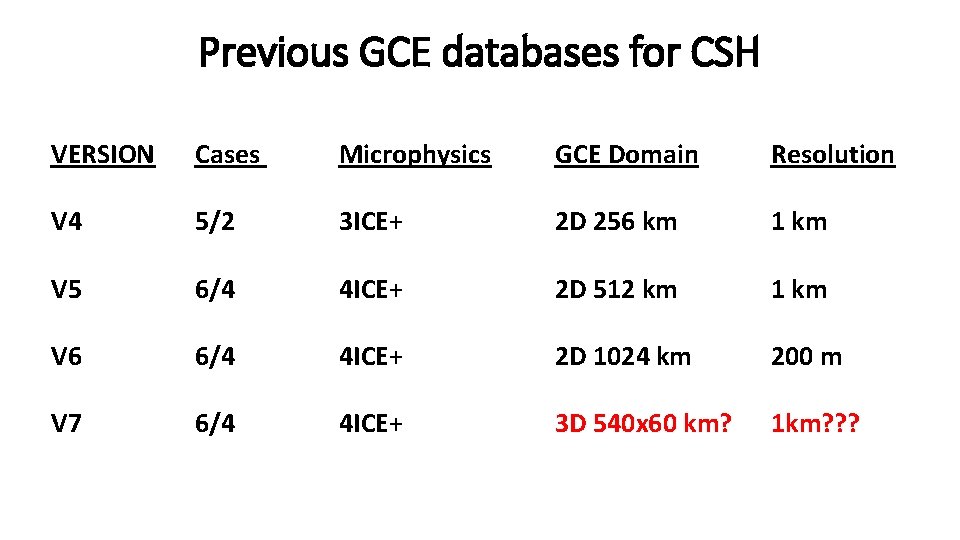
Previous GCE databases for CSH VERSION Cases Microphysics GCE Domain Resolution V 4 5/2 3 ICE+ 2 D 256 km 1 km V 5 6/4 4 ICE+ 2 D 512 km 1 km V 6 6/4 4 ICE+ 2 D 1024 km 200 m V 7 6/4 4 ICE+ 3 D 540 x 60 km? 1 km? ? ?
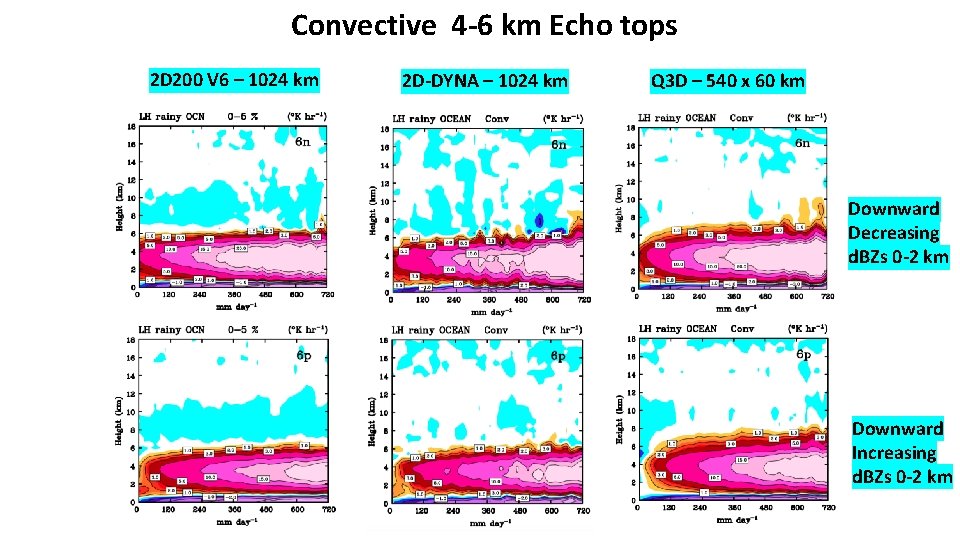
Convective 4 -6 km Echo tops 2 D 200 V 6 – 1024 km 2 D-DYNA – 1024 km Q 3 D – 540 x 60 km Downward Decreasing d. BZs 0 -2 km Downward Increasing d. BZs 0 -2 km
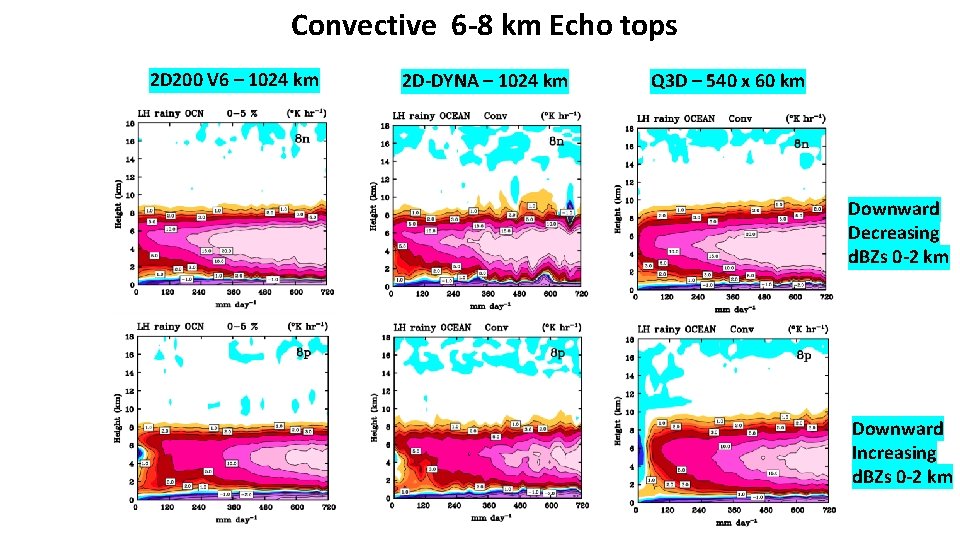
Convective 6 -8 km Echo tops 2 D 200 V 6 – 1024 km 2 D-DYNA – 1024 km Q 3 D – 540 x 60 km Downward Decreasing d. BZs 0 -2 km Downward Increasing d. BZs 0 -2 km
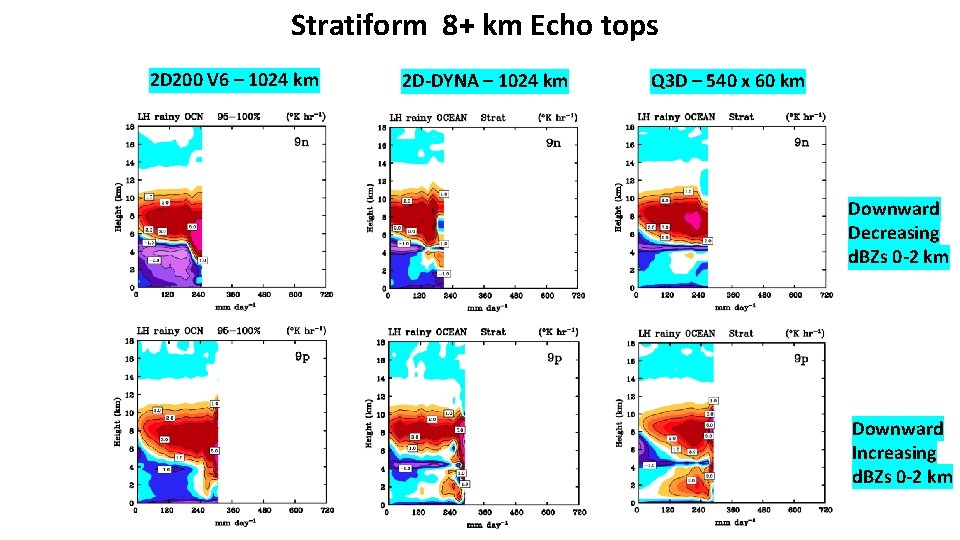
Stratiform 8+ km Echo tops 2 D 200 V 6 – 1024 km 2 D-DYNA – 1024 km Q 3 D – 540 x 60 km Downward Decreasing d. BZs 0 -2 km Downward Increasing d. BZs 0 -2 km
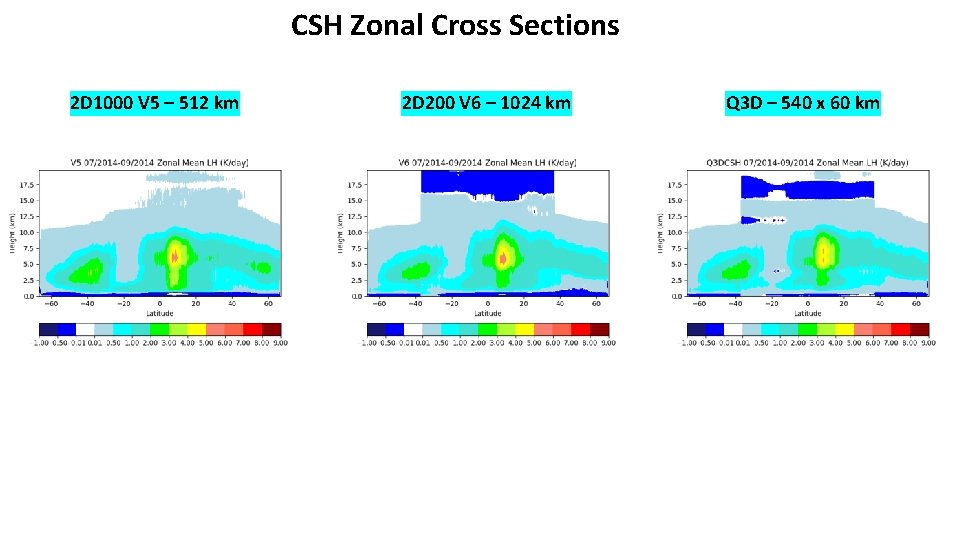
CSH Zonal Cross Sections 2 D 1000 V 5 – 512 km 2 D 200 V 6 – 1024 km Q 3 D – 540 x 60 km
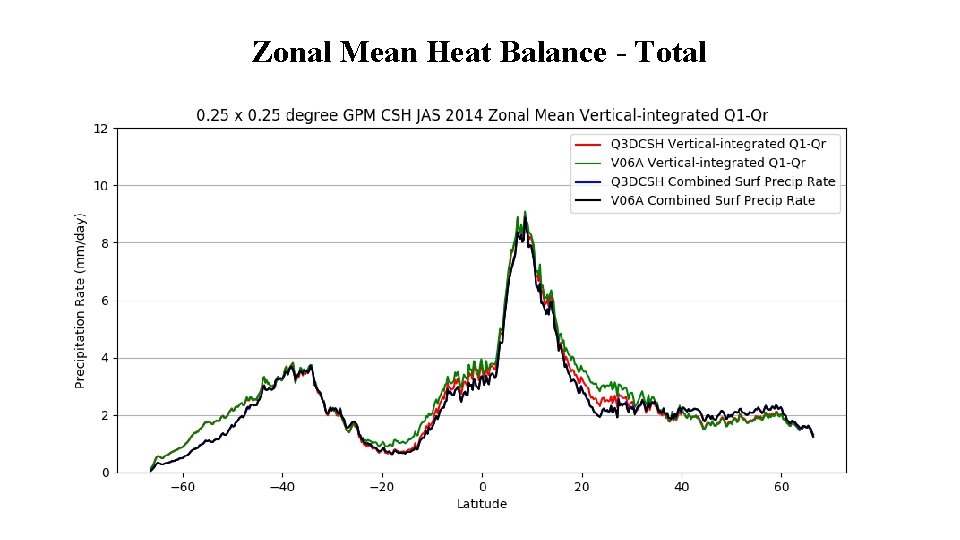
Zonal Mean Heat Balance - Total
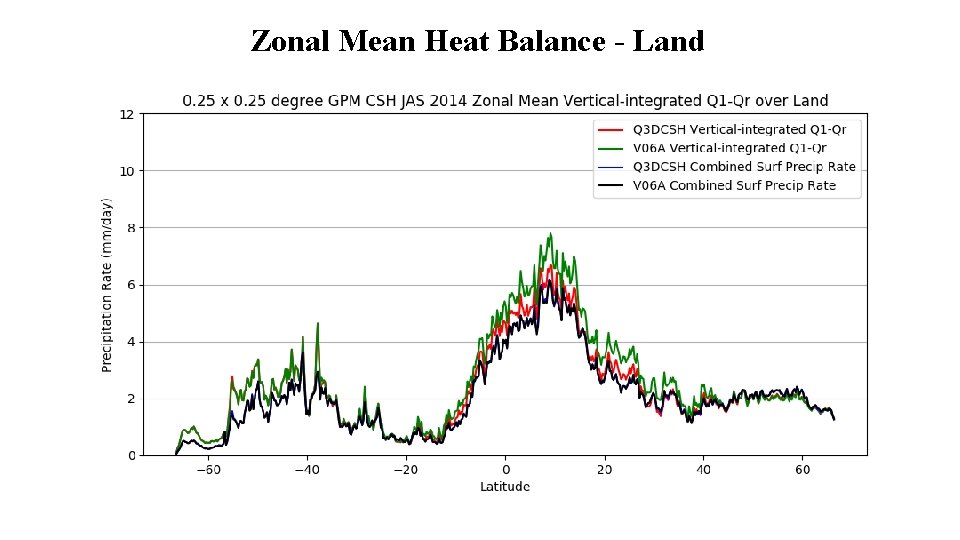
Zonal Mean Heat Balance - Land
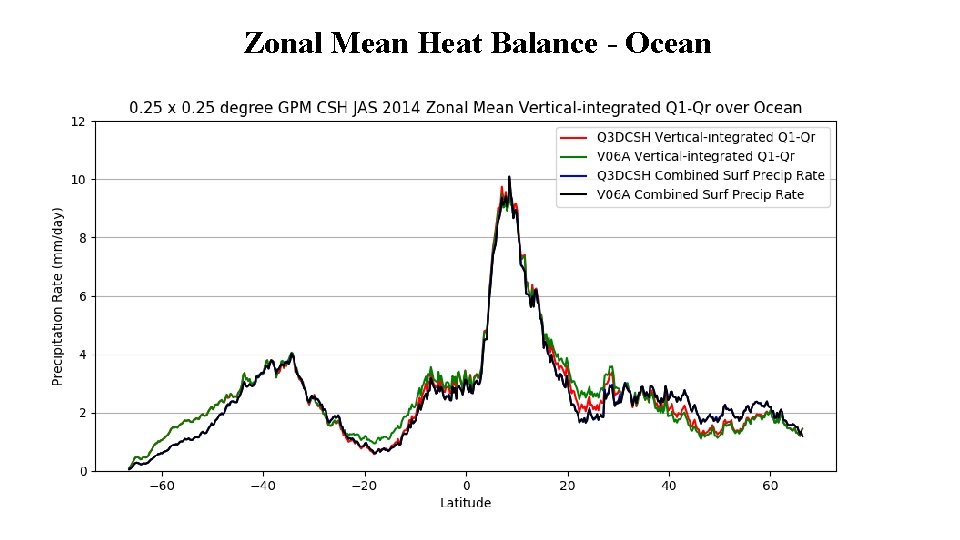
Zonal Mean Heat Balance - Ocean
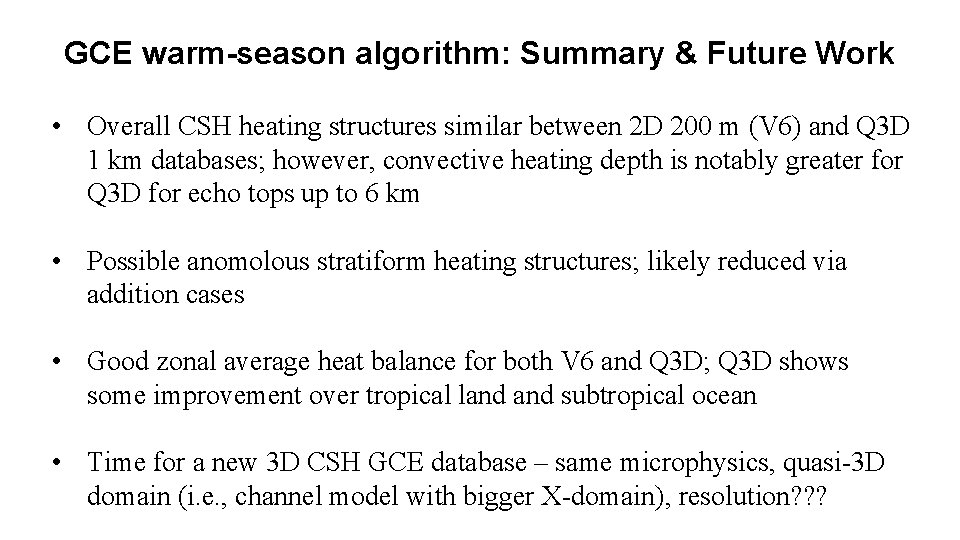
GCE warm-season algorithm: Summary & Future Work • Overall CSH heating structures similar between 2 D 200 m (V 6) and Q 3 D 1 km databases; however, convective heating depth is notably greater for Q 3 D for echo tops up to 6 km • Possible anomolous stratiform heating structures; likely reduced via addition cases • Good zonal average heat balance for both V 6 and Q 3 D; Q 3 D shows some improvement over tropical land subtropical ocean • Time for a new 3 D CSH GCE database – same microphysics, quasi-3 D domain (i. e. , channel model with bigger X-domain), resolution? ? ?
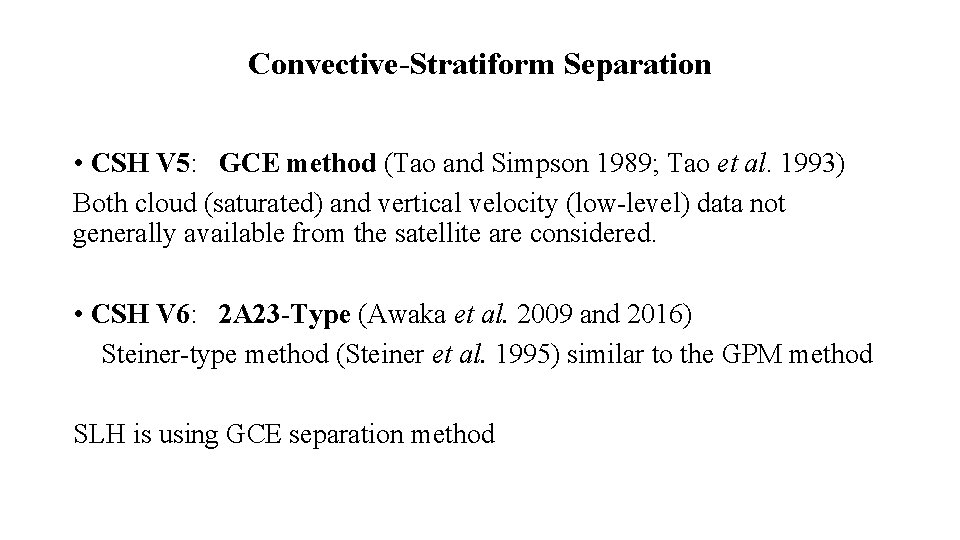
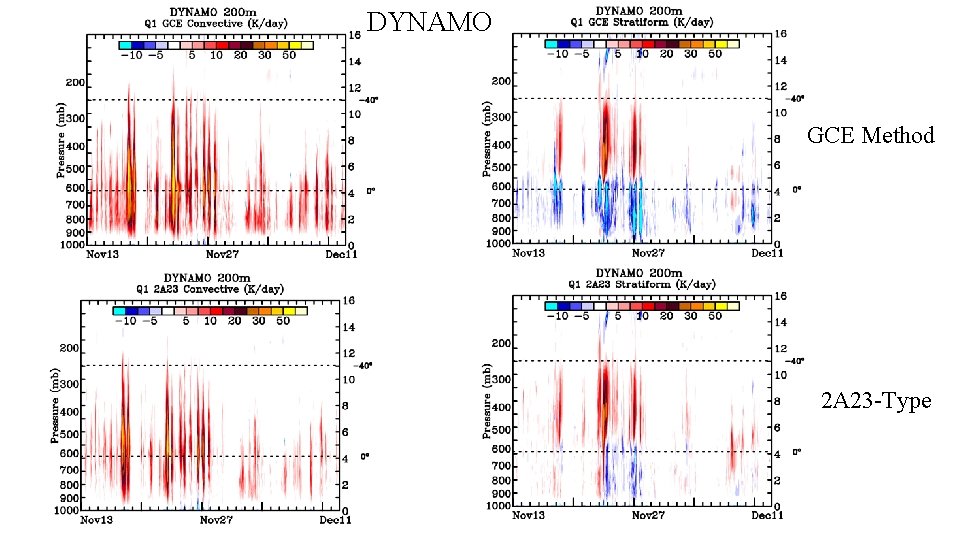
Convective-Stratiform Separation • CSH V 5: GCE method (Tao and Simpson 1989; Tao et al. 1993) Both cloud (saturated) and vertical velocity (low-level) data not generally available from the satellite are considered. • CSH V 6: 2 A 23 -Type (Awaka et al. 2009 and 2016) Steiner-type method (Steiner et al. 1995) similar to the GPM method SLH is using GCE separation method
DYNAMO GCE Method 2 A 23 -Type
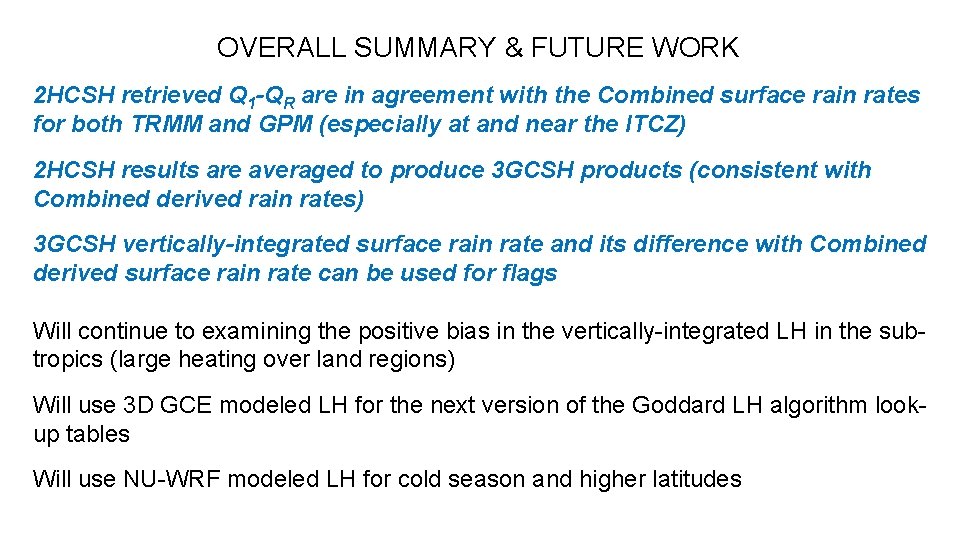
OVERALL SUMMARY & FUTURE WORK 2 HCSH retrieved Q 1 -QR are in agreement with the Combined surface rain rates for both TRMM and GPM (especially at and near the ITCZ) 2 HCSH results are averaged to produce 3 GCSH products (consistent with Combined derived rain rates) 3 GCSH vertically-integrated surface rain rate and its difference with Combined derived surface rain rate can be used for flags Will continue to examining the positive bias in the vertically-integrated LH in the subtropics (large heating over land regions) Will use 3 D GCE modeled LH for the next version of the Goddard LH algorithm lookup tables Will use NU-WRF modeled LH for cold season and higher latitudes