Introduction to Macromolecular Structures ZhiJie Liu Institute of






- Slides: 83
Introduction to Macromolecular Structures Zhi-Jie Liu Institute of Biophysics Chinese Academy of Sciences
Outline 1. Varieties of macromolecules 2. Macromolecular structures 3. Structure determination by X-ray crystallography 4. Structure validation and deposition.
Varieties of macromolecules 1. Proteins 2. DNA 3. RNA 4. Complexes: protein-protein, protein-DNA/RNA Lipids, peptides, sugars, etc are categorized as non macromolecules Our discussion is more focused on protein molecules
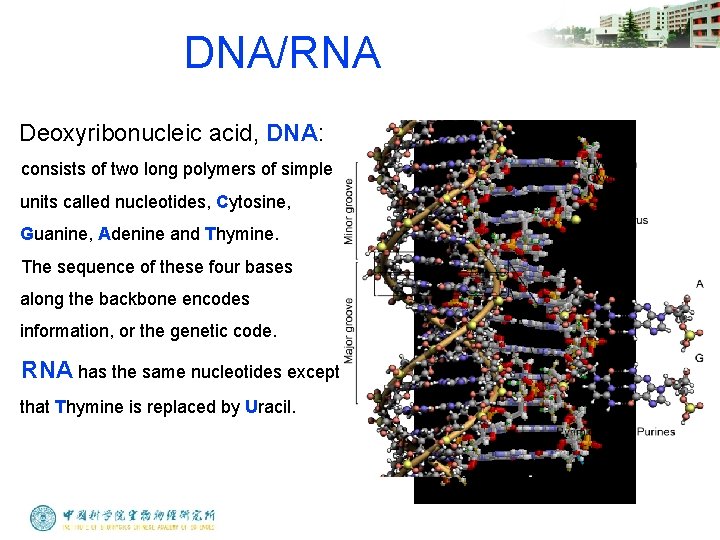
DNA/RNA Deoxyribonucleic acid, DNA: consists of two long polymers of simple units called nucleotides, Cytosine, Guanine, Adenine and Thymine. The sequence of these four bases along the backbone encodes information, or the genetic code. RNA has the same nucleotides except that Thymine is replaced by Uracil.
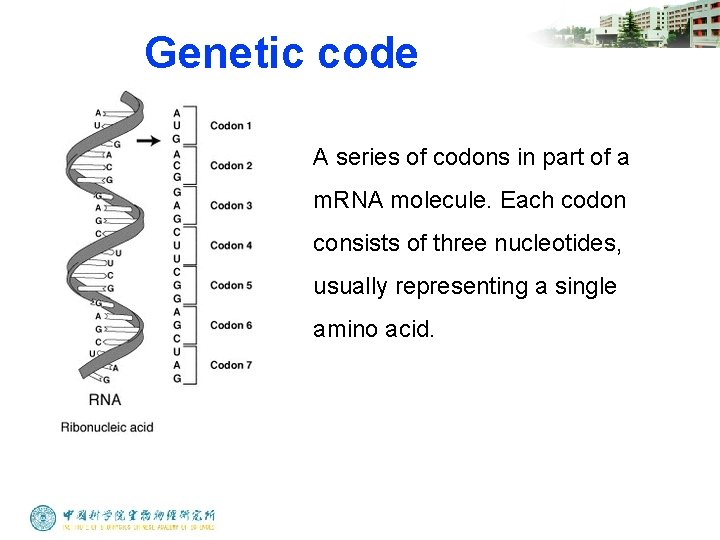
Genetic code A series of codons in part of a m. RNA molecule. Each codon consists of three nucleotides, usually representing a single amino acid.
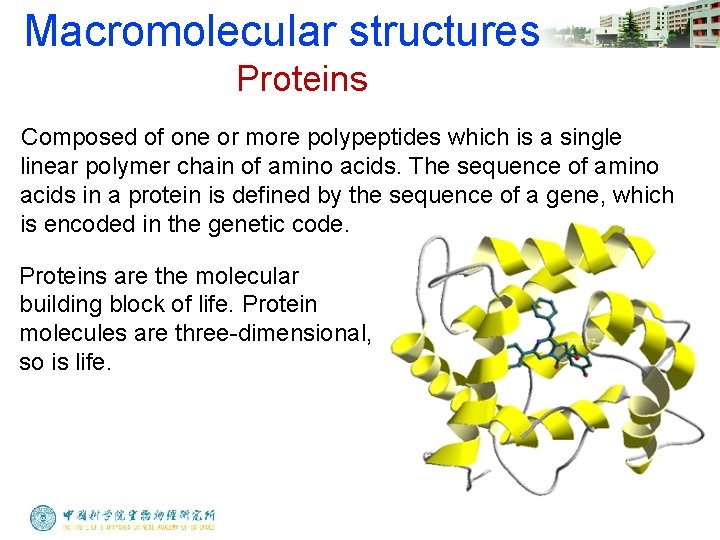
Macromolecular structures Proteins Composed of one or more polypeptides which is a single linear polymer chain of amino acids. The sequence of amino acids in a protein is defined by the sequence of a gene, which is encoded in the genetic code. Proteins are the molecular building block of life. Protein molecules are three-dimensional, so is life.
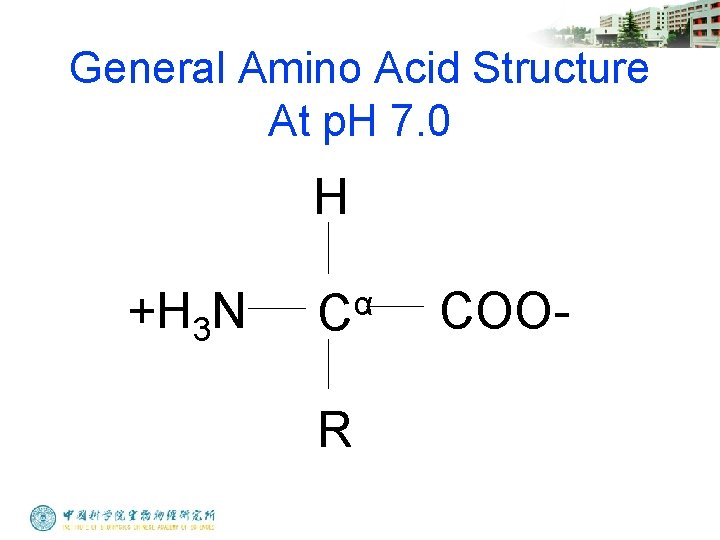
General Amino Acid Structure At p. H 7. 0 H +H 3 N α C R COO-
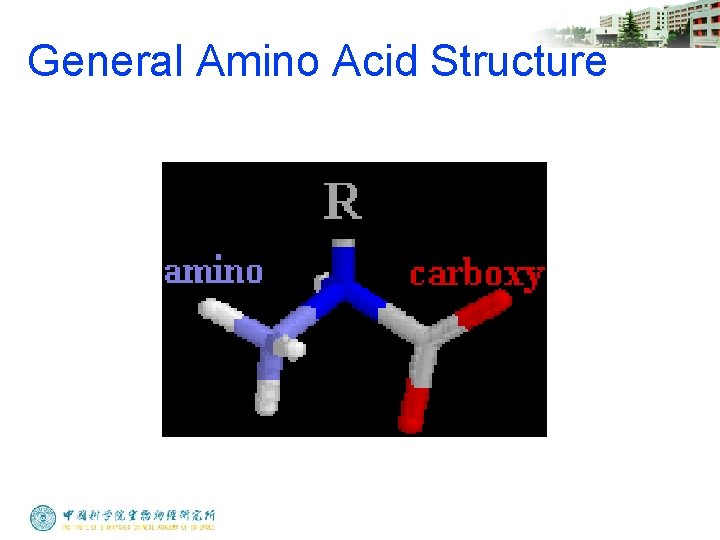
General Amino Acid Structure
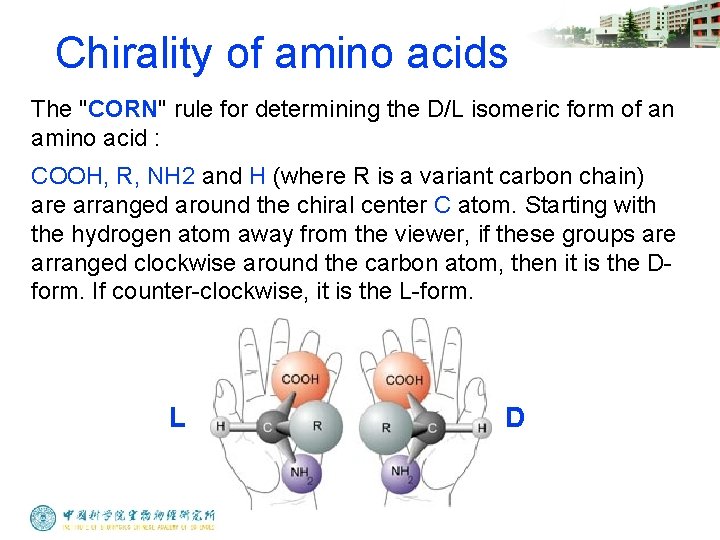
Chirality of amino acids The "CORN" rule for determining the D/L isomeric form of an amino acid : COOH, R, NH 2 and H (where R is a variant carbon chain) are arranged around the chiral center C atom. Starting with the hydrogen atom away from the viewer, if these groups are arranged clockwise around the carbon atom, then it is the Dform. If counter-clockwise, it is the L-form. L D
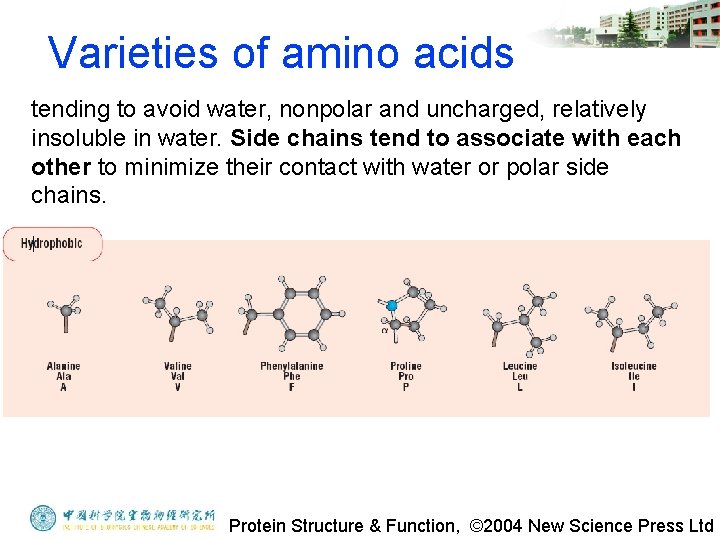
Varieties of amino acids tending to avoid water, nonpolar and uncharged, relatively insoluble in water. Side chains tend to associate with each other to minimize their contact with water or polar side chains. Protein Structure & Function, © 2004 New Science Press Ltd
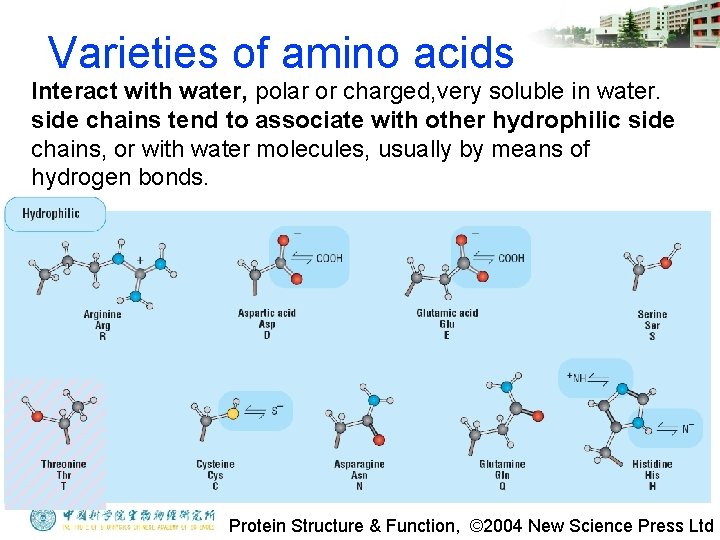
Varieties of amino acids Interact with water, polar or charged, very soluble in water. side chains tend to associate with other hydrophilic side chains, or with water molecules, usually by means of hydrogen bonds. Protein Structure & Function, © 2004 New Science Press Ltd
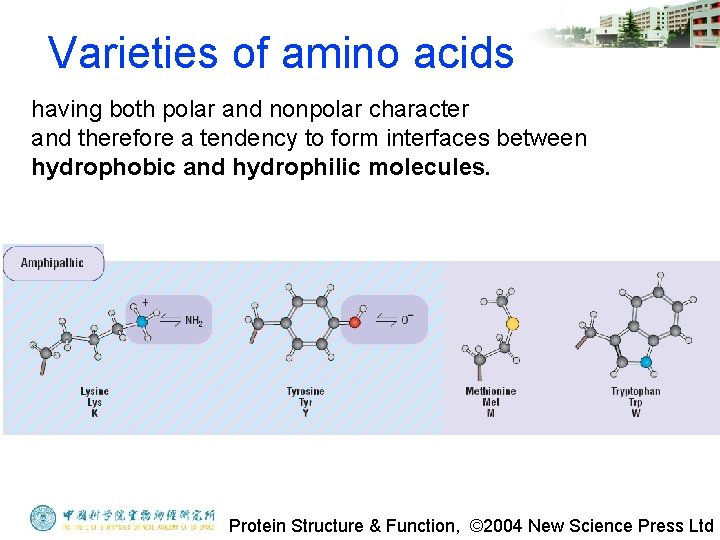
Varieties of amino acids having both polar and nonpolar character and therefore a tendency to form interfaces between hydrophobic and hydrophilic molecules. Protein Structure & Function, © 2004 New Science Press Ltd
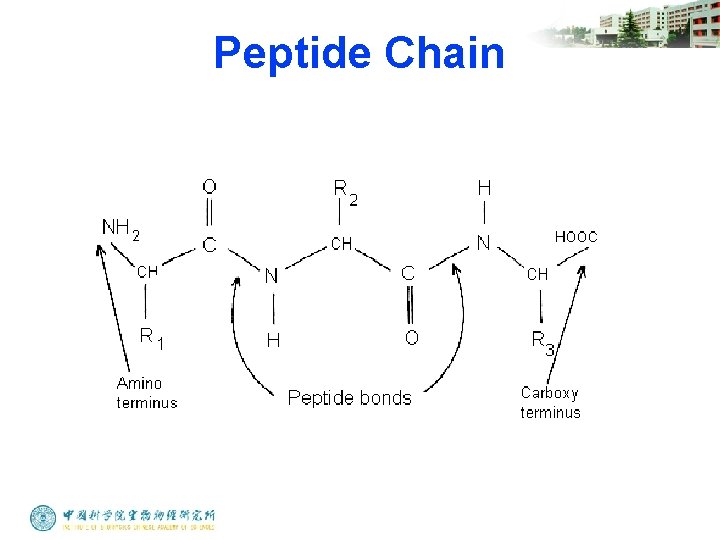
Peptide Chain
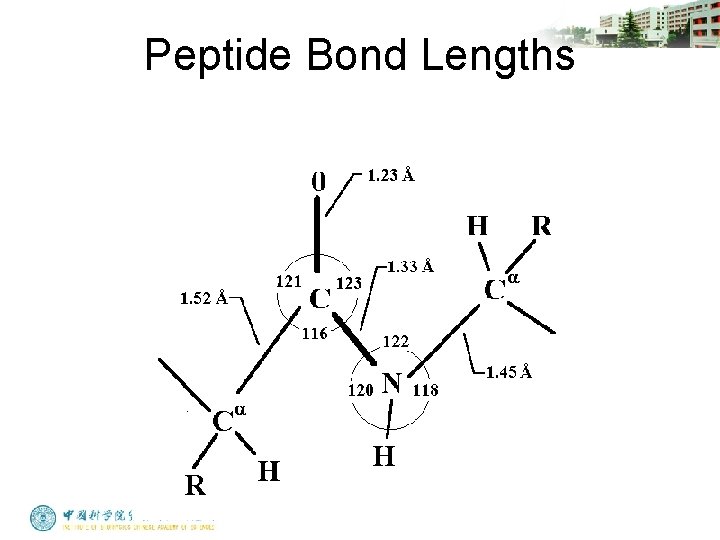
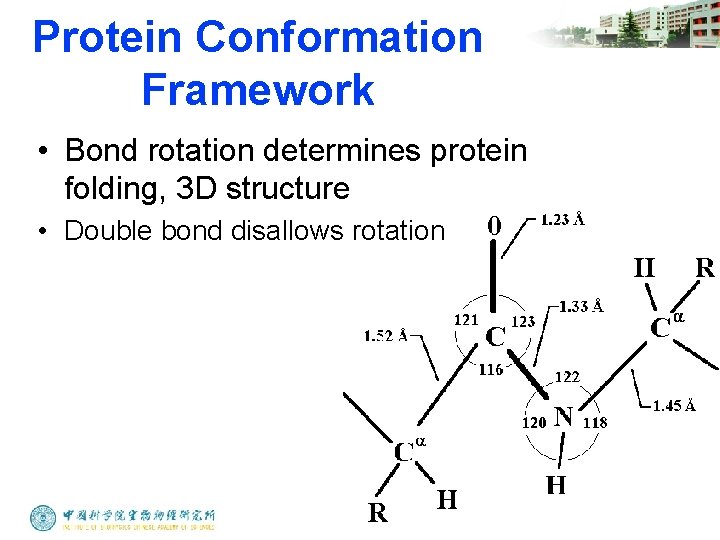
Peptide Bond Lengths
Protein Conformation Framework • Bond rotation determines protein folding, 3 D structure • Double bond disallows rotation
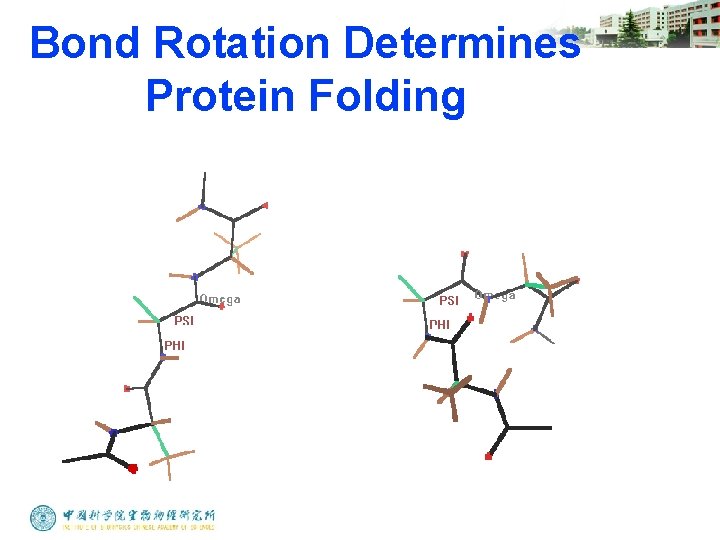
Bond Rotation Determines Protein Folding
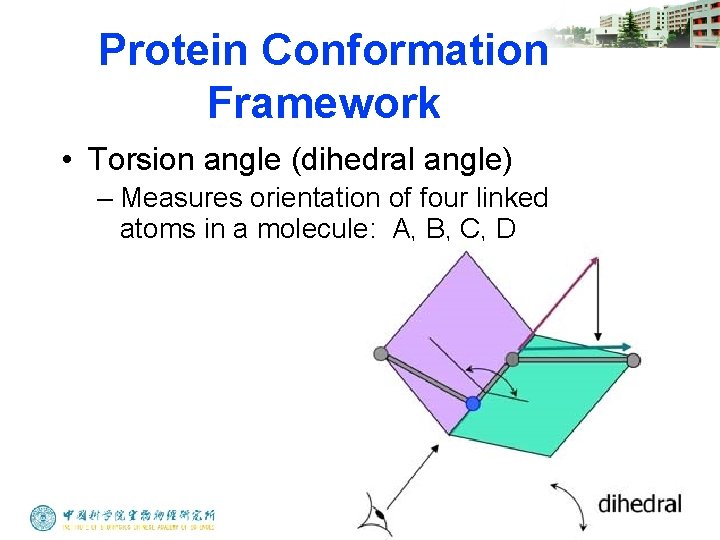
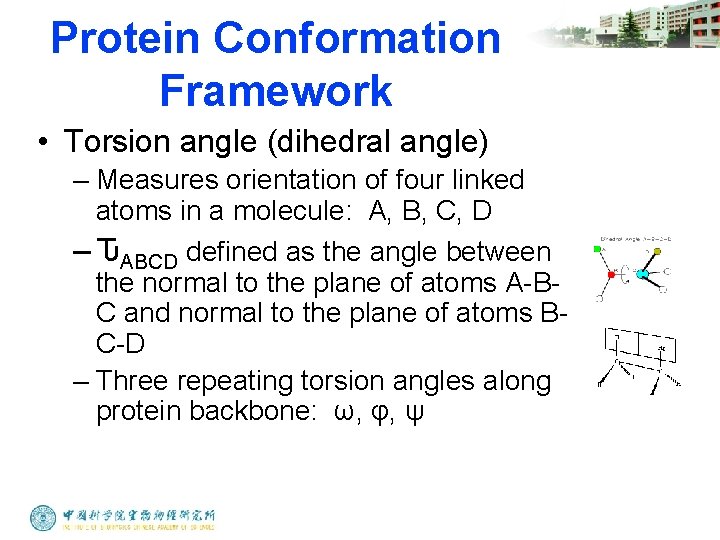
Protein Conformation Framework • Torsion angle (dihedral angle) – Measures orientation of four linked atoms in a molecule: A, B, C, D
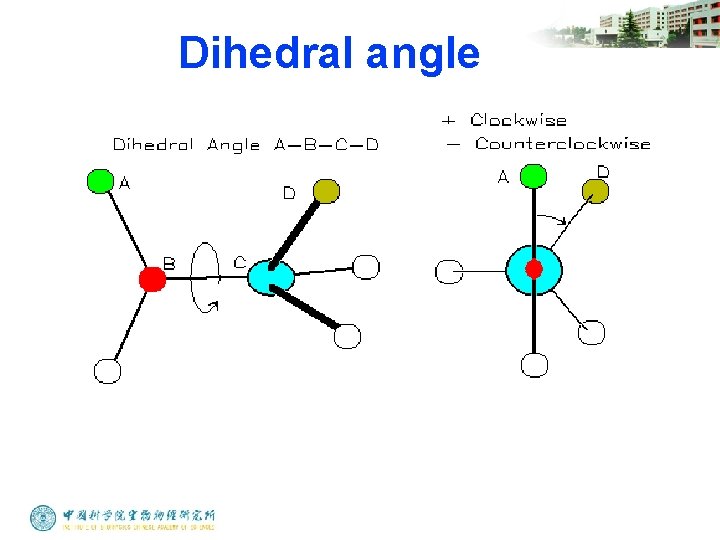
Dihedral angle
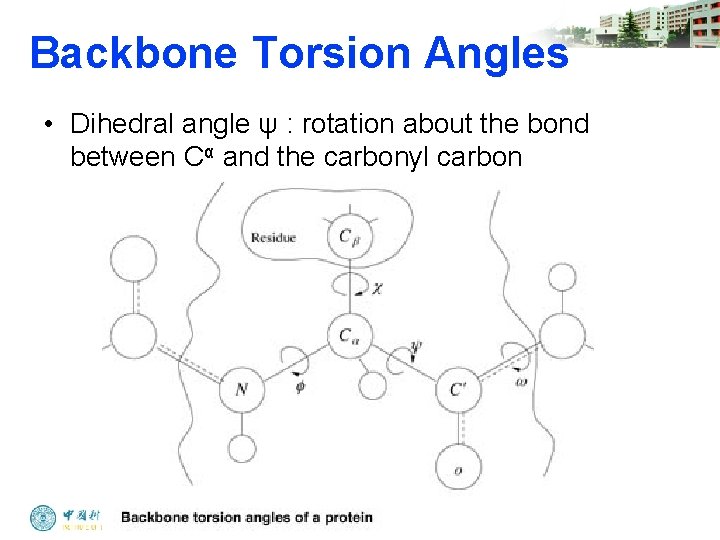
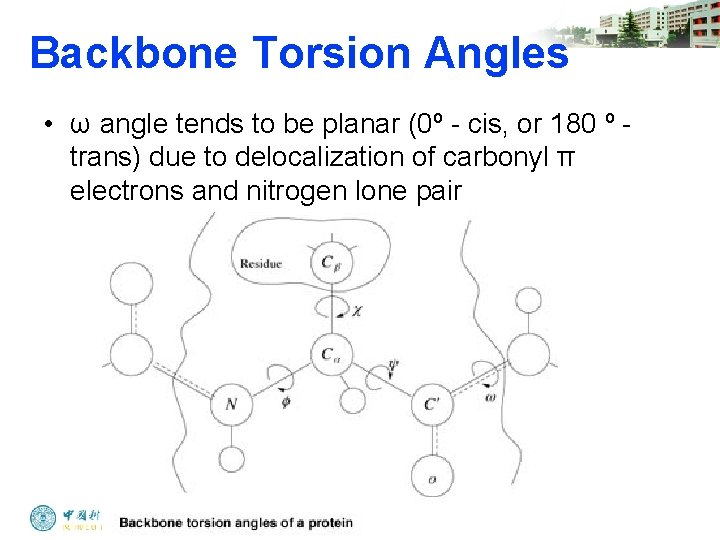
Protein Conformation Framework • Torsion angle (dihedral angle) – Measures orientation of four linked atoms in a molecule: A, B, C, D – ԎABCD defined as the angle between the normal to the plane of atoms A-BC and normal to the plane of atoms BC-D – Three repeating torsion angles along protein backbone: ω, φ, ψ
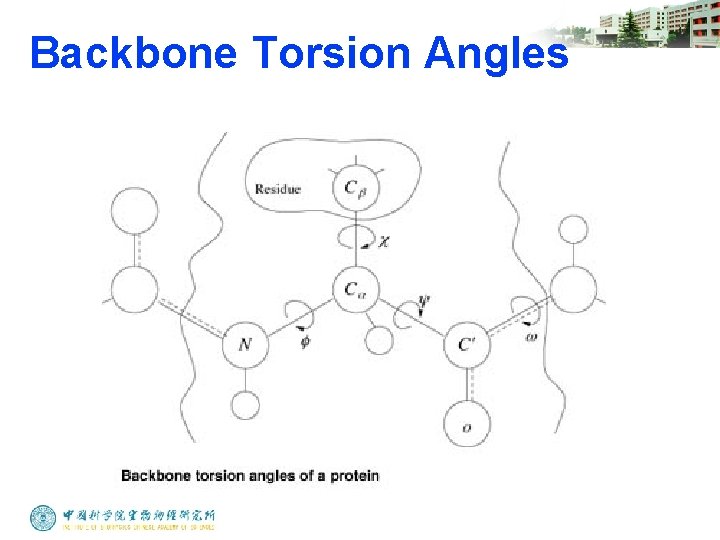
Backbone Torsion Angles
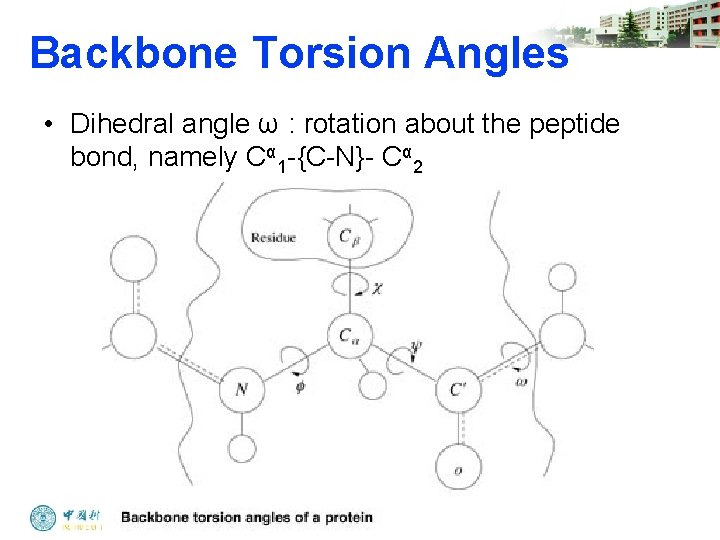
Backbone Torsion Angles • Dihedral angle ω : rotation about the peptide bond, namely Cα 1 -{C-N}- Cα 2
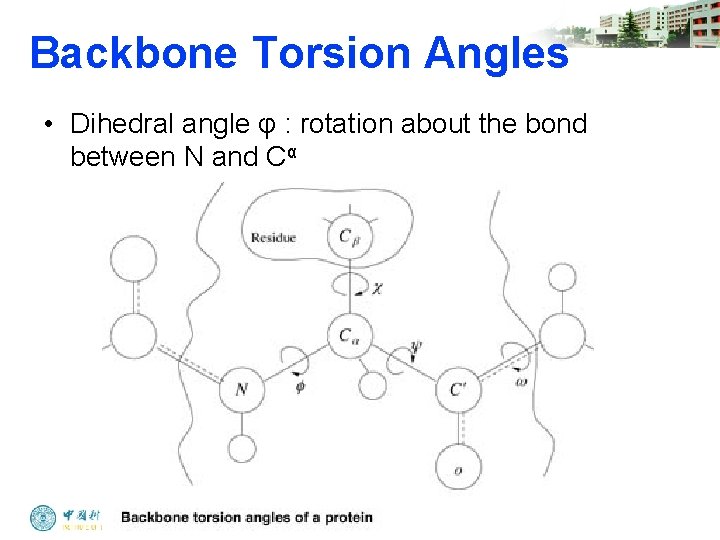
Backbone Torsion Angles • Dihedral angle φ : rotation about the bond between N and Cα
Backbone Torsion Angles • Dihedral angle ψ : rotation about the bond between Cα and the carbonyl carbon
Backbone Torsion Angles • ω angle tends to be planar (0º - cis, or 180 º - trans) due to delocalization of carbonyl π electrons and nitrogen lone pair
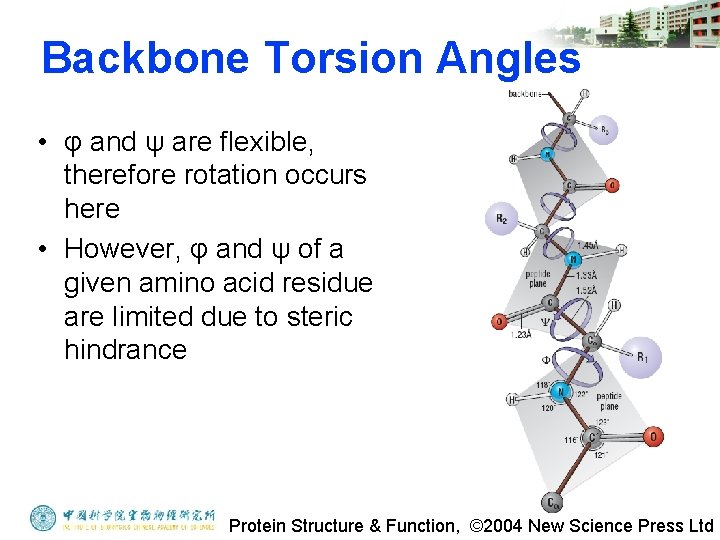
Backbone Torsion Angles • φ and ψ are flexible, therefore rotation occurs here • However, φ and ψ of a given amino acid residue are limited due to steric hindrance Protein Structure & Function, © 2004 New Science Press Ltd
Steric Hindrance • Interference to rotation caused by spatial arrangement of atoms within molecule • Atoms cannot overlap • Atom size defined by van der Waals radii • Electron clouds repel each other
G. N. Ramachandran • Used computer models of small polypeptides to systematically vary φ and ψ with the objective of finding stable conformations • For each conformation, the structure was examined for close contacts between atoms • Atoms were treated as hard spheres with dimensions corresponding to their van der Waals radii • Therefore, φ and ψ angles which cause spheres to collide correspond to sterically disallowed conformations of the polypeptide backbone • Only 10% of the {φ, ψ} combinations are generally observed for proteins • First noticed by G. N. Ramachandran
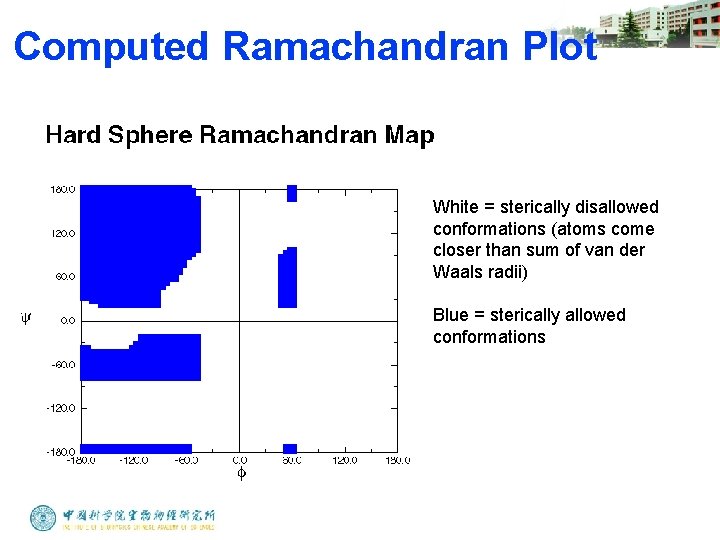
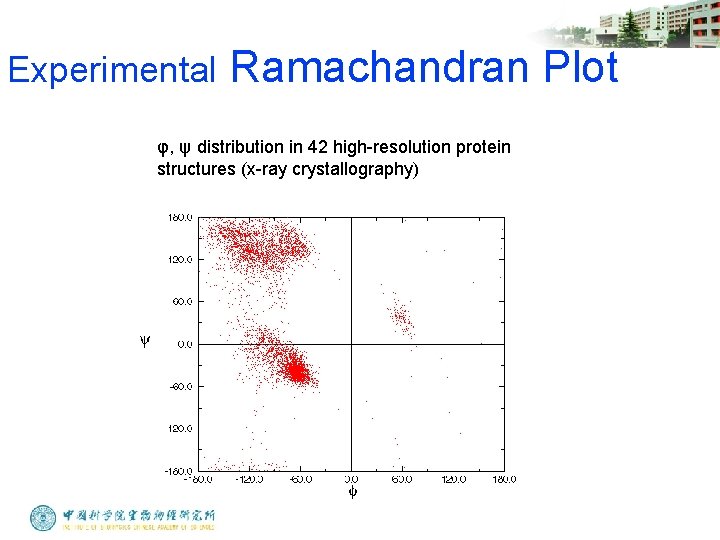
Ramachandran Plot • Plot of φ vs. ψ • The computed angles which are sterically allowed fall on certain regions of plot
Computed Ramachandran Plot White = sterically disallowed conformations (atoms come closer than sum of van der Waals radii) Blue = sterically allowed conformations
Experimental Ramachandran Plot φ, ψ distribution in 42 high-resolution protein structures (x-ray crystallography)
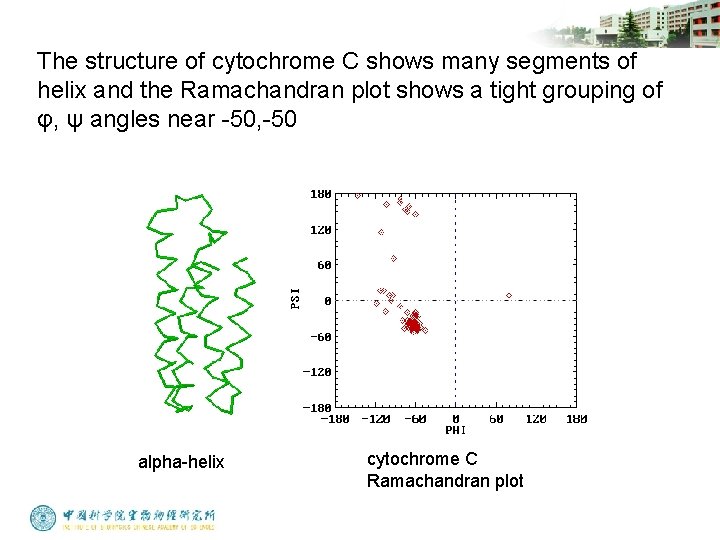
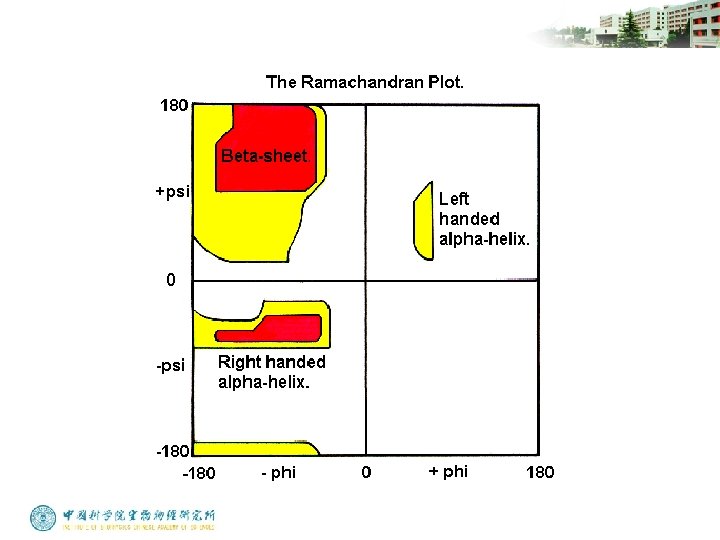
Ramachandran Plot And Secondary Structure • Repeating values of φ and ψ along the chain result in regular structure • For example, repeating values of φ ~ -57° and ψ ~ -47° give a right-handed helical fold (the alpha-helix)
The structure of cytochrome C shows many segments of helix and the Ramachandran plot shows a tight grouping of φ, ψ angles near -50, -50 alpha-helix cytochrome C Ramachandran plot
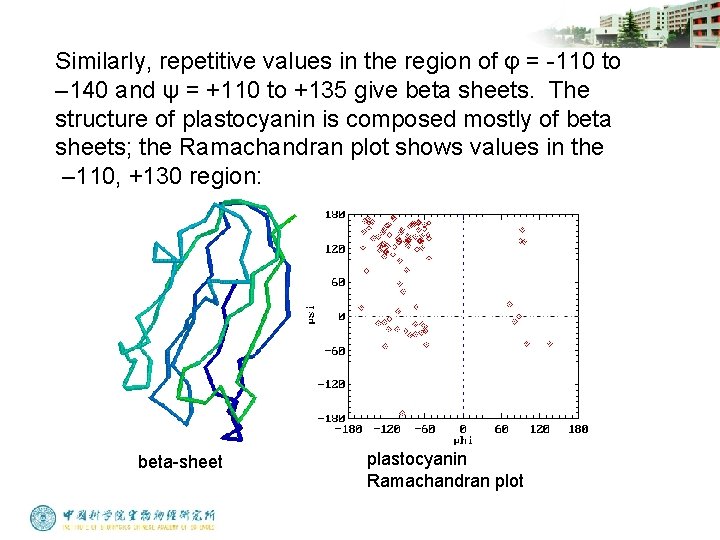
Similarly, repetitive values in the region of φ = -110 to – 140 and ψ = +110 to +135 give beta sheets. The structure of plastocyanin is composed mostly of beta sheets; the Ramachandran plot shows values in the – 110, +130 region: beta-sheet plastocyanin Ramachandran plot
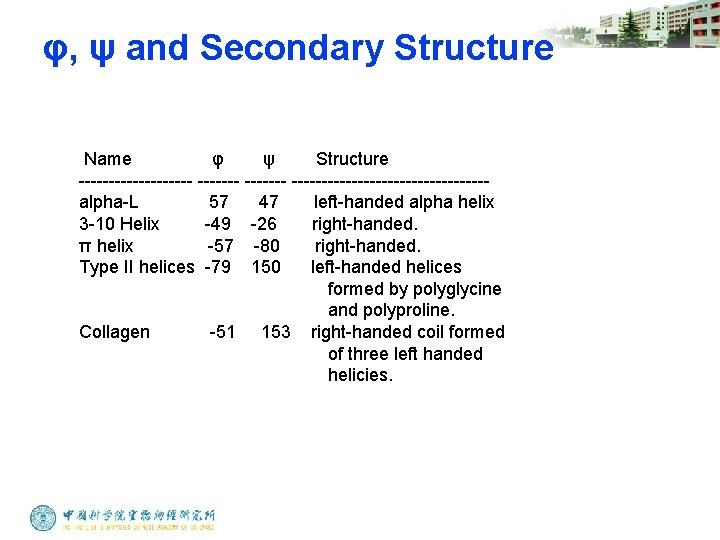
φ, ψ and Secondary Structure Name φ ψ Structure ---------- ----------------alpha-L 57 47 left-handed alpha helix 3 -10 Helix -49 -26 right-handed. π helix -57 -80 right-handed. Type II helices -79 150 left-handed helices formed by polyglycine and polyproline. Collagen -51 153 right-handed coil formed of three left handed helicies.
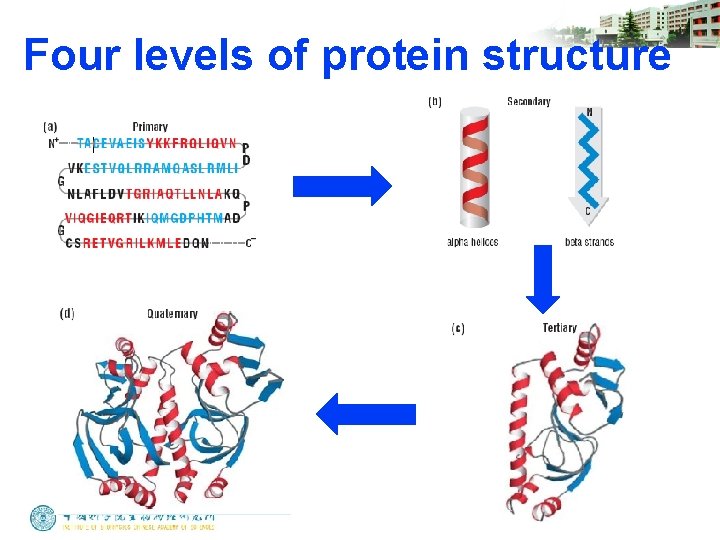
Four levels of protein structure
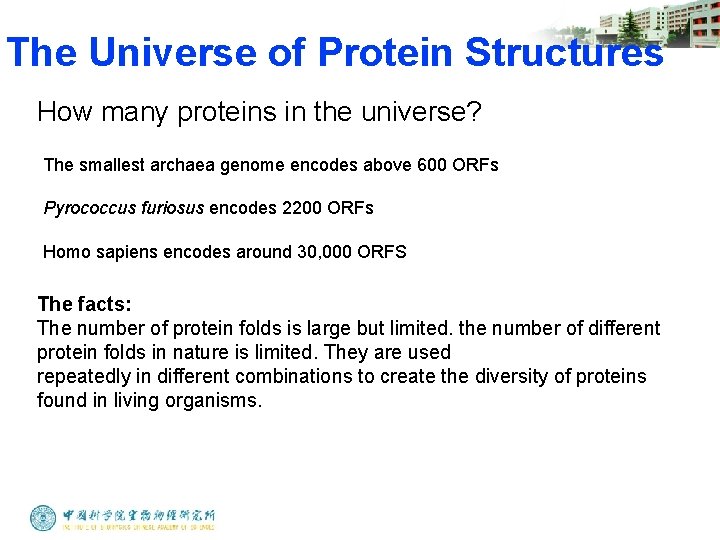
The Universe of Protein Structures How many proteins in the universe? The smallest archaea genome encodes above 600 ORFs Pyrococcus furiosus encodes 2200 ORFs Homo sapiens encodes around 30, 000 ORFS The facts: The number of protein folds is large but limited. the number of different protein folds in nature is limited. They are used repeatedly in different combinations to create the diversity of proteins found in living organisms.
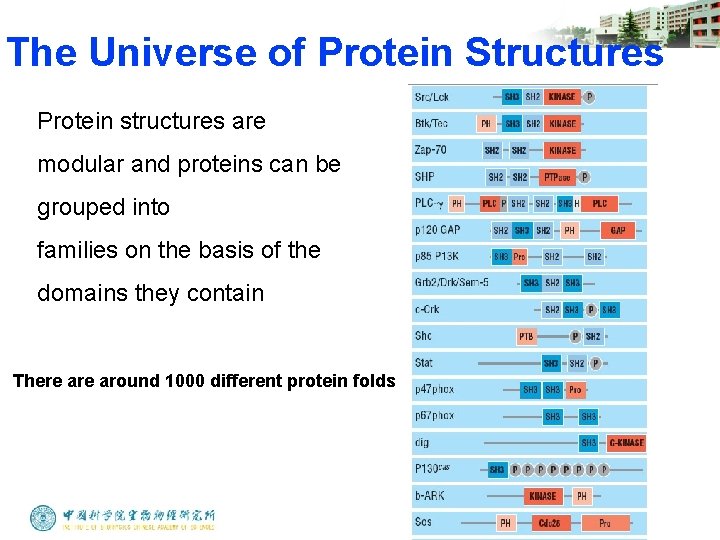
The Universe of Protein Structures Protein structures are modular and proteins can be grouped into families on the basis of the domains they contain There around 1000 different protein folds
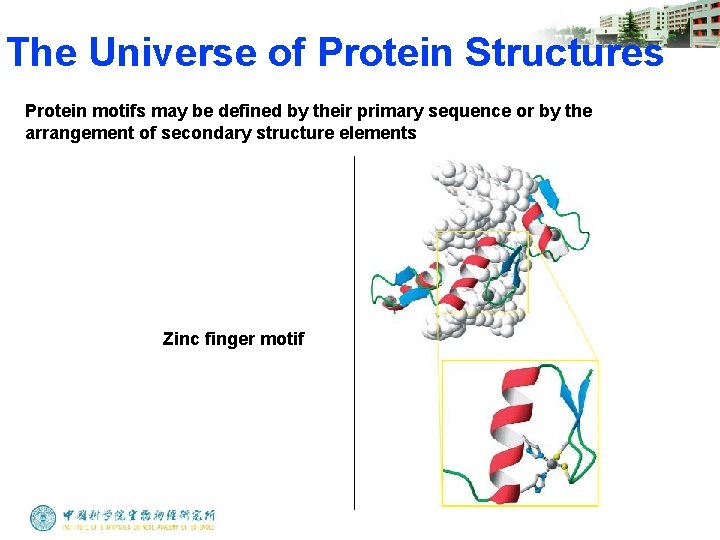
The Universe of Protein Structures Protein motifs may be defined by their primary sequence or by the arrangement of secondary structure elements Zinc finger motif
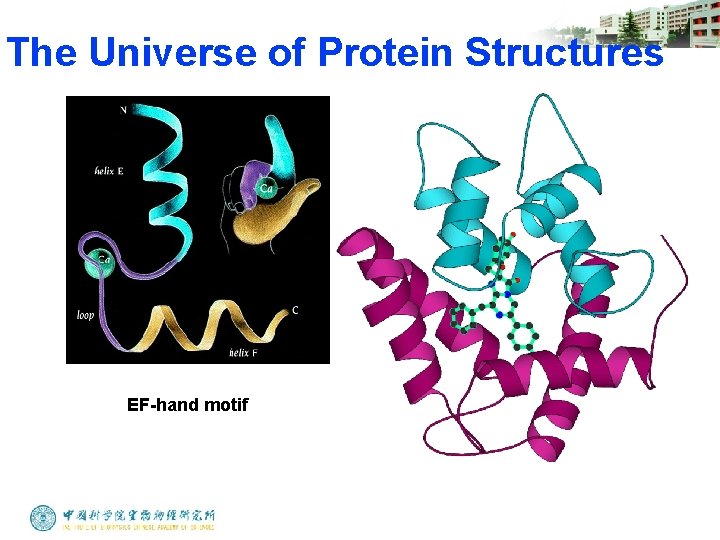
The Universe of Protein Structures EF-hand motif
Protein Function in Cell 1. Enzymes • Catalyze biological reactions 2. Structural role • • • Cell wall Cell membrane Cytoplasm
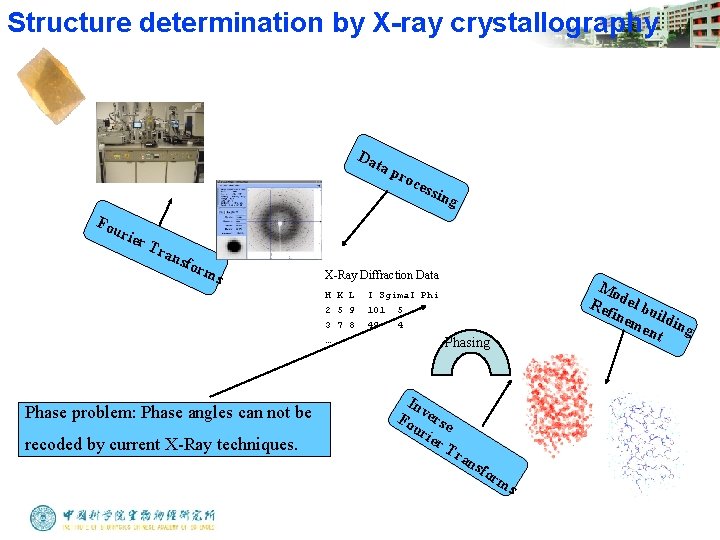
Structure determination by X-ray crystallography Da ta p Fou rier Tra nsf orm s recoded by current X-Ray techniques. ess in g X-Ray Diffraction Data H K L 2 5 9 3 7 8 … Phase problem: Phase angles can not be roc Mo Re del bu fin em ildin g ent I Sgima. I Phi 101 5 49 4 Phasing In v Fo erse ur ier T ran sfo rm s
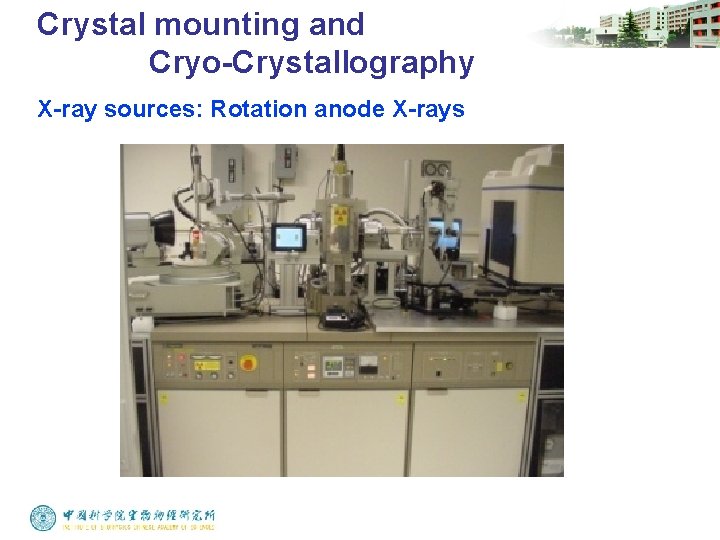
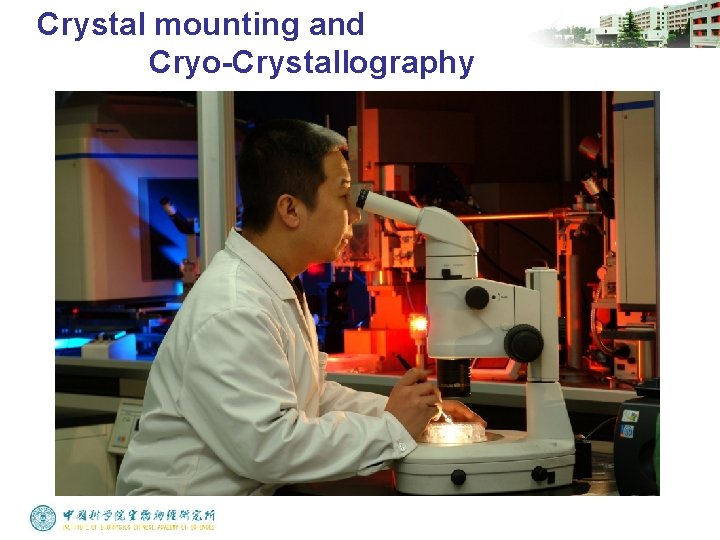
Crystal mounting and Cryo-Crystallography X-ray sources: Rotation anode X-rays
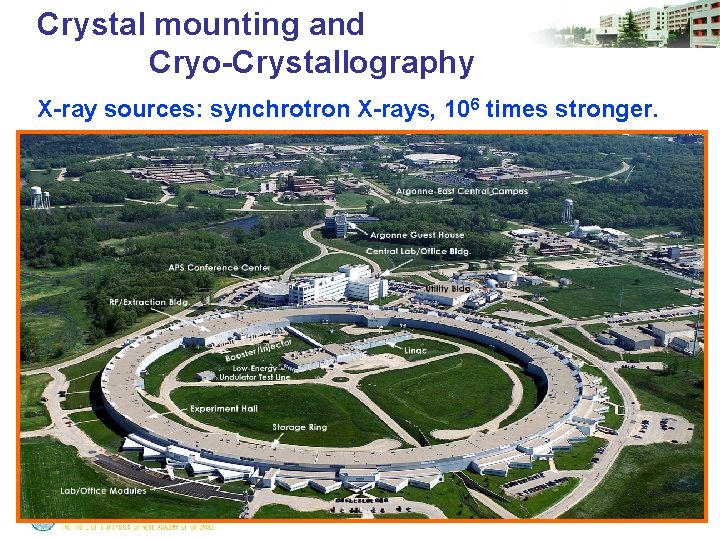
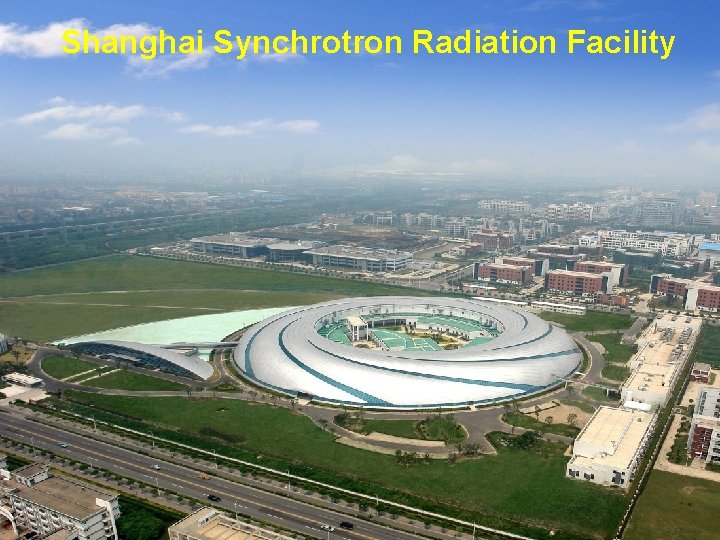
Crystal mounting and Cryo-Crystallography X-ray sources: synchrotron X-rays, 106 times stronger.
Shanghai Synchrotron Radiation Facility
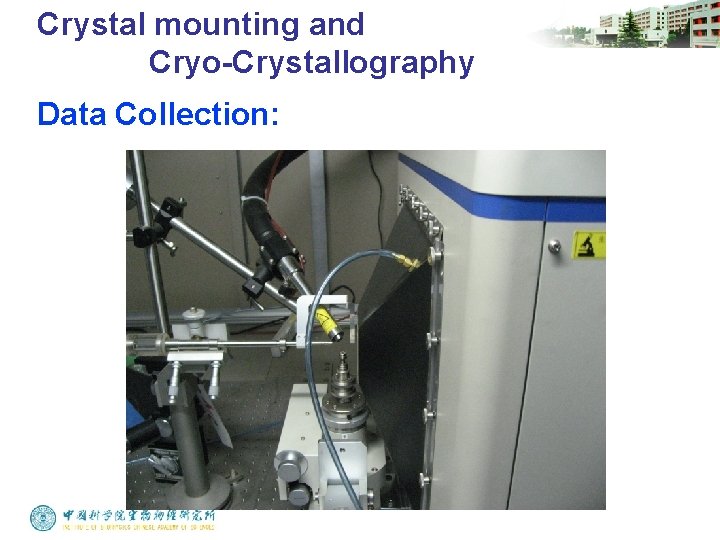
Crystal mounting and Cryo-Crystallography Data Collection:
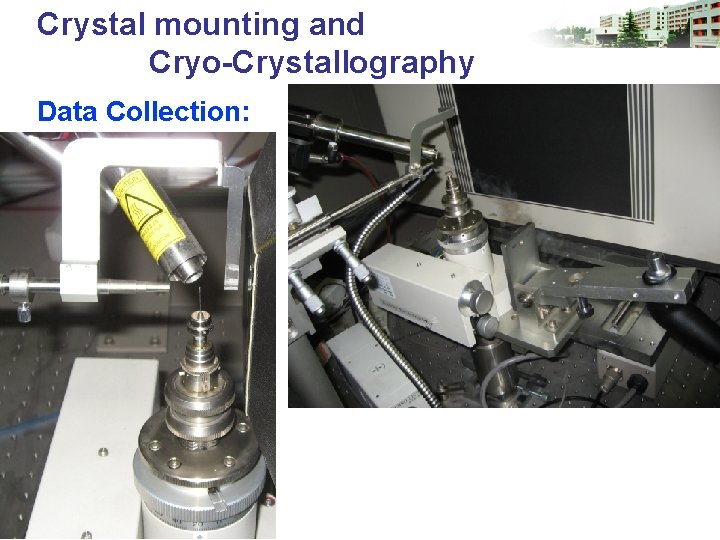
Crystal mounting and Cryo-Crystallography Data Collection:
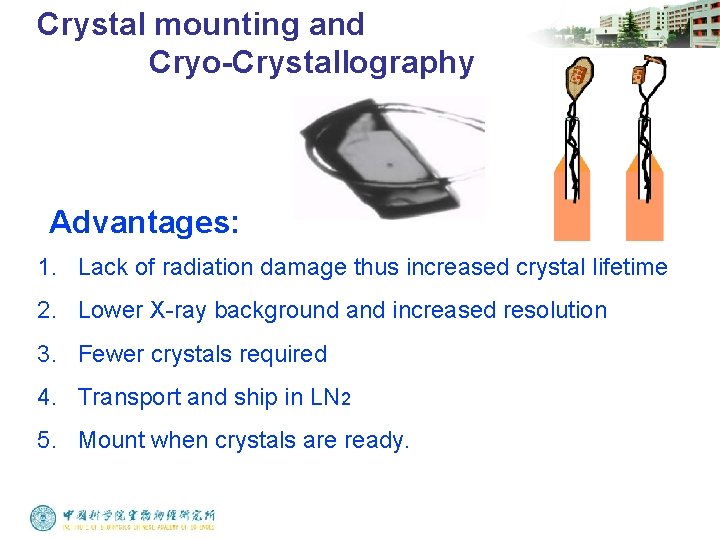
Crystal mounting and Cryo-Crystallography Advantages: 1. Lack of radiation damage thus increased crystal lifetime 2. Lower X-ray background and increased resolution 3. Fewer crystals required 4. Transport and ship in LN 2 5. Mount when crystals are ready.
Crystal mounting and Cryo-Crystallography
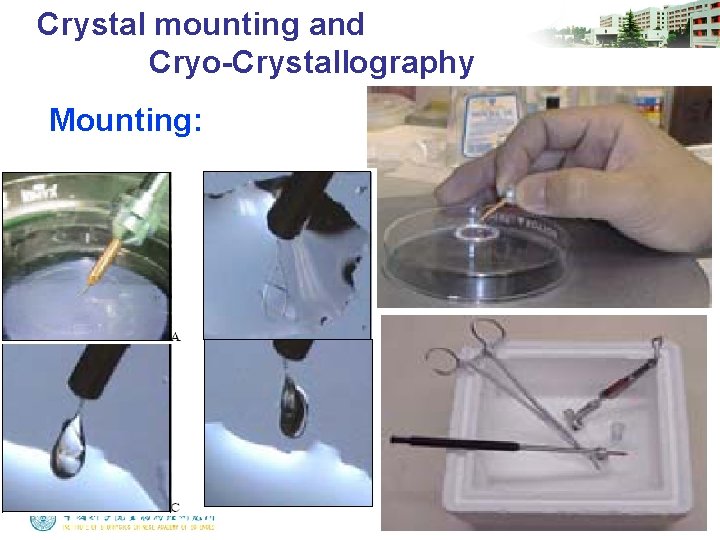
Crystal mounting and Cryo-Crystallography Mounting:
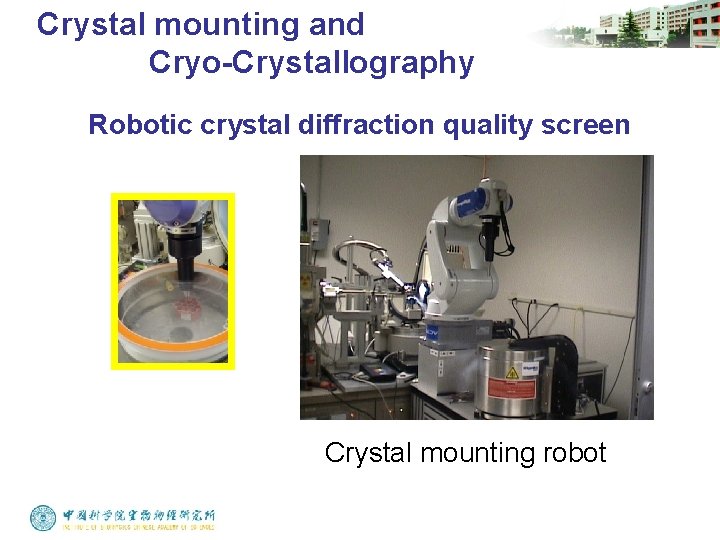
Crystal mounting and Cryo-Crystallography Robotic crystal diffraction quality screen Crystal mounting robot
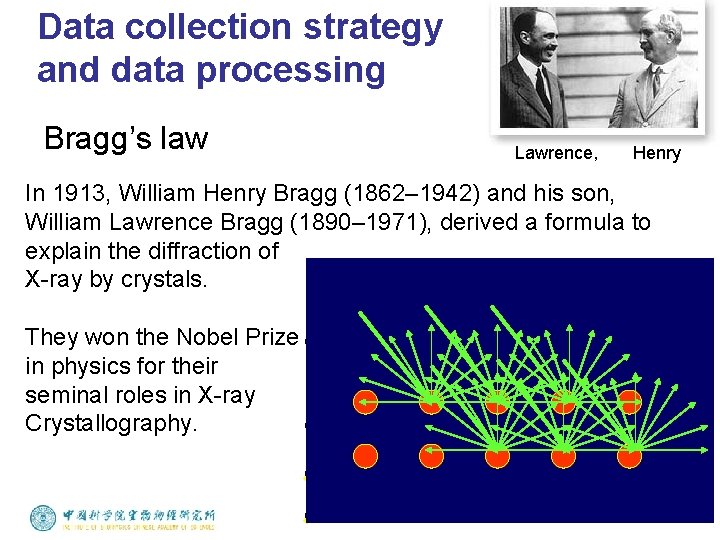
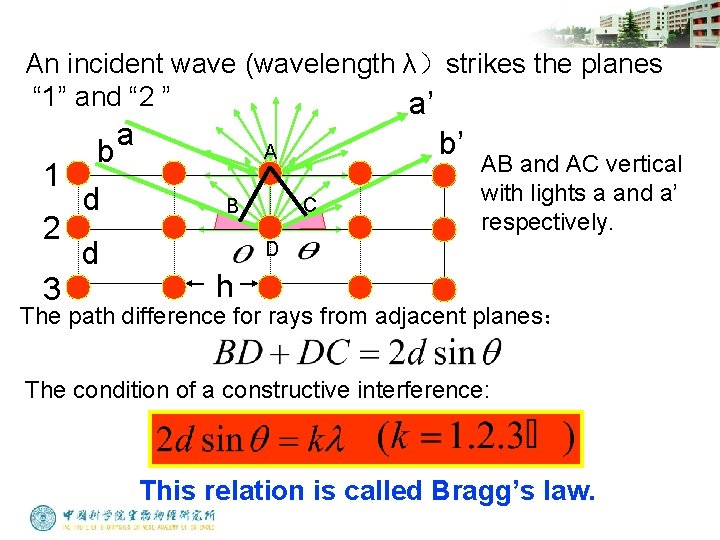
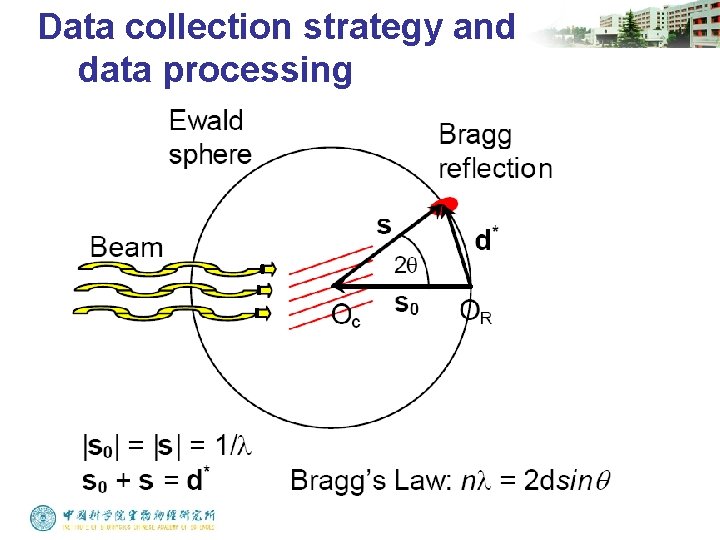
Data collection strategy and data processing Bragg’s law Lawrence, Henry In 1913, William Henry Bragg (1862– 1942) and his son, William Lawrence Bragg (1890– 1971), derived a formula to explain the diffraction of X-ray by crystals. They won the Nobel Prize in physics for their seminal roles in X-ray Crystallography.
An incident wave (wavelength λ)strikes the planes “ 1” and “ 2 ” a’ 1 2 3 b d d a b’ A C B AB and AC vertical with lights a and a’ respectively. D h The path difference for rays from adjacent planes: The condition of a constructive interference: This relation is called Bragg’s law.
Data collection strategy and data processing
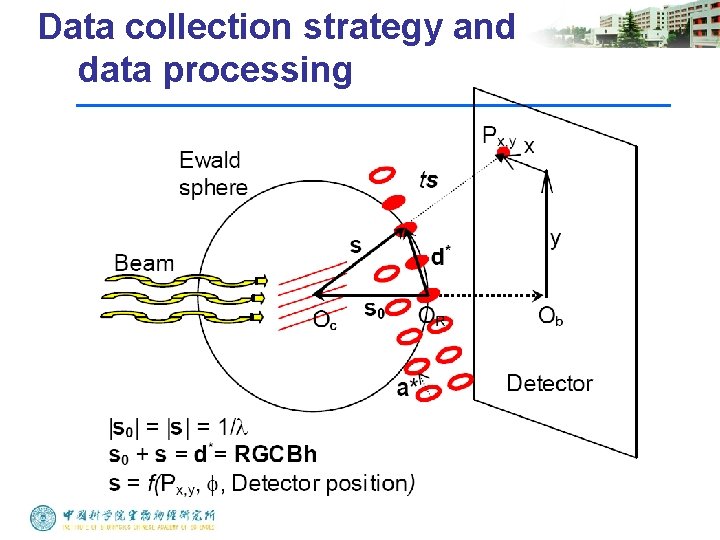
Data collection strategy and data processing
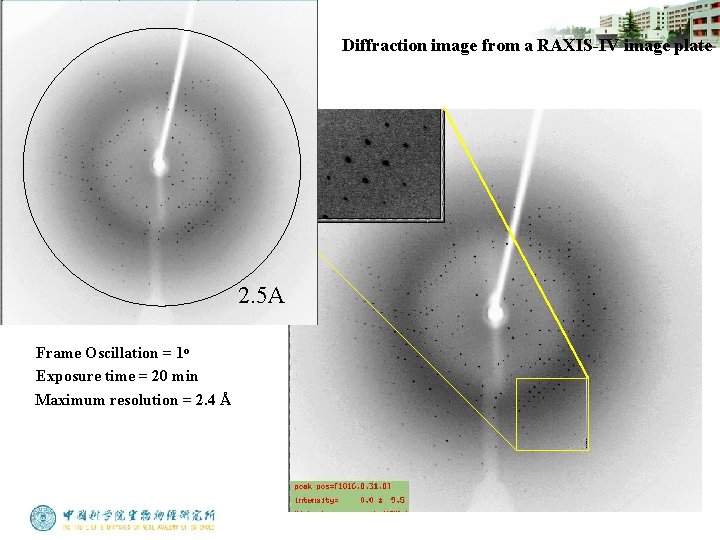
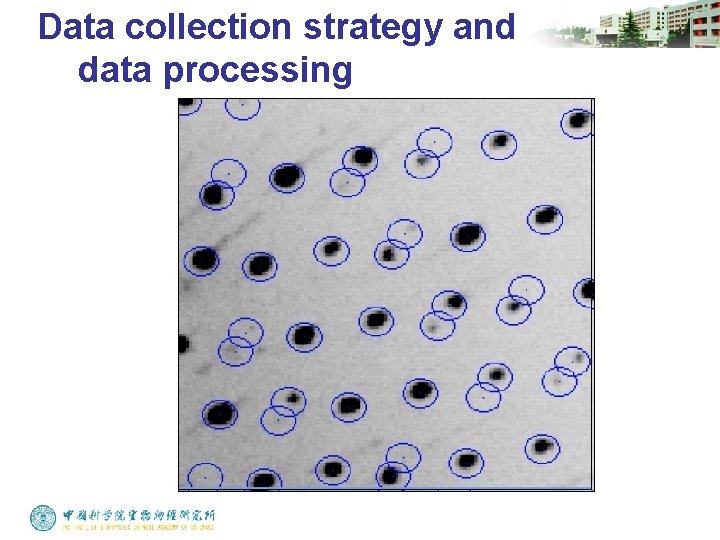
Diffraction image from a RAXIS-IV image plate 2. 5 A Frame Oscillation = 1 o Exposure time = 20 min Maximum resolution = 2. 4 Å
Data collection strategy and data processing
Data collection strategy and data processing
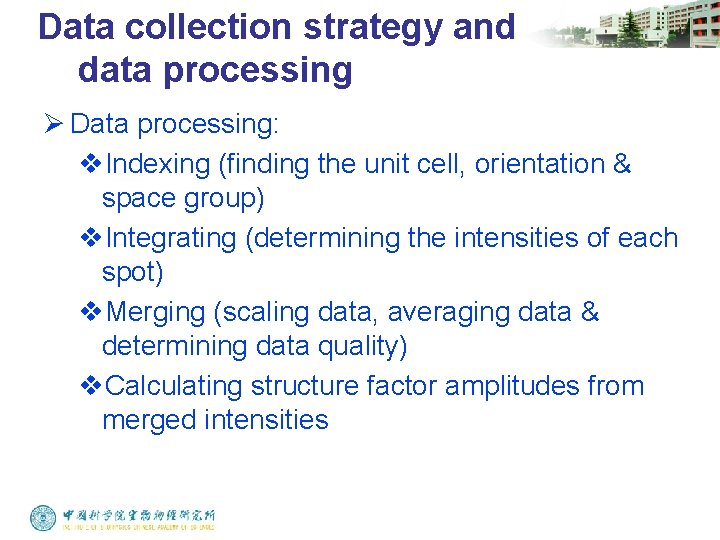
Data collection strategy and data processing Ø Data processing: v. Indexing (finding the unit cell, orientation & space group) v. Integrating (determining the intensities of each spot) v. Merging (scaling data, averaging data & determining data quality) v. Calculating structure factor amplitudes from merged intensities
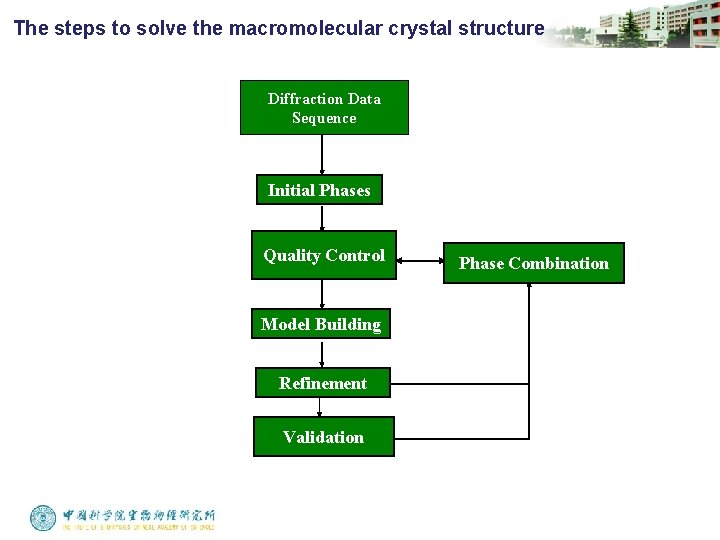
The steps to solve the macromolecular crystal structure Diffraction Data Sequence Initial Phases Quality Control Model Building Refinement Validation Phase Combination
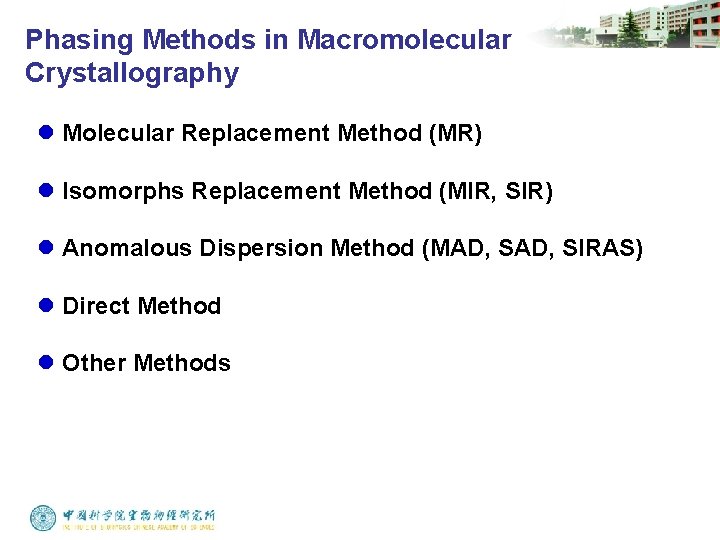
Phasing Methods in Macromolecular Crystallography l Molecular Replacement Method (MR) l Isomorphs Replacement Method (MIR, SIR) l Anomalous Dispersion Method (MAD, SIRAS) l Direct Method l Other Methods
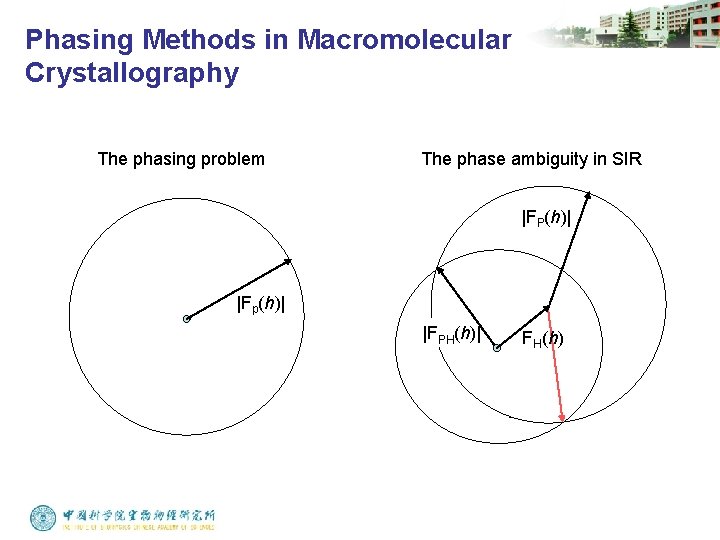
Phasing Methods in Macromolecular Crystallography The phasing problem The phase ambiguity in SIR |FP(h)| |Fp(h)| |FPH(h)| FH(h)
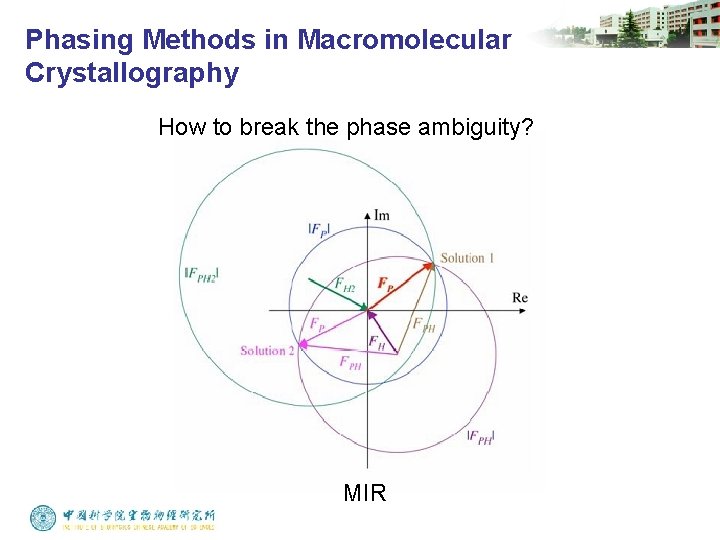
Phasing Methods in Macromolecular Crystallography How to break the phase ambiguity? MIR
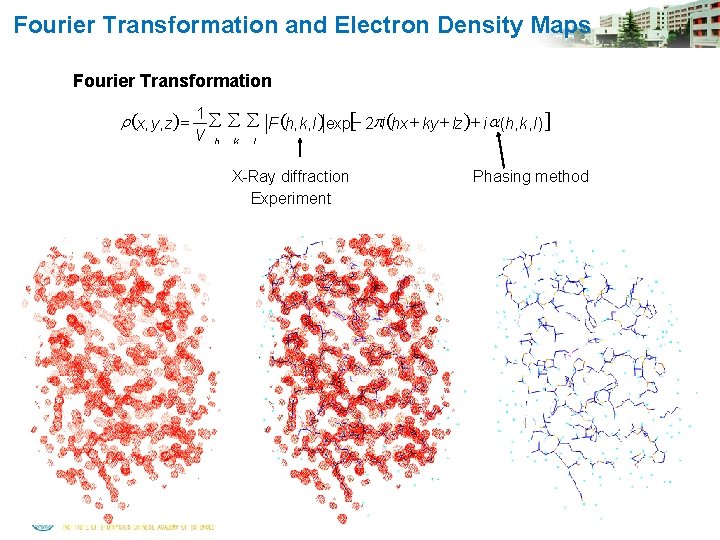
Fourier Transformation and Electron Density Maps Fourier Transformation r (x, y, z) = 1 å å å F (h, k, l )exp[- 2 pi (hx + ky + lz)+ i a (h, k, l )] V h k l X-Ray diffraction Experiment Phasing method
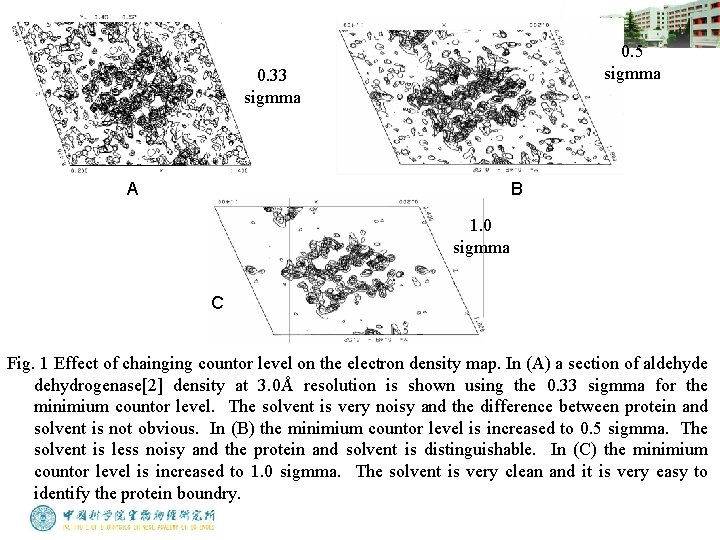
0. 5 sigmma 0. 33 sigmma A B 1. 0 sigmma C Fig. 1 Effect of chainging countor level on the electron density map. In (A) a section of aldehyde dehydrogenase[2] density at 3. 0Å resolution is shown using the 0. 33 sigmma for the minimium countor level. The solvent is very noisy and the difference between protein and solvent is not obvious. In (B) the minimium countor level is increased to 0. 5 sigmma. The solvent is less noisy and the protein and solvent is distinguishable. In (C) the minimium countor level is increased to 1. 0 sigmma. The solvent is very clean and it is very easy to identify the protein boundry.
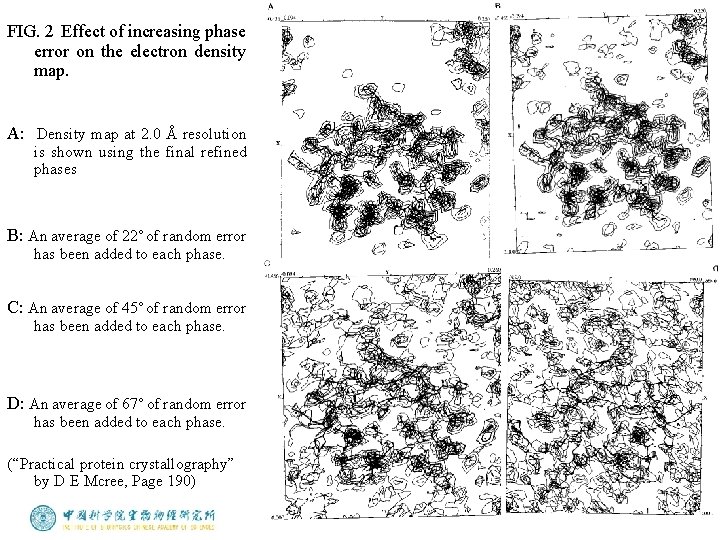
FIG. 2 Effect of increasing phase error on the electron density map. A: Density map at 2. 0 Å resolution is shown using the final refined phases B: An average of 22˚ of random error has been added to each phase. C: An average of 45˚ of random error has been added to each phase. D: An average of 67˚ of random error has been added to each phase. (“Practical protein crystallography” by D E Mcree, Page 190)
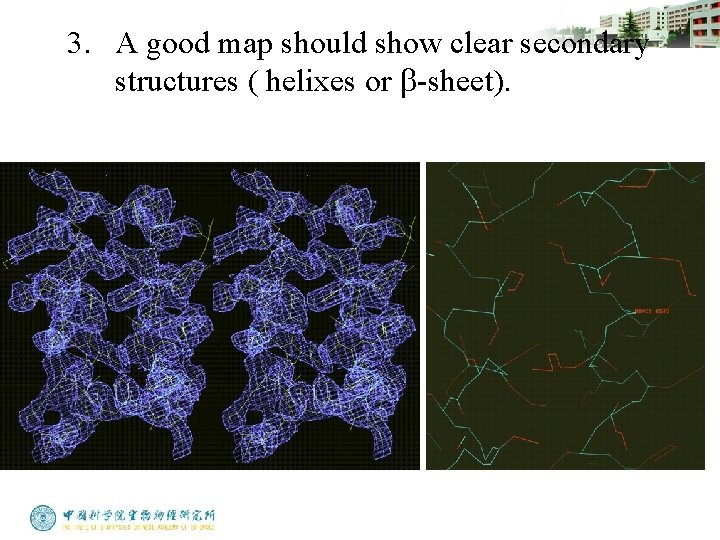
3. A good map should show clear secondary structures ( helixes or b-sheet).
Model Building: Steps in making the first trace in electron density map (1). Generating Ca chain trace. The only rule one has to observe is that the distance between Ca atoms of adjacent residues is always approximately 3. 8 Å. Try to look for large pieces of secondary structure, such as helices and sheets, to start the Ca trace.
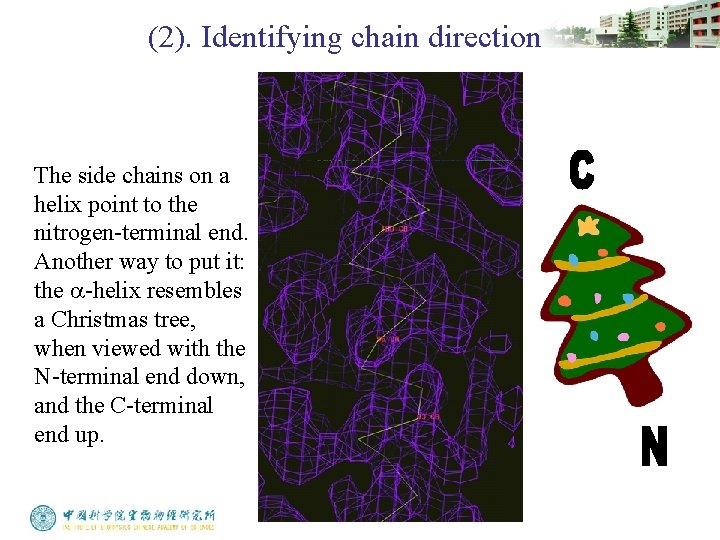
(2). Identifying chain direction The side chains on a helix point to the nitrogen-terminal end. Another way to put it: the a-helix resembles a Christmas tree, when viewed with the N-terminal end down, and the C-terminal end up.
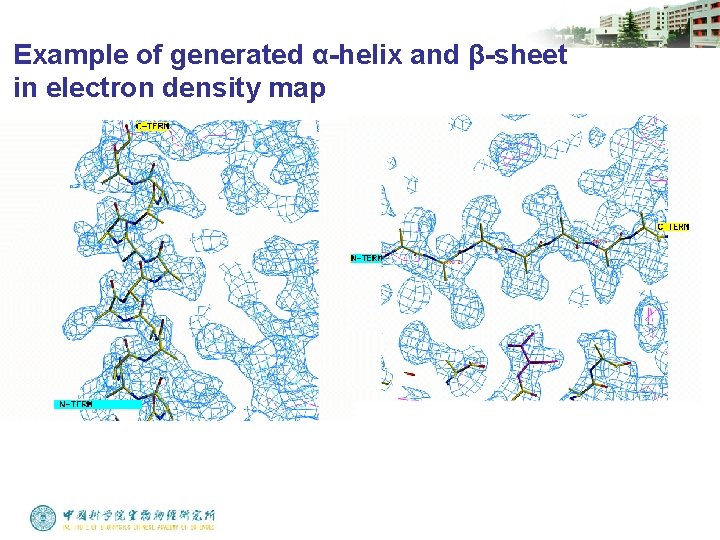
(3). Generating main chain trace Main chain can be automatically generated from a well traced Ca chain by many computer programs. In helices, the side chain positions are so highly constrained that you can accurately predict the main chain and Cb atom positions with a refined a-helix from another protein.
Example of generated α-helix and β-sheet in electron density map
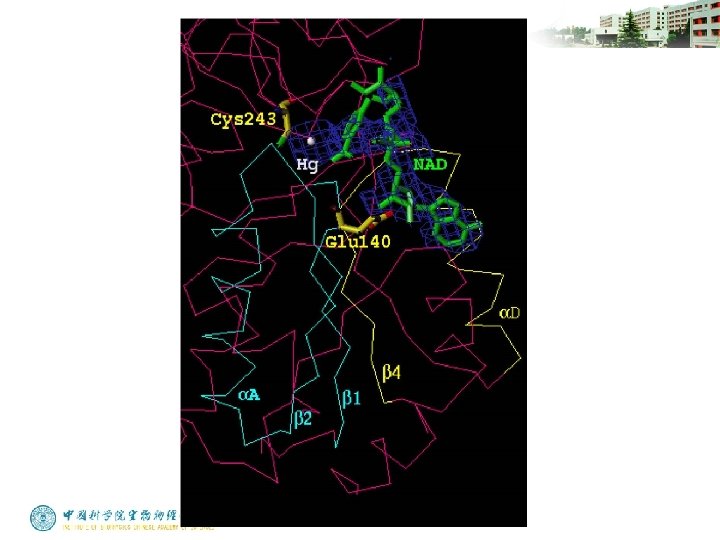
(4). Fitting the chemical sequence. Finding the first match of sequence to the map is a milestone in structure determination. Some tips are listed below: Heavy atoms bind to some specific residues. Hg-Cys, Pt-Met Start the fitting from a well defined main chain trace where the density should be clear and rich in side chain information. These regions are often located inside the molecule.
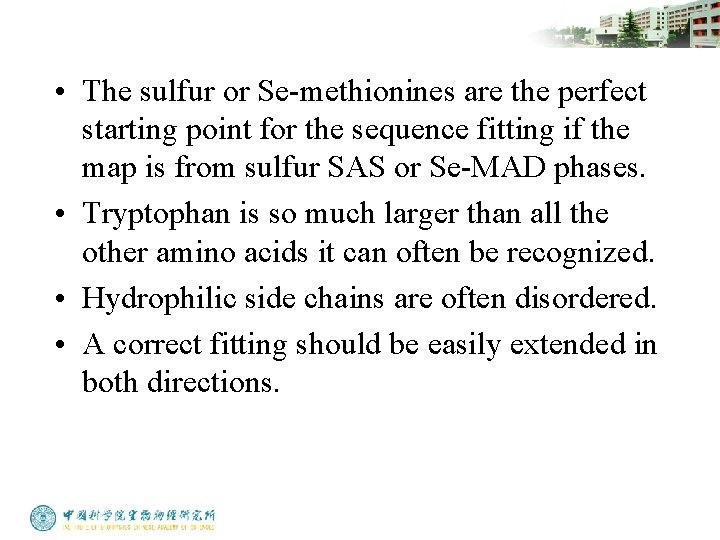
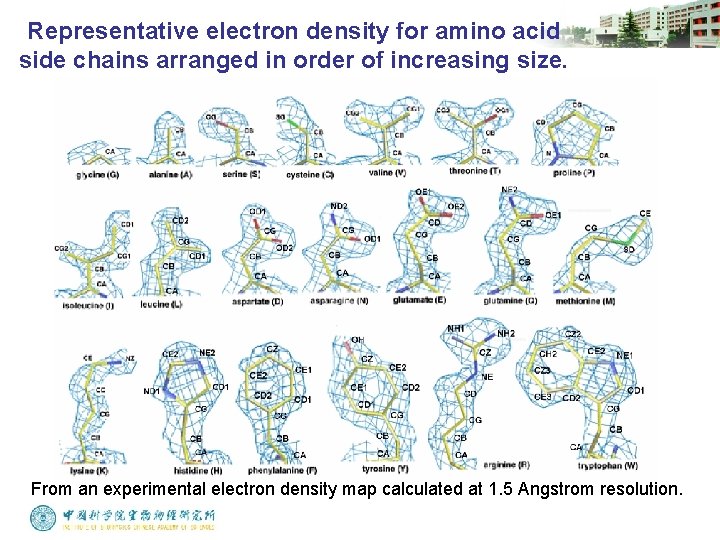
• The sulfur or Se-methionines are the perfect starting point for the sequence fitting if the map is from sulfur SAS or Se-MAD phases. • Tryptophan is so much larger than all the other amino acids it can often be recognized. • Hydrophilic side chains are often disordered. • A correct fitting should be easily extended in both directions.
Representative electron density for amino acid side chains arranged in order of increasing size. From an experimental electron density map calculated at 1. 5 Angstrom resolution.
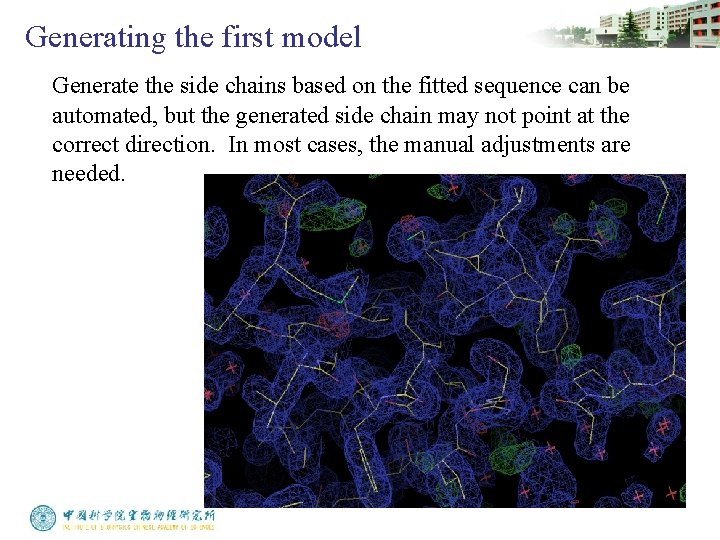
Generating the first model Generate the side chains based on the fitted sequence can be automated, but the generated side chain may not point at the correct direction. In most cases, the manual adjustments are needed.
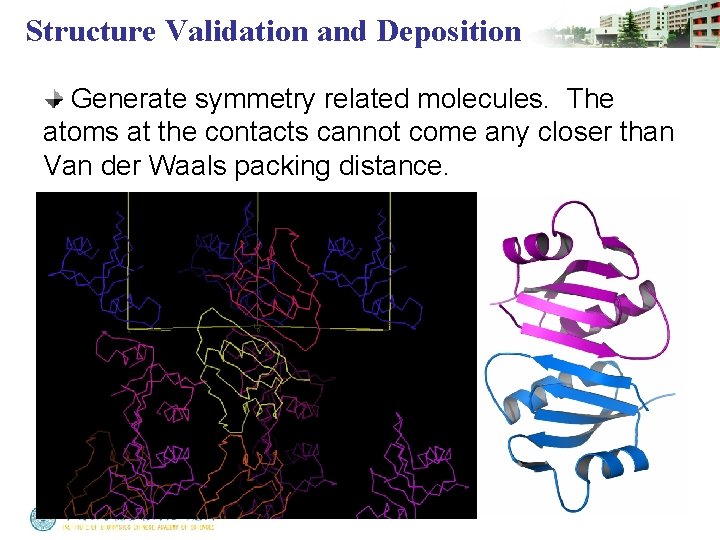
Structure Validation and Deposition Generate symmetry related molecules. The atoms at the contacts cannot come any closer than Van der Waals packing distance.
Structure Validation and Deposition • The side chains should fit the electron density map all over the whole molecule. If the fitting suddenly becomes bad in some region, it may indicate that something wrong with the fitting. • Missing density is much better than extra density. It’s rarely seen that there is a blob of extra density for Gly, Ala or Pro residue. • The model should make chemical sense and satisfy all that is known about the macromolecule.
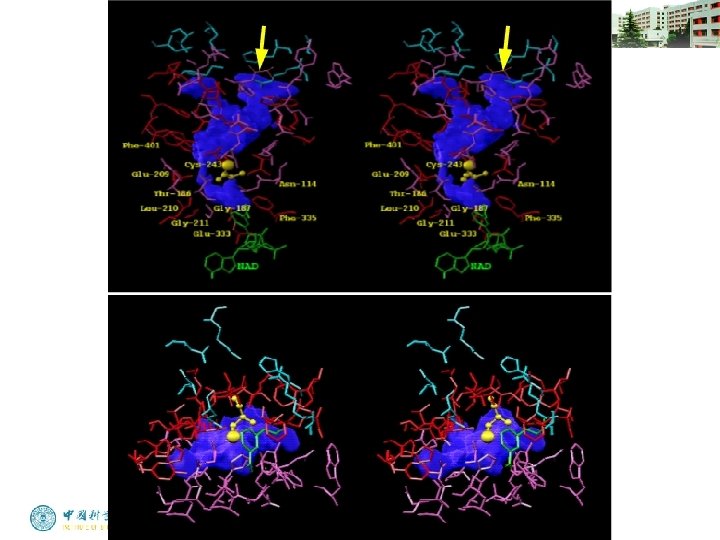
Structure Validation and Deposition • It may be useful to evaluate the overall distribution of some residues, such as hydrophobic residues, glycine, and proline. • If certain residues have been identified as being in the active site, are they close together in the model?
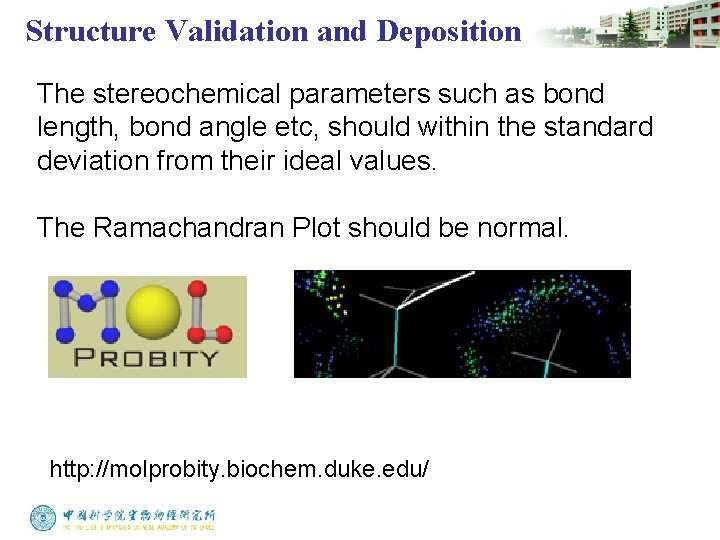
Structure Validation and Deposition The stereochemical parameters such as bond length, bond angle etc, should within the standard deviation from their ideal values. The Ramachandran Plot should be normal. http: //molprobity. biochem. duke. edu/
Structure Validation and Deposition Atomic coordinates should be deposited to Protein Data Bank http: //www. pdb. org