
Motif Finding Continued Xiaole Shirley Liu STAT 115

- Slides: 39
Motif Finding Continued Xiaole Shirley Liu STAT 115, STAT 215, BIO 298, BIST 520
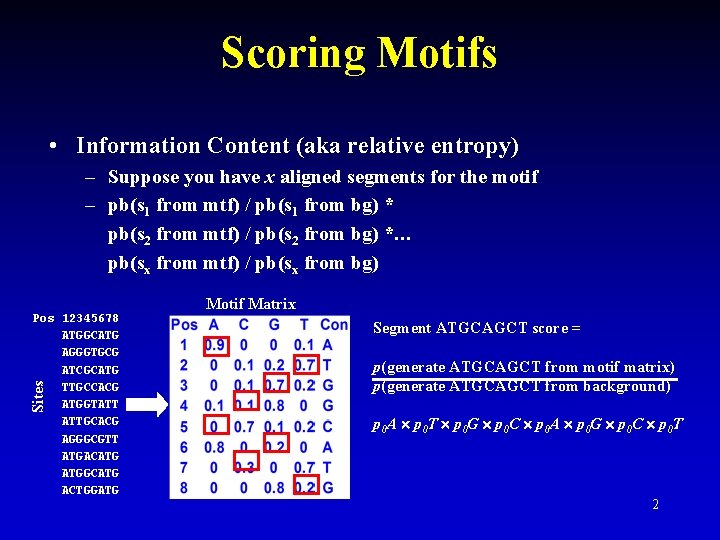
Scoring Motifs • Information Content (aka relative entropy) – Suppose you have x aligned segments for the motif – pb(s 1 from mtf) / pb(s 1 from bg) * pb(s 2 from mtf) / pb(s 2 from bg) *… pb(sx from mtf) / pb(sx from bg) Sites Pos 12345678 ATGGCATG AGGGTGCG ATCGCATG TTGCCACG ATGGTATT ATTGCACG AGGGCGTT ATGACATG ATGGCATG ACTGGATG Motif Matrix Segment ATGCAGCT score = p(generate ATGCAGCT from motif matrix) p(generate ATGCAGCT from background) p 0 A p 0 T p 0 G p 0 C p 0 A p 0 G p 0 C p 0 T 2
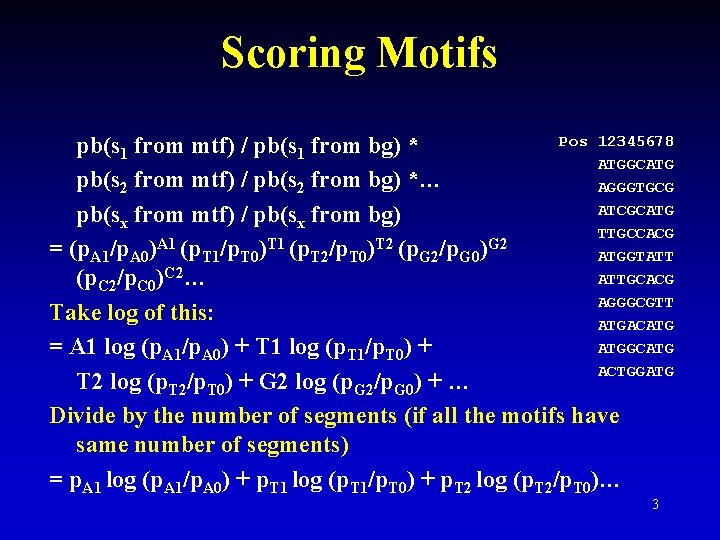
Scoring Motifs Pos 12345678 pb(s 1 from mtf) / pb(s 1 from bg) * ATGGCATG pb(s 2 from mtf) / pb(s 2 from bg) *… AGGGTGCG ATCGCATG pb(sx from mtf) / pb(sx from bg) TTGCCACG A 1 T 2 G 2 = (p. A 1/p. A 0) (p. T 1/p. T 0) (p. T 2/p. T 0) (p. G 2/p. G 0) ATGGTATT ATTGCACG (p. C 2/p. C 0)C 2… AGGGCGTT Take log of this: ATGACATG ATGGCATG = A 1 log (p. A 1/p. A 0) + T 1 log (p. T 1/p. T 0) + ACTGGATG T 2 log (p. T 2/p. T 0) + G 2 log (p. G 2/p. G 0) + … Divide by the number of segments (if all the motifs have same number of segments) = p. A 1 log (p. A 1/p. A 0) + p. T 1 log (p. T 1/p. T 0) + p. T 2 log (p. T 2/p. T 0)… 3
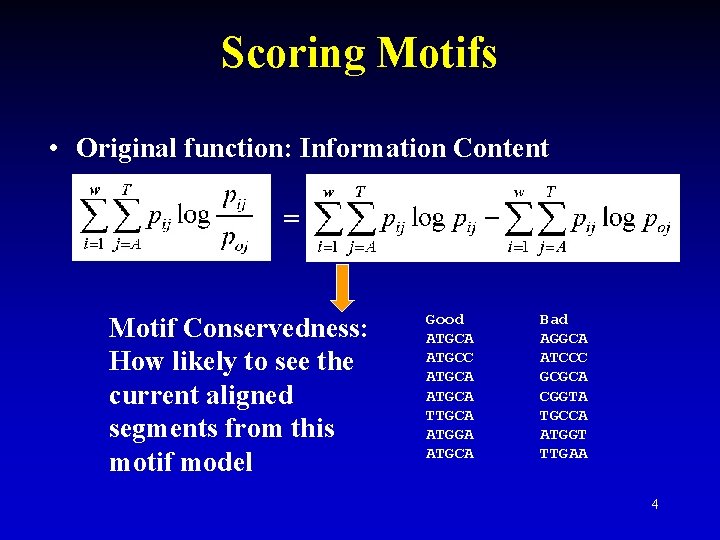
Scoring Motifs • Original function: Information Content = Motif Conservedness: How likely to see the current aligned segments from this motif model Good ATGCA ATGCC ATGCA TTGCA ATGGA ATGCA Bad AGGCA ATCCC GCGCA CGGTA TGCCA ATGGT TTGAA 4
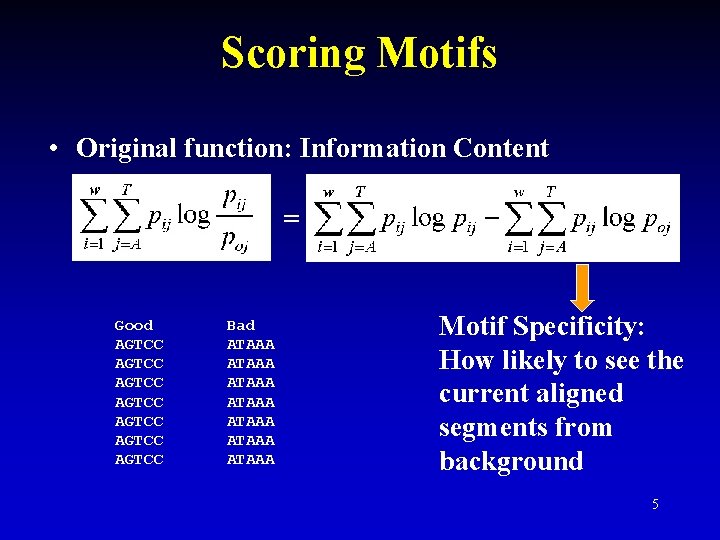
Scoring Motifs • Original function: Information Content = Good AGTCC AGTCC Bad ATAAA ATAAA Motif Specificity: How likely to see the current aligned segments from background 5
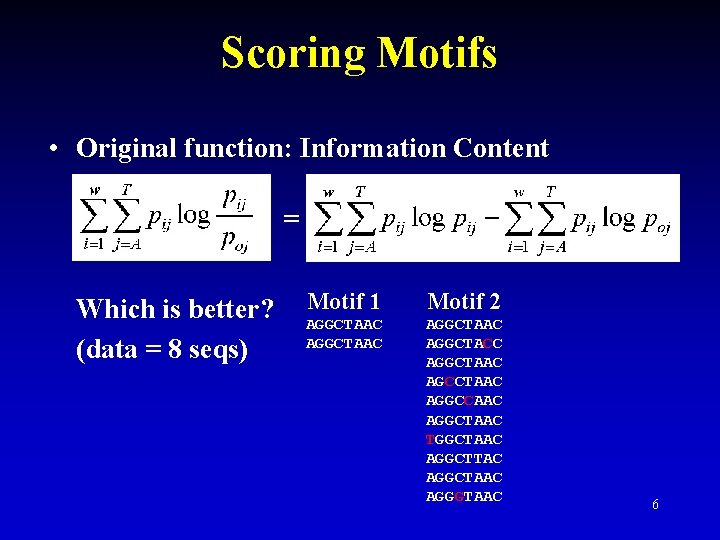
Scoring Motifs • Original function: Information Content = Which is better? (data = 8 seqs) Motif 1 Motif 2 AGGCTAAC AGGCTACC AGGCTAAC AGCCTAAC AGGCCAAC AGGCTAAC TGGCTAAC AGGCTTAC AGGCTAAC AGGGTAAC 6
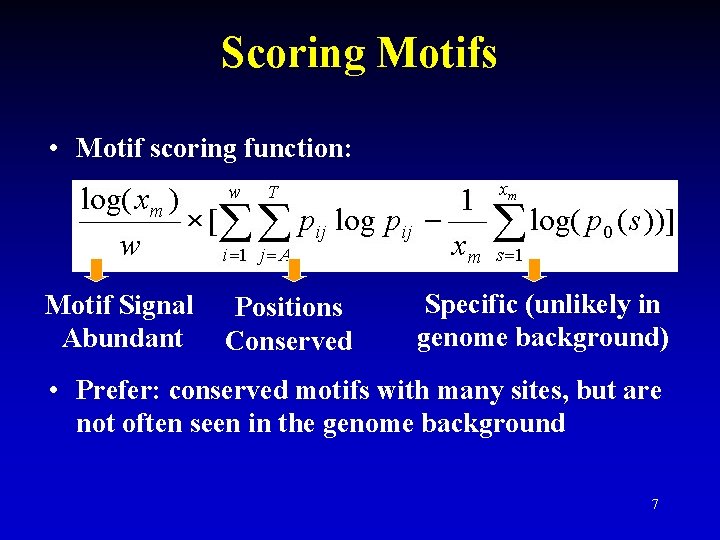
Scoring Motifs • Motif scoring function: Motif Signal Abundant Positions Conserved Specific (unlikely in genome background) • Prefer: conserved motifs with many sites, but are not often seen in the genome background 7
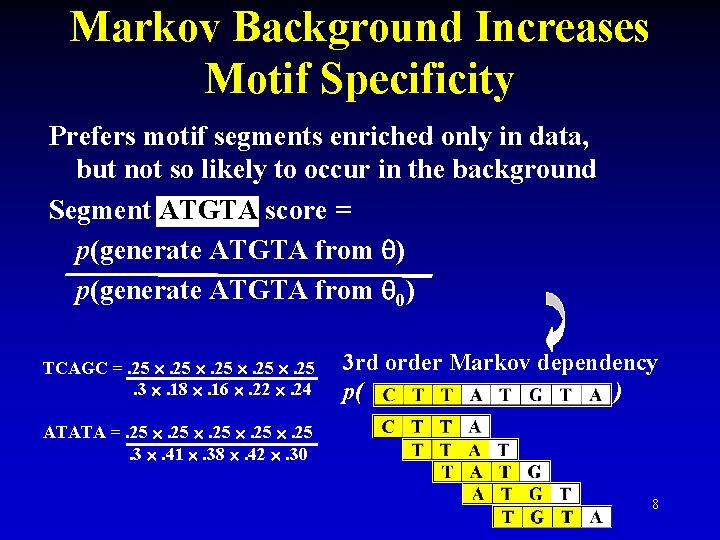
Markov Background Increases Motif Specificity Prefers motif segments enriched only in data, but not so likely to occur in the background Segment ATGTA score = p(generate ATGTA from ) p(generate ATGTA from 0) TCAGC =. 25 . 25. 3 . 18 . 16 . 22 . 24 3 rd order Markov dependency p( ) ATATA =. 25 . 25. 3 . 41 . 38 . 42 . 30 8
Position Weight Matrix Update • Advantage – Can look for motifs of any widths – Flexible with base substitutions • Disadvantage: – EM and Gibbs sampling: no guaranteed convergence time – No guaranteed global optimum Break 9
Motif Finding in Lower Eukaryotes • Upstream sequences longer (500 -1000 bp), with some simple repeats • Motif width varies (5 – 17 bases) • Expression clusters provide decent input sequences quality for TF motif finding • Motif combination and redundancy appears, although single motifs are usually significant enough for identification 10
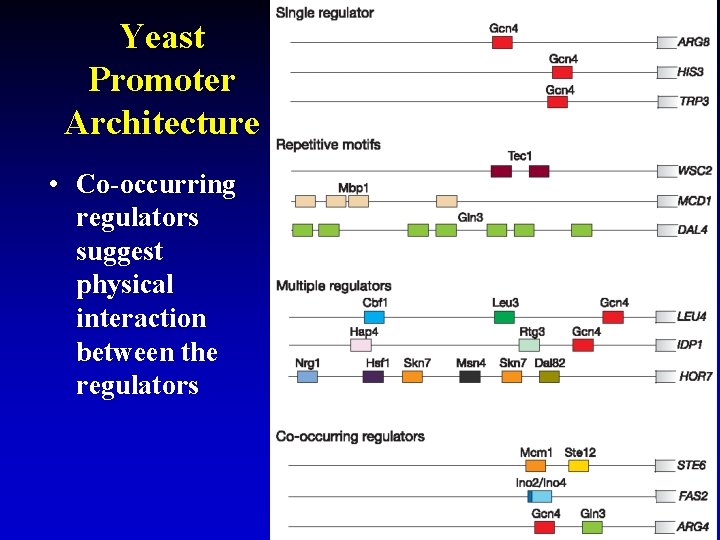
Yeast Promoter Architecture • Co-occurring regulators suggest physical interaction between the regulators 11
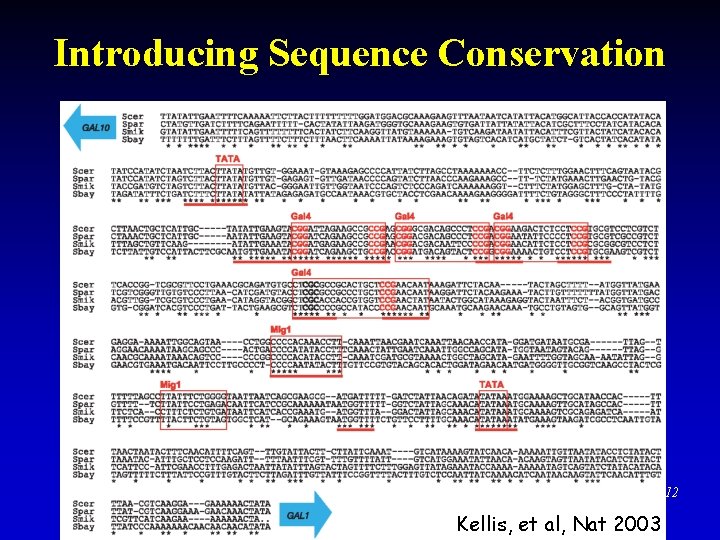
Introducing Sequence Conservation 12 Kellis, et al, Nat 2003
Motif Finding in Higher Eukaryotes • Regulatory sequences very long with repeats and far from target genes (enhancers) • Motifs can be short or long (6 -20 bases), and appear in combination and clusters • Gene expression cluster not good enough input • Need: – – Better known motifs: e. g. PBM Comparative Genomics: phastcons score Motif modules: motif clusters Ch. IP-chip/seq 13
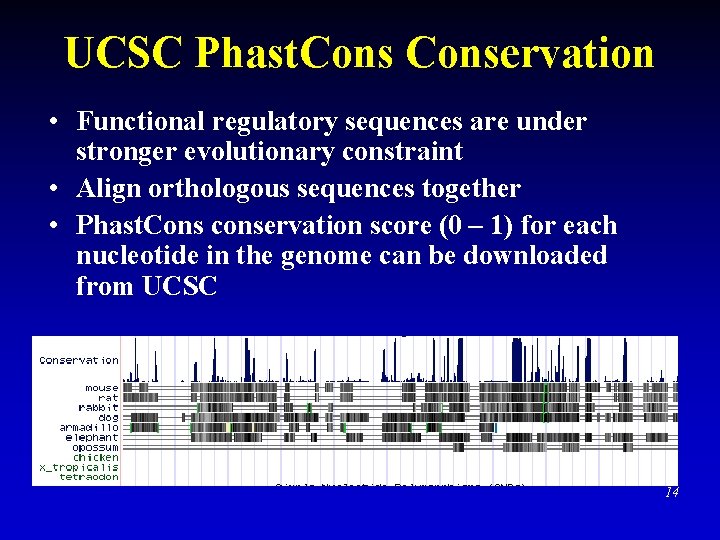
UCSC Phast. Conservation • Functional regulatory sequences are under stronger evolutionary constraint • Align orthologous sequences together • Phast. Cons conservation score (0 – 1) for each nucleotide in the genome can be downloaded from UCSC 14
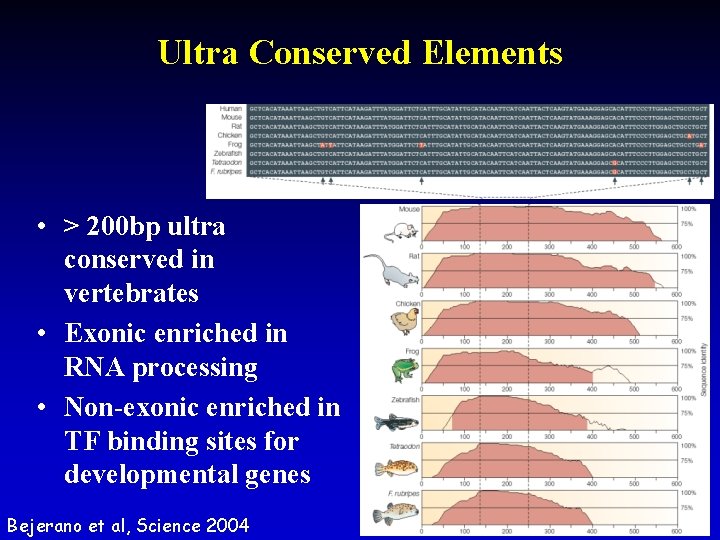
Ultra Conserved Elements • > 200 bp ultra conserved in vertebrates • Exonic enriched in RNA processing • Non-exonic enriched in TF binding sites for developmental genes Bejerano et al, Science 2004 15
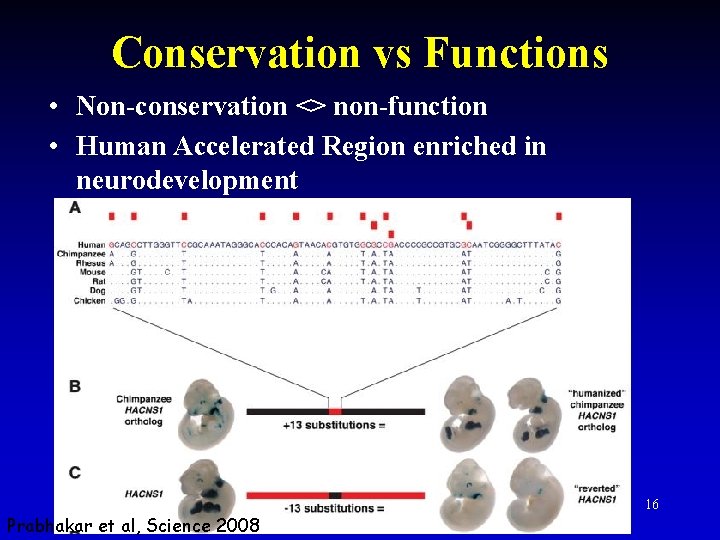
Conservation vs Functions • Non-conservation <> non-function • Human Accelerated Region enriched in neurodevelopment Prabhakar et al, Science 2008 16
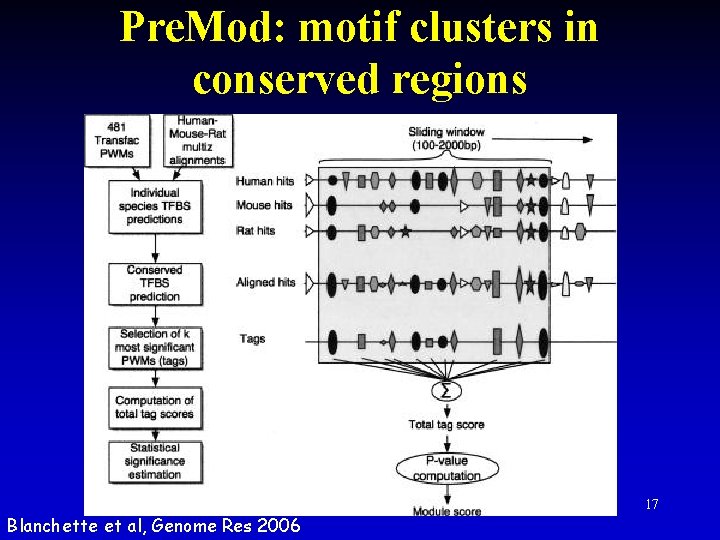
Pre. Mod: motif clusters in conserved regions Blanchette et al, Genome Res 2006 17
Ch. IP-seq Break
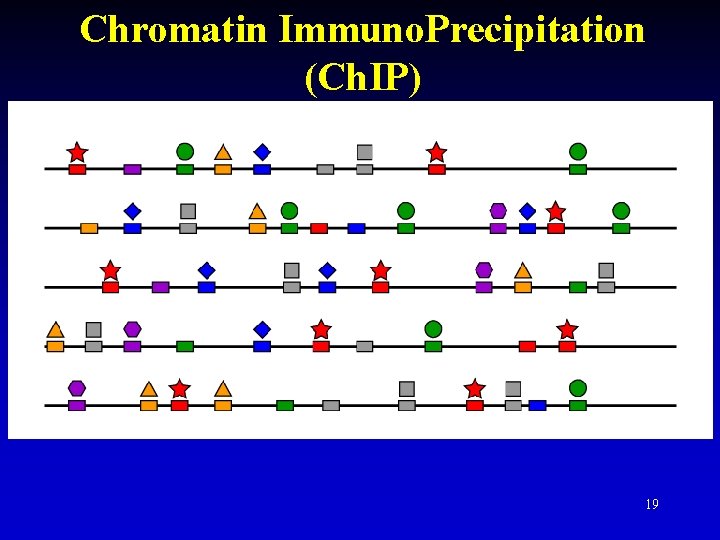
Chromatin Immuno. Precipitation (Ch. IP) 19
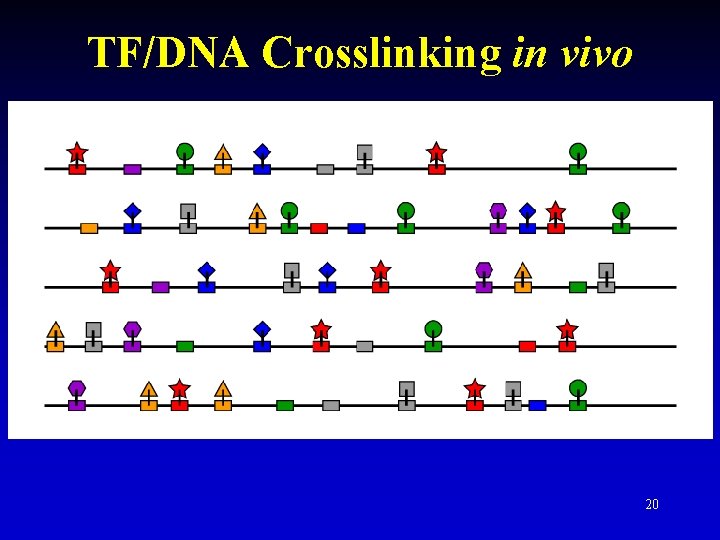
TF/DNA Crosslinking in vivo 20
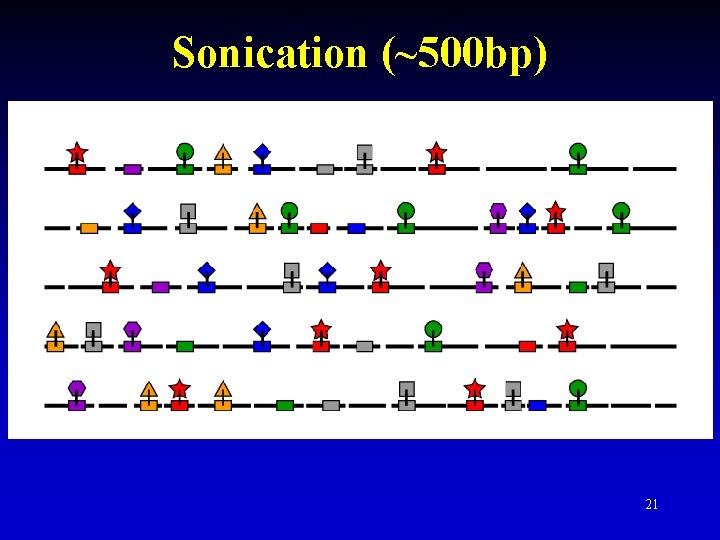
Sonication (~500 bp) 21
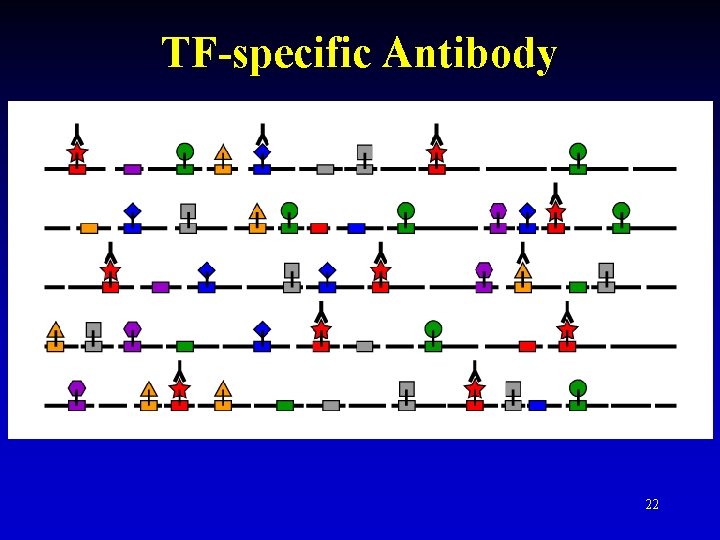
TF-specific Antibody 22
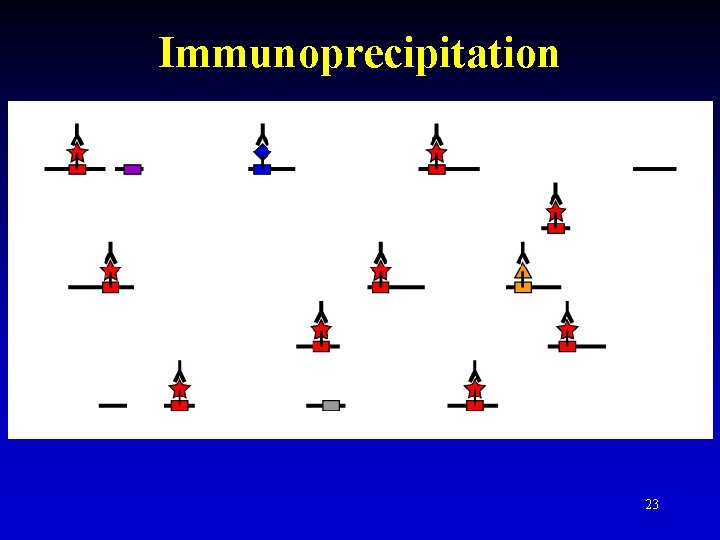
Immunoprecipitation 23
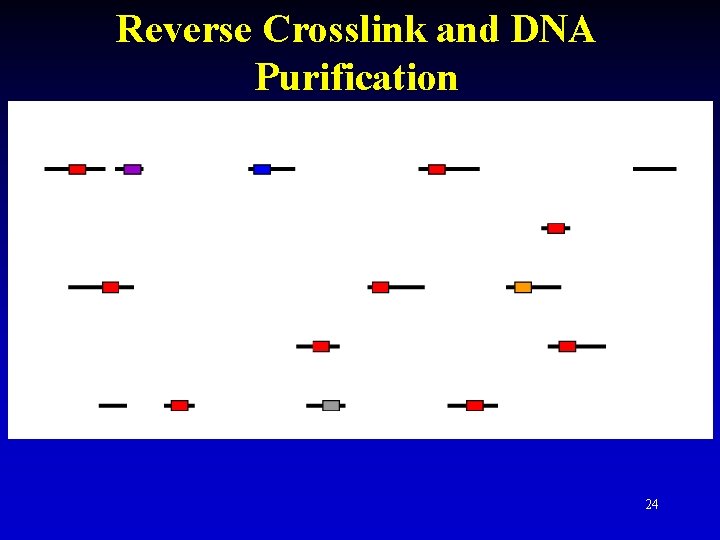
Reverse Crosslink and DNA Purification 24
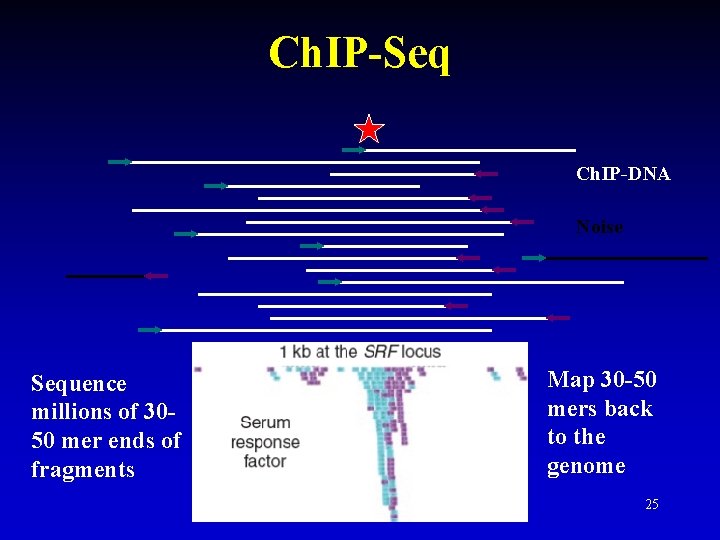
Ch. IP-Seq Ch. IP-DNA Noise Sequence millions of 3050 mer ends of fragments Map 30 -50 mers back to the genome 25
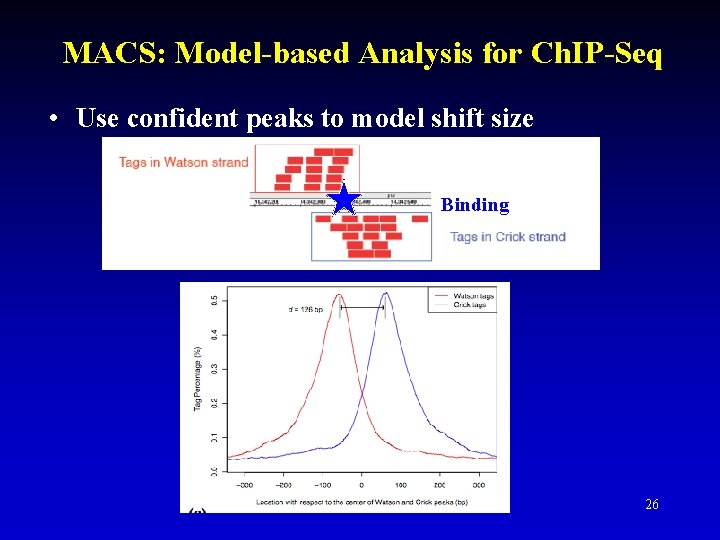
MACS: Model-based Analysis for Ch. IP-Seq • Use confident peaks to model shift size Binding 26
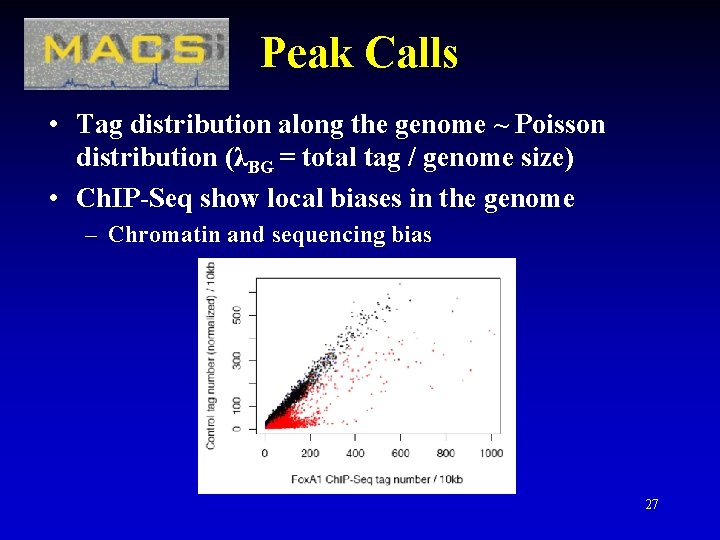
Peak Calls • Tag distribution along the genome ~ Poisson distribution (λBG = total tag / genome size) • Ch. IP-Seq show local biases in the genome – Chromatin and sequencing bias 27
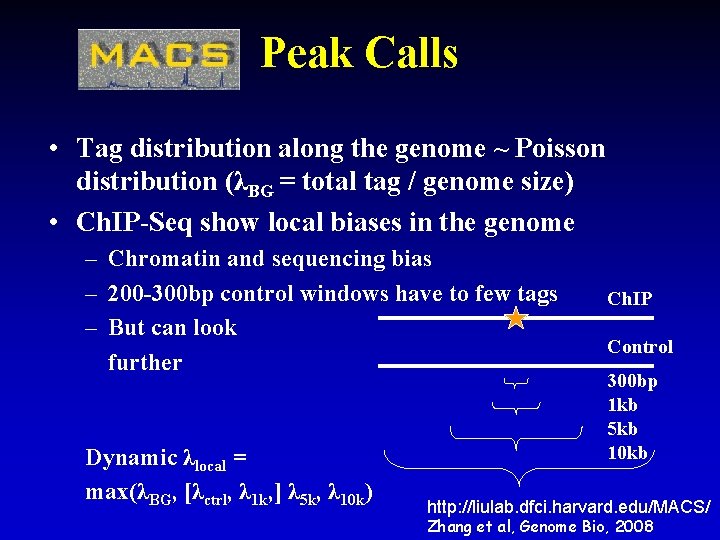
Peak Calls • Tag distribution along the genome ~ Poisson distribution (λBG = total tag / genome size) • Ch. IP-Seq show local biases in the genome – Chromatin and sequencing bias – 200 -300 bp control windows have to few tags – But can look further Dynamic λlocal = max(λBG, [λctrl, λ 1 k, ] λ 5 k, λ 10 k) Ch. IP Control 300 bp 1 kb 5 kb 10 kb http: //liulab. dfci. harvard. edu/MACS/ Zhang et al, Genome Bio, 2008
Ch. IP-seq QC Break
Ch. IP-seq QC • Read quality (FASTQC) • Read mapping % (higher the better) • Library complexity (avoid PCR amplification bias): # locations with 1 unique reads / # locations • Good to keep one read / location in peak calling (default MACS) • FDR adjustment? 30
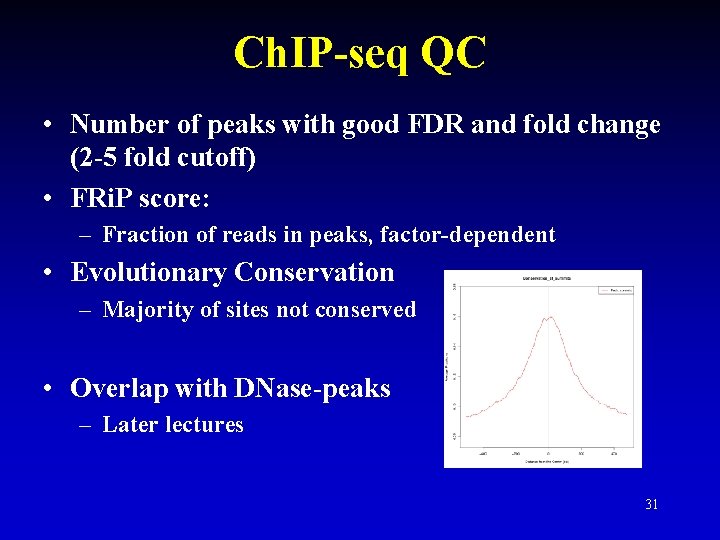
Ch. IP-seq QC • Number of peaks with good FDR and fold change (2 -5 fold cutoff) • FRi. P score: – Fraction of reads in peaks, factor-dependent • Evolutionary Conservation – Majority of sites not conserved • Overlap with DNase-peaks – Later lectures 31
Ch. IP-seq Downstream Analysis Break
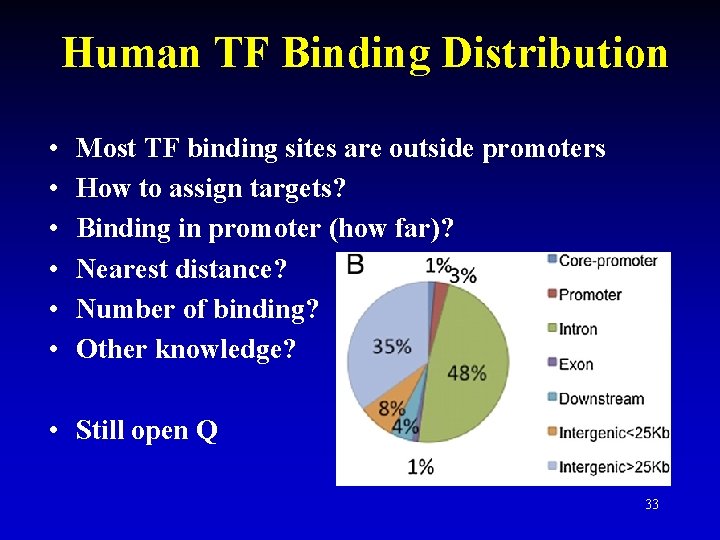
Human TF Binding Distribution • • • Most TF binding sites are outside promoters How to assign targets? Binding in promoter (how far)? Nearest distance? Number of binding? Other knowledge? • Still open Q 33
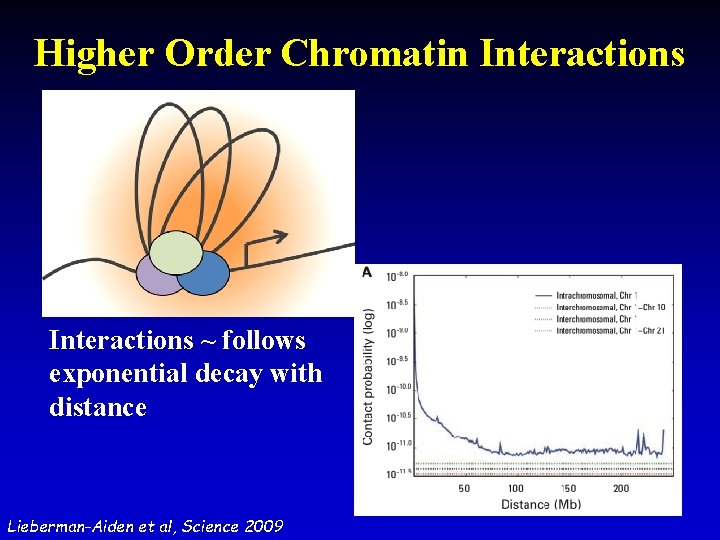
Higher Order Chromatin Interactions ~ follows exponential decay with distance Lieberman-Aiden et al, Science 2009
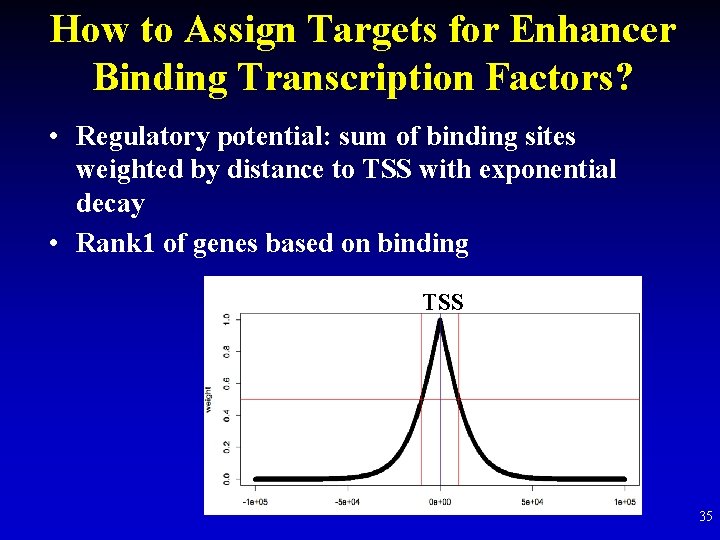
How to Assign Targets for Enhancer Binding Transcription Factors? • Regulatory potential: sum of binding sites weighted by distance to TSS with exponential decay • Rank 1 of genes based on binding TSS 35
How to Assign Targets for Enhancer Binding Transcription Factors? • Regulatory potential: sum of binding sites weighted by distance to TSS with exponential decay • Rank 1 of genes based on binding • Rank 2 of genes based on expression – Differential expression upon TF perturbation – Gene expression correlation in cohorts • Rank ordered list of targets: Rank 1 * Rank 2 • Only minority of binding sites is functional in a condition 36
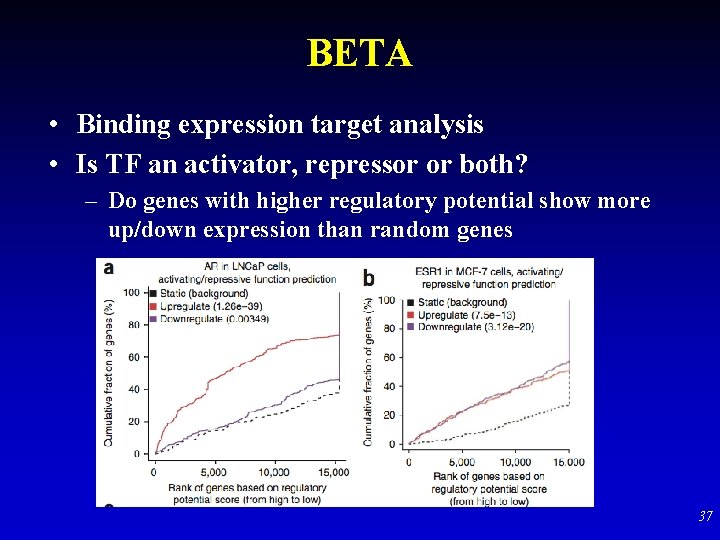
BETA • Binding expression target analysis • Is TF an activator, repressor or both? – Do genes with higher regulatory potential show more up/down expression than random genes 37
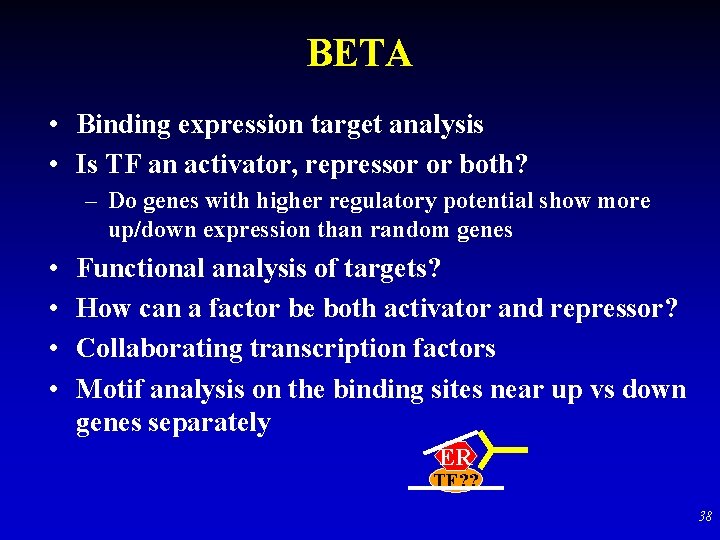
BETA • Binding expression target analysis • Is TF an activator, repressor or both? – Do genes with higher regulatory potential show more up/down expression than random genes • • Functional analysis of targets? How can a factor be both activator and repressor? Collaborating transcription factors Motif analysis on the binding sites near up vs down genes separately ER TF? ? 38
Summary • Ch. IP-seq identifies genome-wide in vivo protein-DNA interaction sites • Ch. IP-seq peak calling to shift reads • Ch. IP-seq QC: FDR, fold, conservation, etc • Functional analysis of Ch. IP-seq data: – Target identification – Activator / repressor function – Motif analysis 39