Correction for MDI saturation plan Yang Liu Stanford


- Slides: 12
Correction for MDI saturation (plan) Yang Liu – Stanford University yliu@solar. stanford. edu
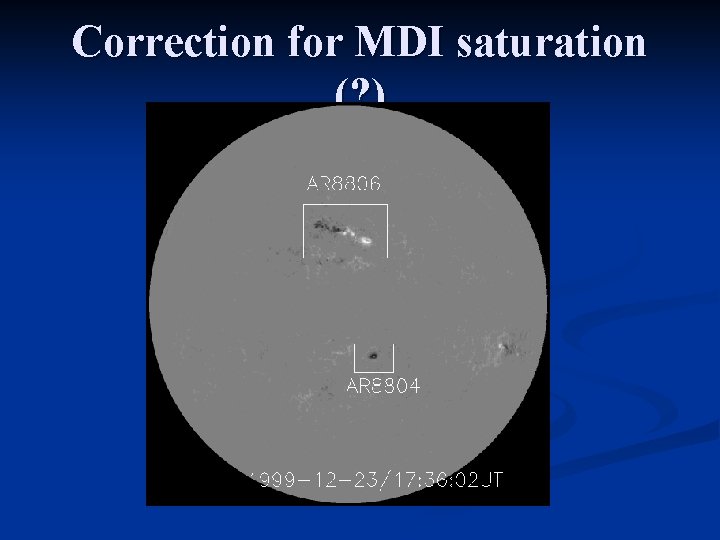
Correction for MDI saturation (? )
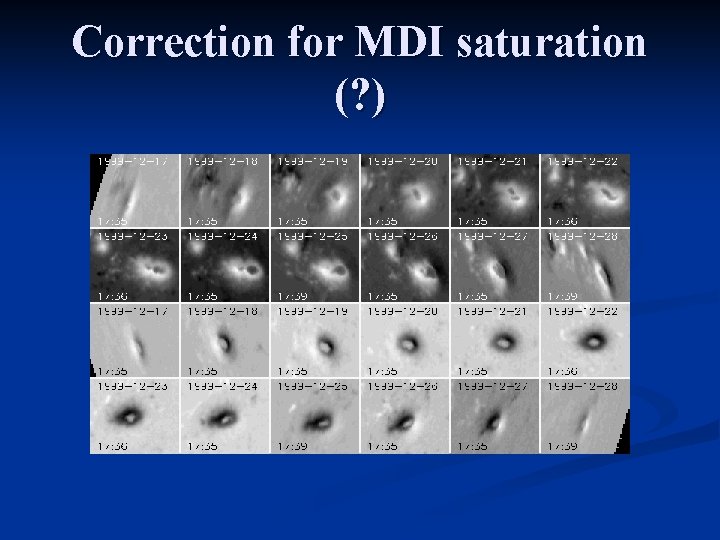
Correction for MDI saturation (? )
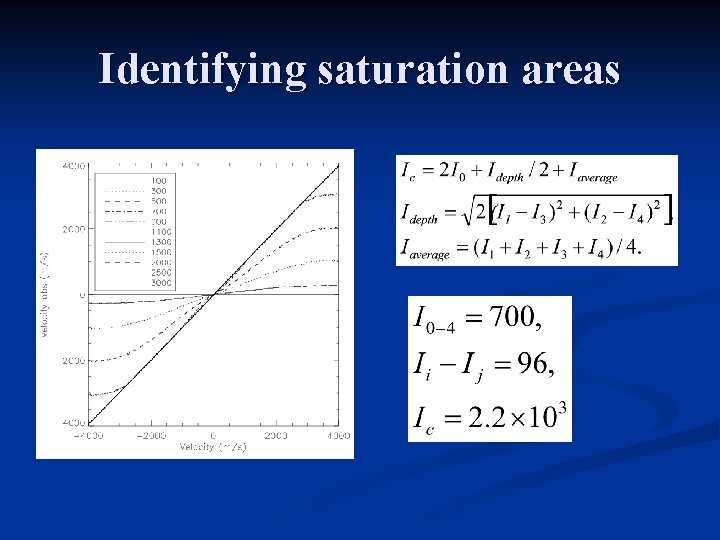
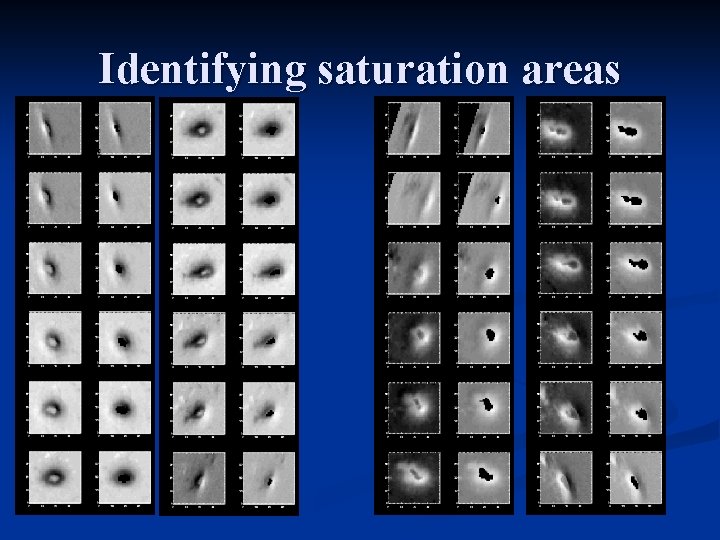
Identifying saturation areas
Identifying saturation areas
Observation (I-B relationship) Top panel: magnetic field measured from Fe. I 6302; bottom panel: measured from Ti. I 6064. 8 sunspots were analyzed here. From Martinez Pillet & Vazquez (1993). 6 sunspots measured in infrared wavelength (Fe. I 15649). From Kopp & Rabin (1992).
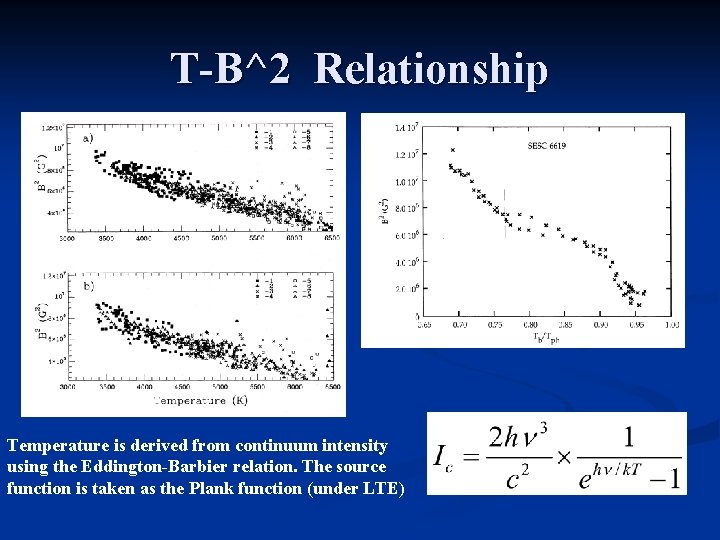
T-B^2 Relationship Temperature is derived from continuum intensity using the Eddington-Barbier relation. The source function is taken as the Plank function (under LTE)
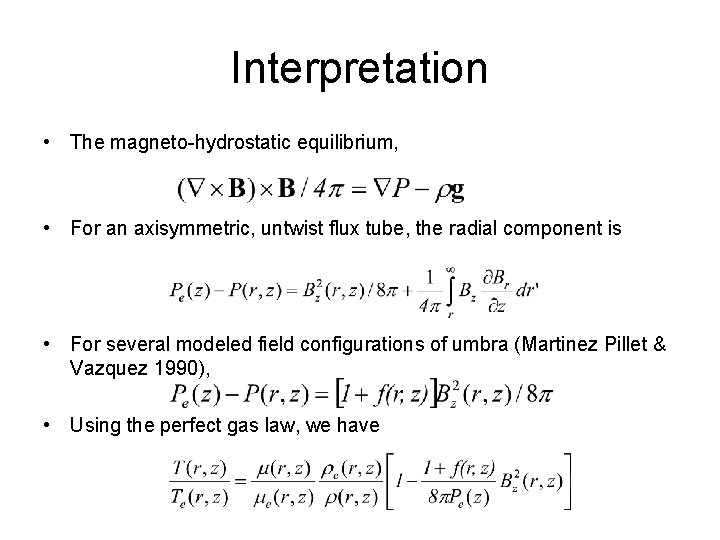
Interpretation • The magneto-hydrostatic equilibrium, • For an axisymmetric, untwist flux tube, the radial component is • For several modeled field configurations of umbra (Martinez Pillet & Vazquez 1990), • Using the perfect gas law, we have
n Thus, we have (approximately) Interpretation
Plan Find an empirical formula to correct for saturation (probably a linear function but it’s dependent on locations of the sunspots); n The inferred field should be vertical component; n It’s suggested that field is roughly vertical in sunspot umbrae. n
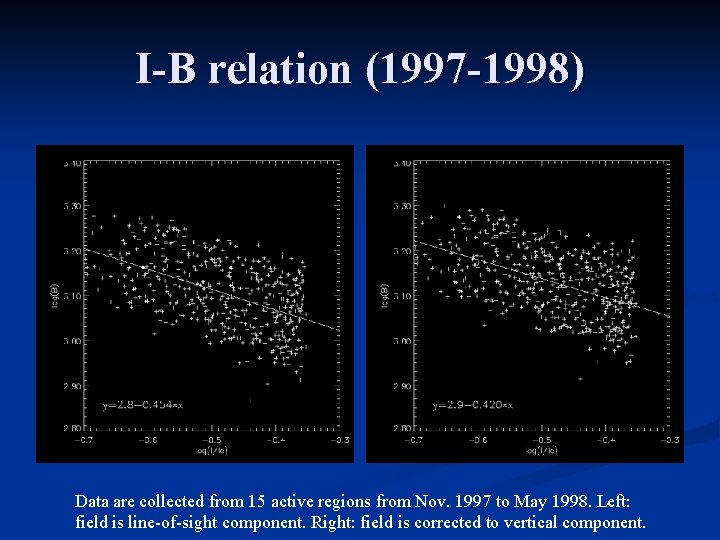
I-B relation (1997 -1998) Data are collected from 15 active regions from Nov. 1997 to May 1998. Left: field is line-of-sight component. Right: field is corrected to vertical component.
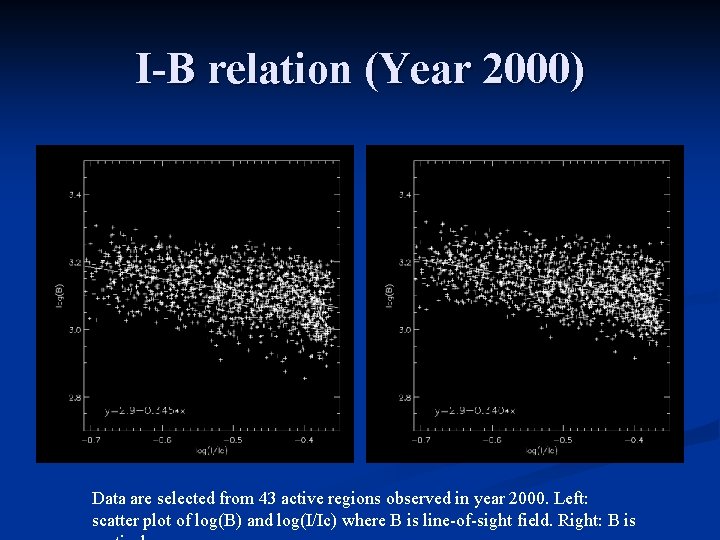
I-B relation (Year 2000) Data are selected from 43 active regions observed in year 2000. Left: scatter plot of log(B) and log(I/Ic) where B is line-of-sight field. Right: B is