
GenomeWide Association Studies Continued Xiaole Shirley Liu Stat
- Slides: 34
Genome-Wide Association Studies Continued Xiaole Shirley Liu Stat 115/STAT 215/BIO 512/BIST 298
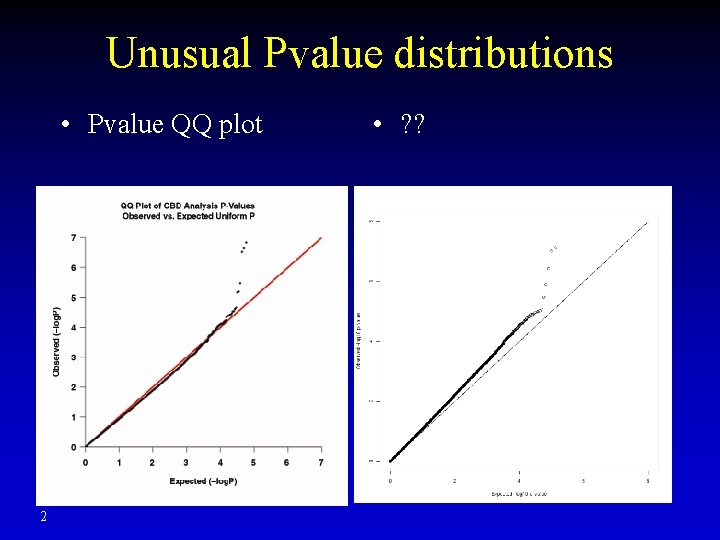
Unusual Pvalue distributions • Pvalue QQ plot 2 • ? ?
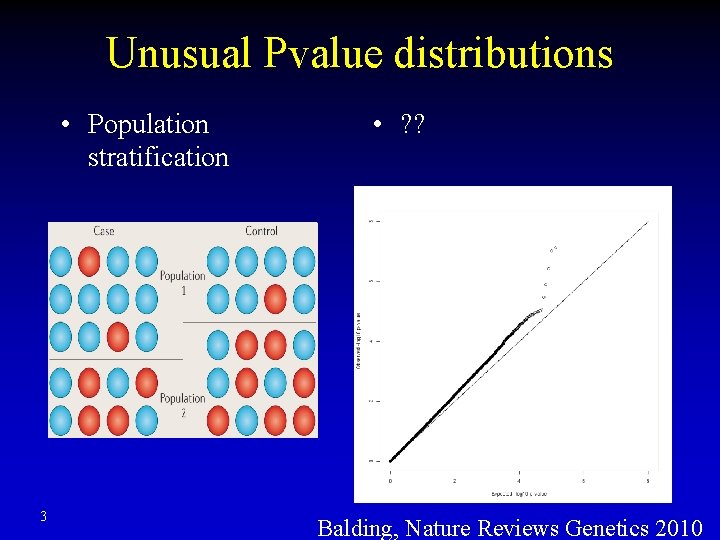
Unusual Pvalue distributions • Population stratification 3 • ? ? Balding, Nature Reviews Genetics 2010
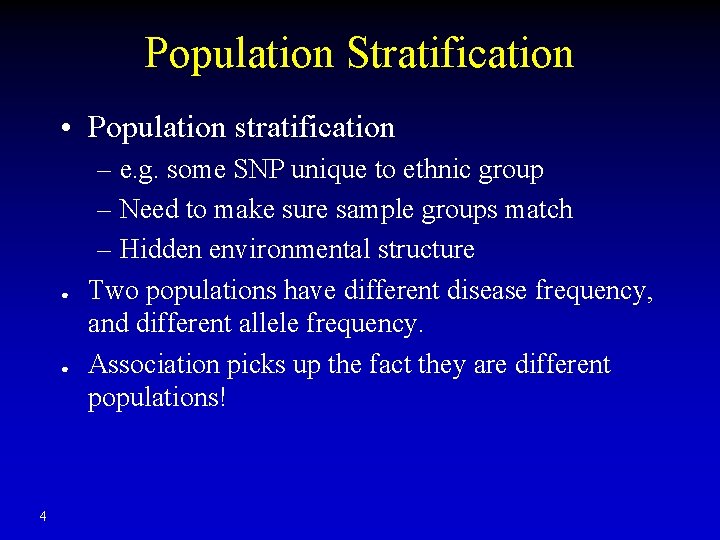
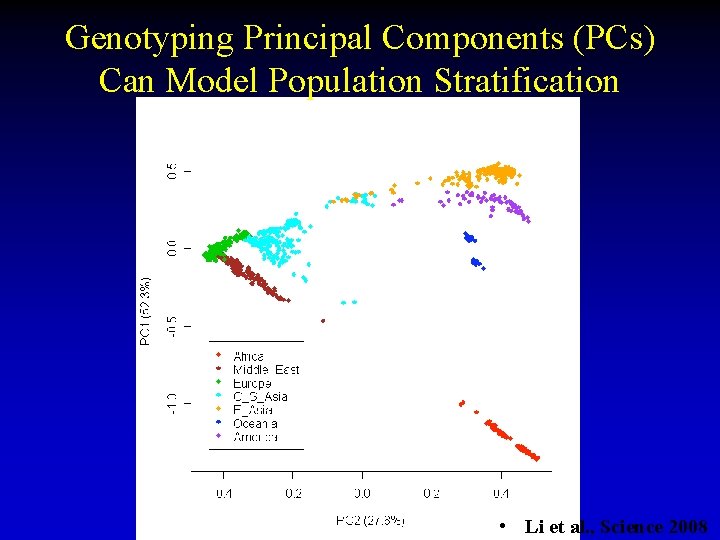
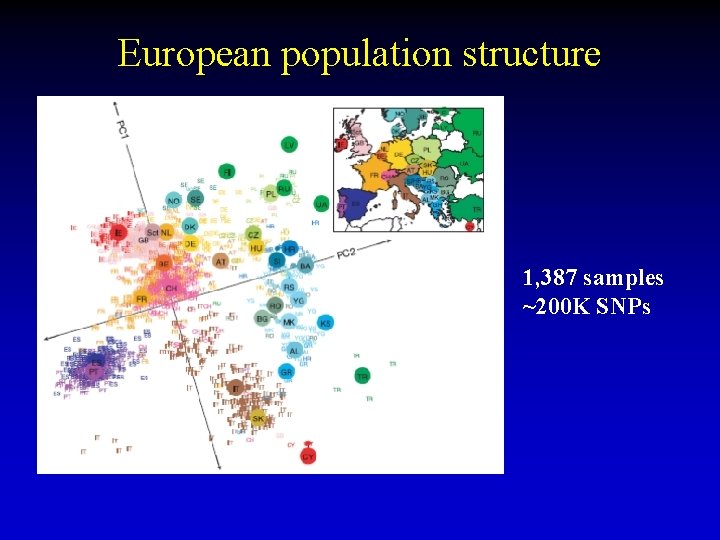
Population Stratification • Population stratification ● ● 4 – e. g. some SNP unique to ethnic group – Need to make sure sample groups match – Hidden environmental structure Two populations have different disease frequency, and different allele frequency. Association picks up the fact they are different populations!
Genotyping Principal Components (PCs) Can Model Population Stratification • Li et al. , Science 2008
European population structure 1, 387 samples ~200 K SNPs
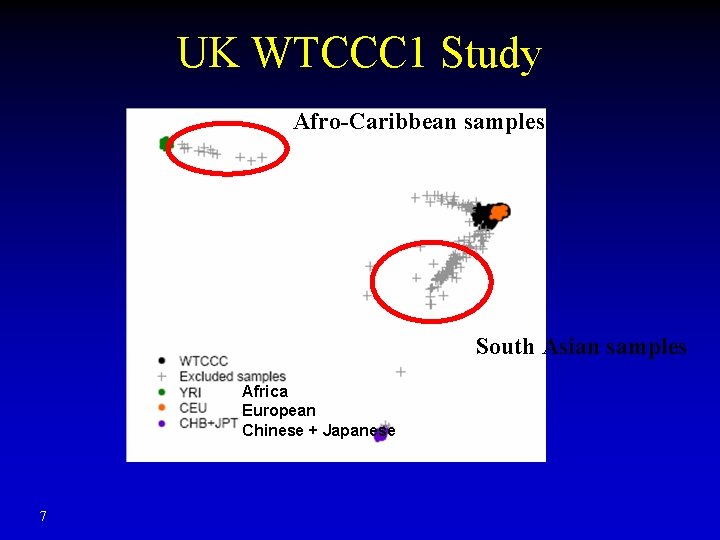
UK WTCCC 1 Study Afro-Caribbean samples South Asian samples Africa European Chinese + Japanese 7
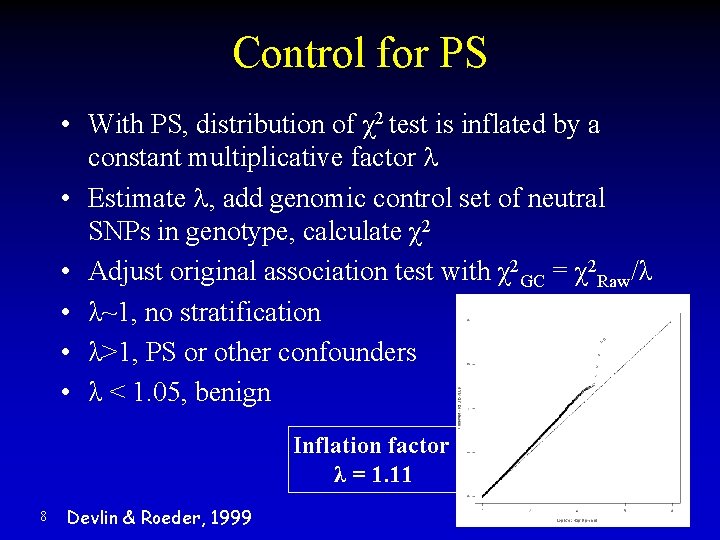
Control for PS • With PS, distribution of χ2 test is inflated by a constant multiplicative factor l • Estimate l, add genomic control set of neutral SNPs in genotype, calculate χ2 • Adjust original association test with χ2 GC = χ2 Raw/λ • λ~1, no stratification • λ>1, PS or other confounders • λ < 1. 05, benign Inflation factor λ = 1. 11 8 Devlin & Roeder, 1999
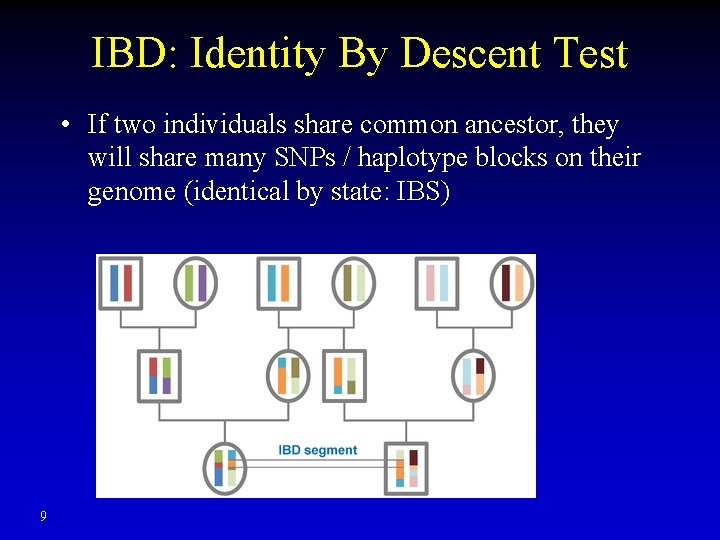
IBD: Identity By Descent Test • If two individuals share common ancestor, they will share many SNPs / haplotype blocks on their genome (identical by state: IBS) 9
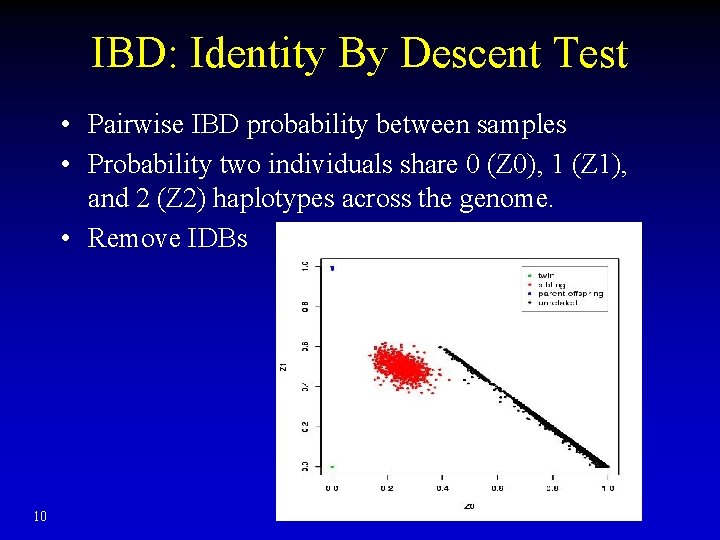
IBD: Identity By Descent Test • Pairwise IBD probability between samples • Probability two individuals share 0 (Z 0), 1 (Z 1), and 2 (Z 2) haplotypes across the genome. • Remove IDBs 10
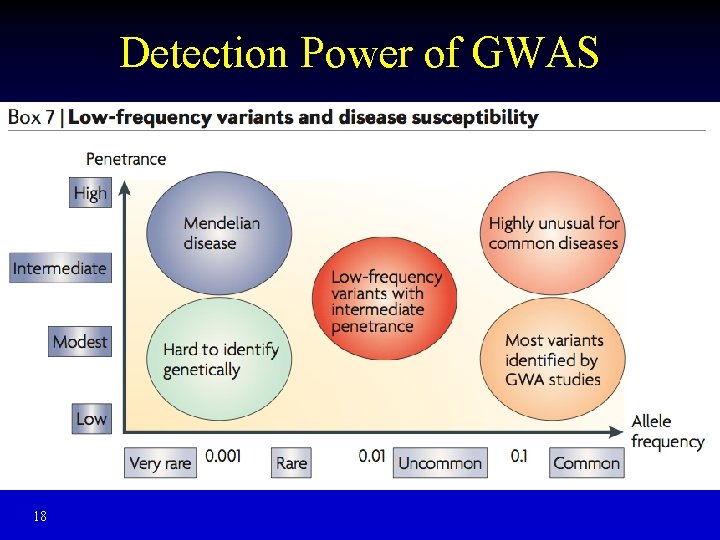
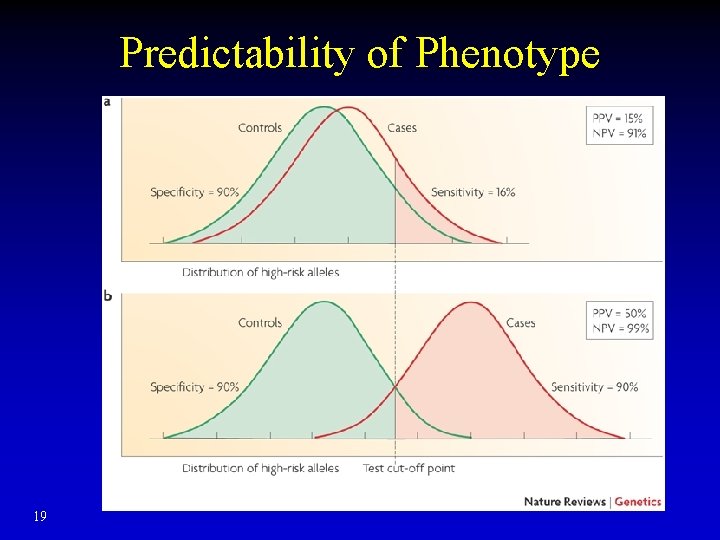
Pitfalls of Association Studies • Poor reproducibility • Detection power vs penetrance (fraction of people with the marker who show the trait) and expressivity (severity of the effect) • Explain little heritability, not very predictive • Difficult when several genes affecting a quantitative trait • Many associated variants are not causal • No available intervention for many disease risks 11
Cause for Inconsistency • What explains the lack of reproducibility? • False positives – Multiple hypothesis testing – Ethnic admixture / stratification • False negatives – Lack of power for weak effects • Population differences – Variable LD with causal SNP – Population-specific modifiers 12
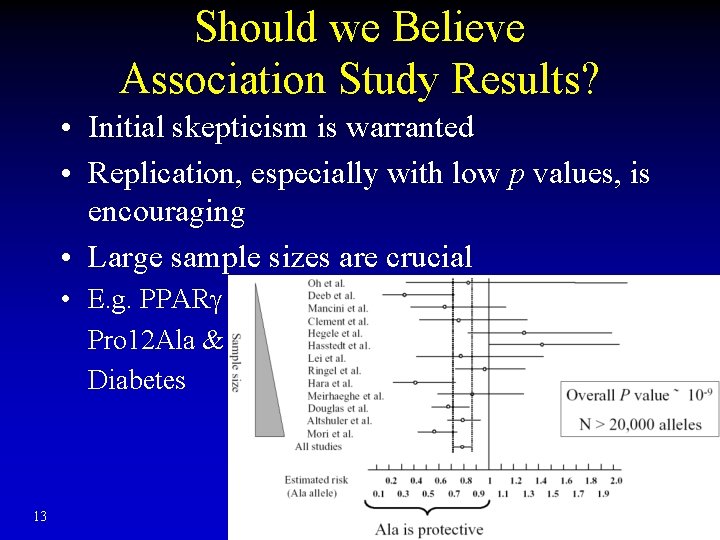
Should we Believe Association Study Results? • Initial skepticism is warranted • Replication, especially with low p values, is encouraging • Large sample sizes are crucial • E. g. PPARg Pro 12 Ala & Diabetes 13
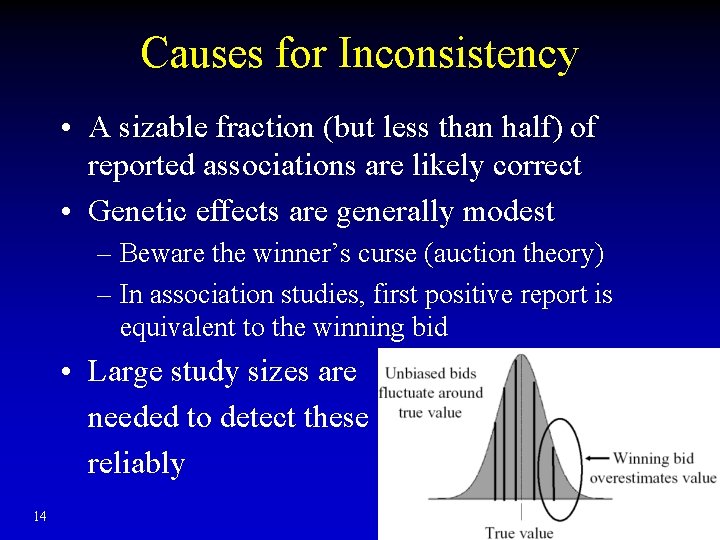
Causes for Inconsistency • A sizable fraction (but less than half) of reported associations are likely correct • Genetic effects are generally modest – Beware the winner’s curse (auction theory) – In association studies, first positive report is equivalent to the winning bid • Large study sizes are needed to detect these reliably 14
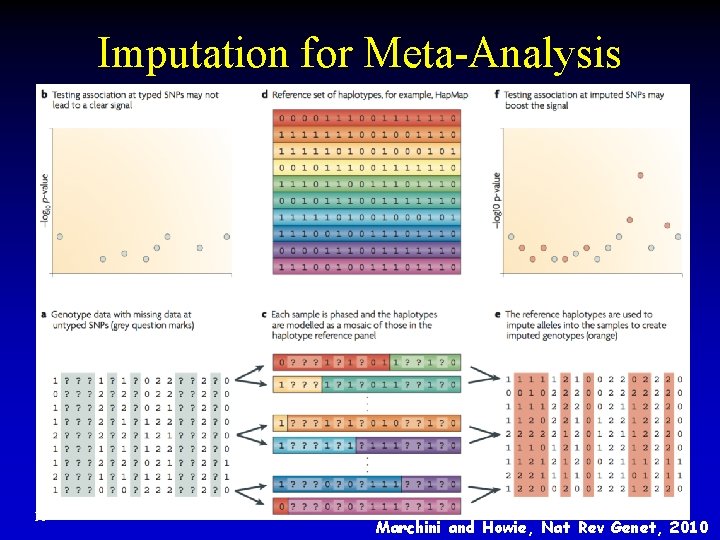
Replication, Replication • Meta-analysis of multiple studies to increase GWAS power • Combine data from different platforms / studies • Impute unmeasured or missing genotypes based on LD (e. g. Hap. Map haplotypes or 1000 Genomes) • Analyze all studies together to increase GWAS power 15
Imputation for Meta-Analysis 16 Marchini and Howie, Nat Rev Genet, 2010
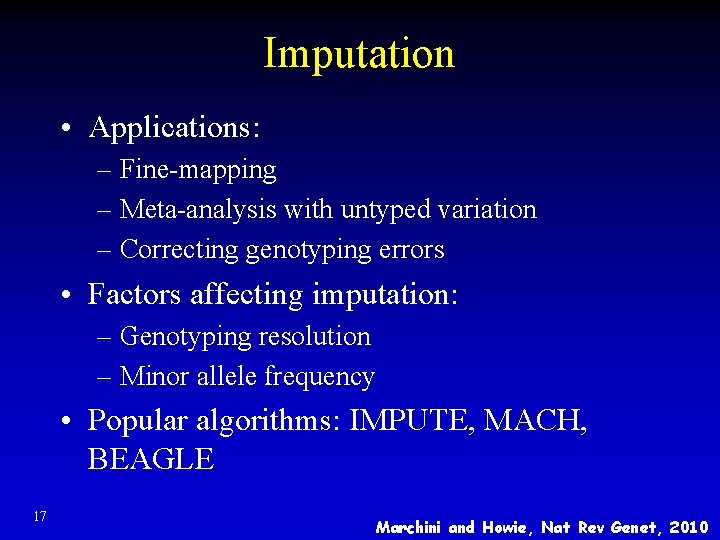
Imputation • Applications: – Fine-mapping – Meta-analysis with untyped variation – Correcting genotyping errors • Factors affecting imputation: – Genotyping resolution – Minor allele frequency • Popular algorithms: IMPUTE, MACH, BEAGLE 17 Marchini and Howie, Nat Rev Genet, 2010
Detection Power of GWAS 18
Predictability of Phenotype 19
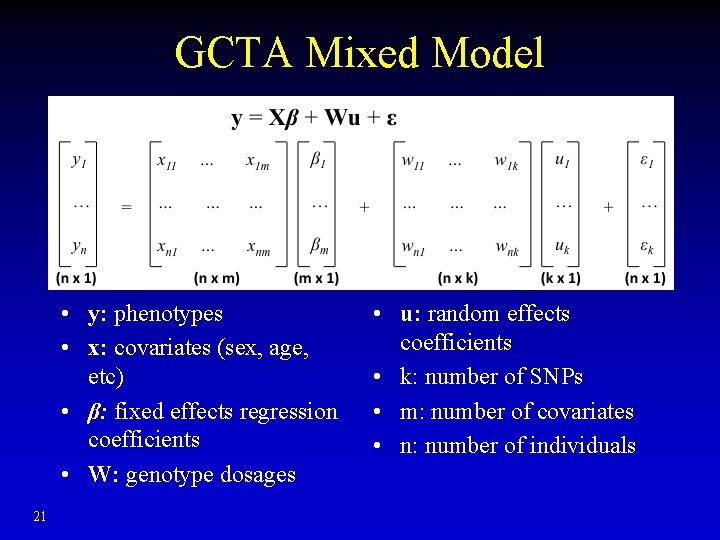
GCTA • Genome-wide complex trait analysis: estimate proportion of phenotype variance explain by genotypes (collection of SNPs) • Intuition: if a trait is genetically influenced, then individuals who are more genetically similar should be more phenotypically similar 20
GCTA Mixed Model • y: phenotypes • x: covariates (sex, age, etc) • β: fixed effects regression coefficients • W: genotype dosages 21 • u: random effects coefficients • k: number of SNPs • m: number of covariates • n: number of individuals
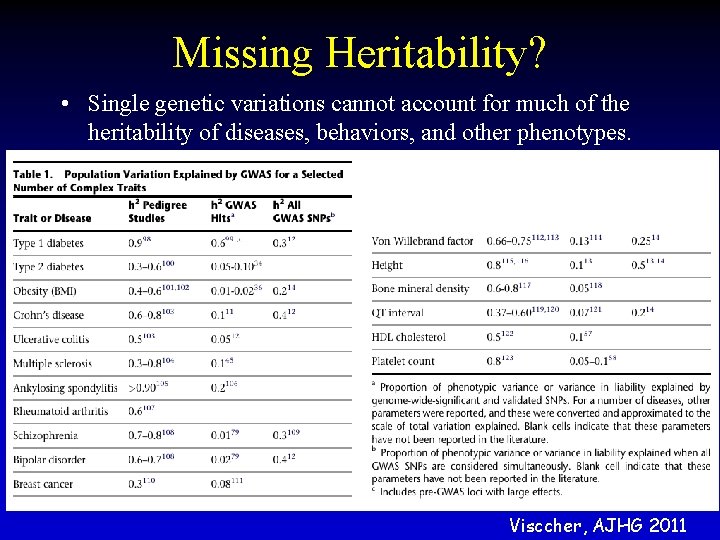
Missing Heritability? • Single genetic variations cannot account for much of the heritability of diseases, behaviors, and other phenotypes. Visccher, AJHG 2011
23 Height associated SNPs from 189 K individuals
Mapping (expression) Quantitative Trait Loci
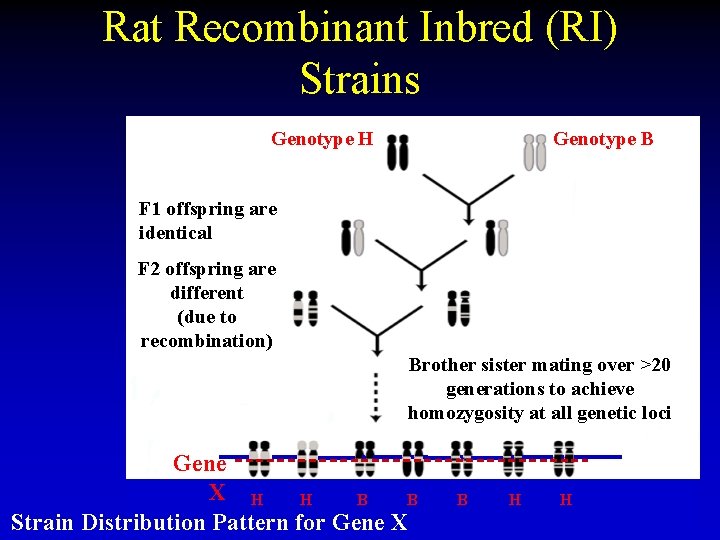
Rat Recombinant Inbred (RI) Strains Genotype H F 1 offspring are identical SHR BN Genotype B F 1 F 2 offspring are different (due to F 2 recombination) Brother sister mating over >20 generations to achieve homozygosity at all genetic loci Gene X H H B B Strain Distribution Pattern for Gene X B H H
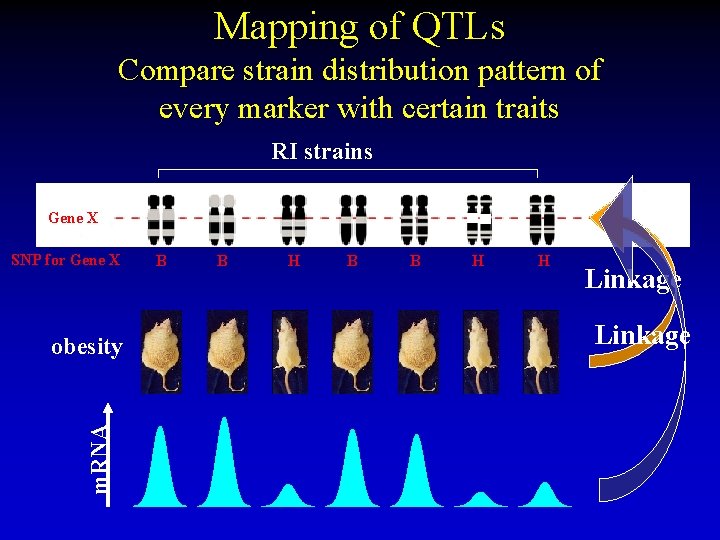
Mapping of QTLs Compare strain distribution pattern of every marker with certain traits RI strains Gene X SNP for Gene X m. RNA obesity B B H H Linkage
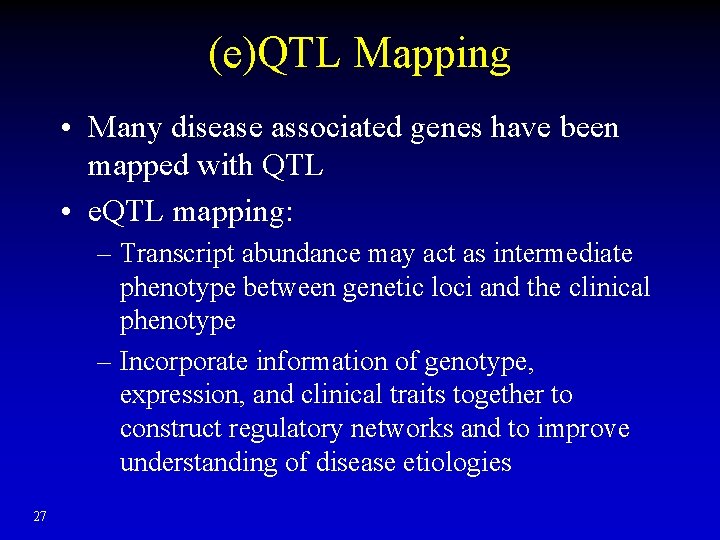
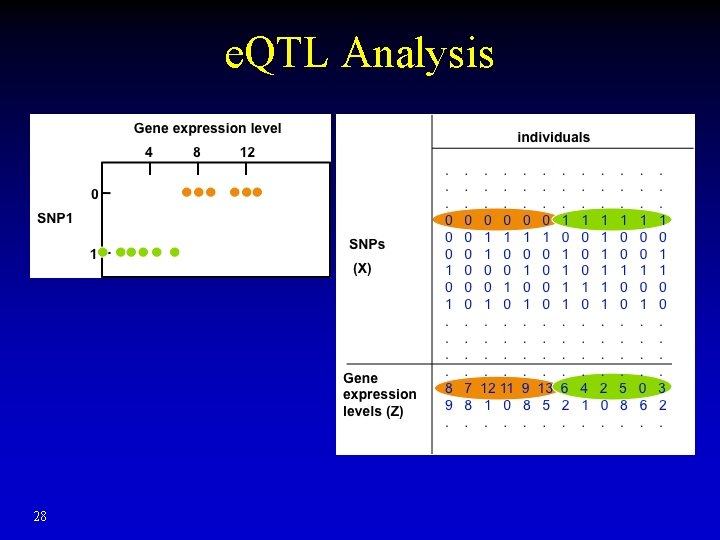
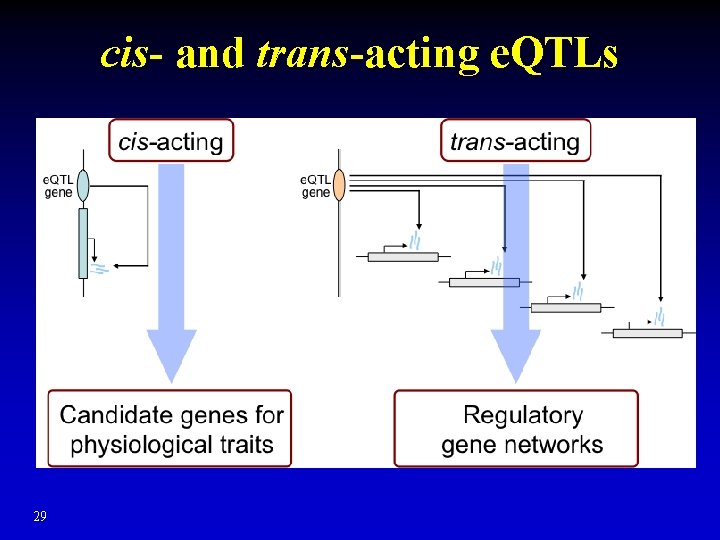
(e)QTL Mapping • Many disease associated genes have been mapped with QTL • e. QTL mapping: – Transcript abundance may act as intermediate phenotype between genetic loci and the clinical phenotype – Incorporate information of genotype, expression, and clinical traits together to construct regulatory networks and to improve understanding of disease etiologies 27
e. QTL Analysis 28
cis- and trans-acting e. QTLs 29
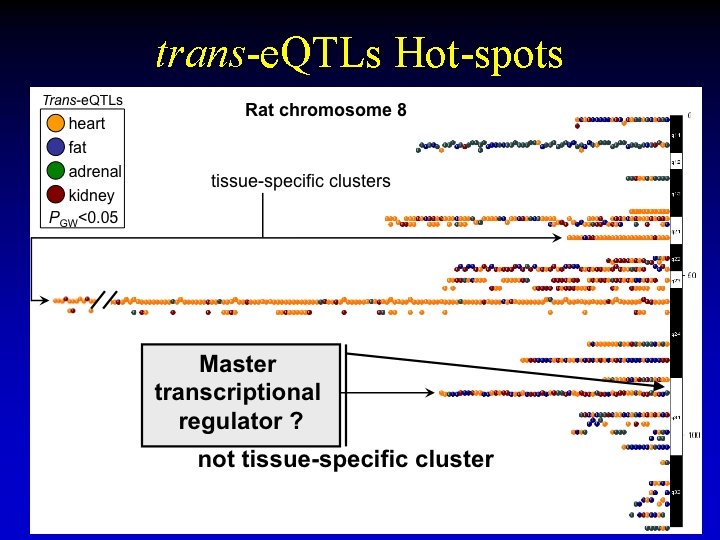
trans-e. QTLs Hot-spots 30
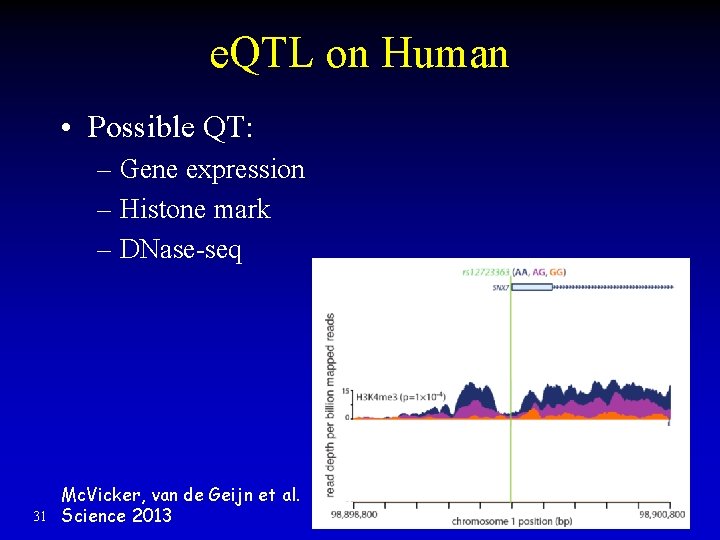
e. QTL on Human • Possible QT: – Gene expression – Histone mark – DNase-seq 31 Mc. Vicker, van de Geijn et al. Science 2013
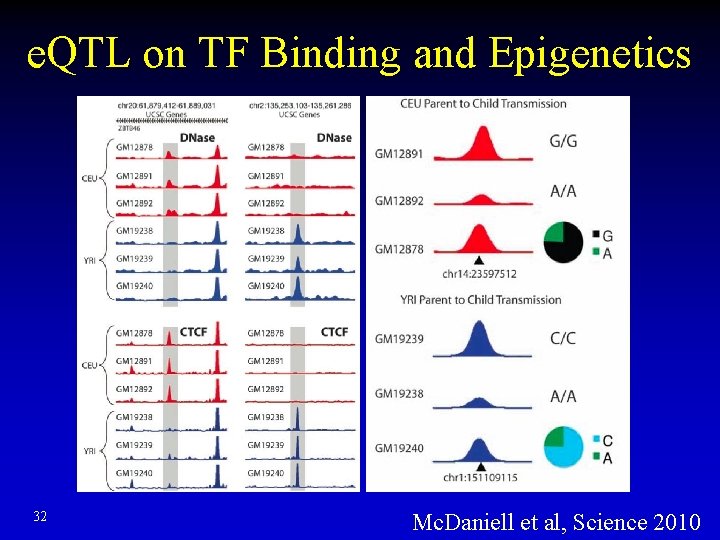
e. QTL on TF Binding and Epigenetics 32 Mc. Daniell et al, Science 2010
Summary • • • 33 Population stratification, IBD Removing outliers or find the scaling factor Predictability, heritability Reproducibility QTL and e. QTL mapping Cis- vs trans- e. QTL
Acknowledgement • • • 34 Kenneth Kidd Judith Kidd Glenys Thomson Joel Hirschhorn Greg Gibson Spencer Muse Jim Stankovich Teri Manolio David Evans • • Tim Niu Wei Wang Soumya Raychaudhuri Benjamin Neale Bo Li David Evans Guodong Wu Enrico Petretto