Information management for artworks and artists from Museums


 in museums can be briefly defined as a")
 • KM techniques help museums to survive in an ever faster-moving")


 Carnegie Museum of Art in Pittsburgh, Pennsylvania Header title Description Example")
 Carnegie Museum of Art in Pittsburgh, Pennsylvania id A unique string")
 Carnegie Museum of Art in Pittsburgh, Pennsylvania item_height item_depth item_diameter web_url")


![Loading Python Libraries In [ ]: #Import Python Libraries import numpy as np import](https://slidetodoc.com/presentation_image_h2/8ec48256d39f3c43bcfef546a071c6a9/image-30.jpg "Loading Python Libraries In [ ]: #Import Python Libraries import numpy as np import")

![Presentation of the columns In [ ]: #Columns of file data. columns Index(['title', 'creation_date_earliest',](https://slidetodoc.com/presentation_image_h2/8ec48256d39f3c43bcfef546a071c6a9/image-32.jpg "Presentation of the columns In [ ]: #Columns of file data. columns Index(['title', 'creation_date_earliest',")


![Data Frames: method iloc (summary) data. iloc[0] # First row of a data frame](https://slidetodoc.com/presentation_image_h2/8ec48256d39f3c43bcfef546a071c6a9/image-41.jpg "Data Frames: method iloc (summary) data. iloc[0] # First row of a data frame")

![Missing Values Missing values are marked as Na. N In [ ]: # Select](https://slidetodoc.com/presentation_image_h2/8ec48256d39f3c43bcfef546a071c6a9/image-43.jpg "Missing Values Missing values are marked as Na. N In [ ]: # Select")


 method is useful when multiple statistics are computed per")


")

![Plot information about column ‘medium’ In [ ]: configure_plotly_browser_state() create. Table. Freq. Figure(data, 'medium',](https://slidetodoc.com/presentation_image_h2/8ec48256d39f3c43bcfef546a071c6a9/image-54.jpg "Plot information about column ‘medium’ In [ ]: configure_plotly_browser_state() create. Table. Freq. Figure(data, 'medium',")
![Plot information about column ‘credit_line’ In [ ]: configure_plotly_browser_state() create. Table. Freq. Figure(data, 'credit_line',](https://slidetodoc.com/presentation_image_h2/8ec48256d39f3c43bcfef546a071c6a9/image-55.jpg "Plot information about column ‘credit_line’ In [ ]: configure_plotly_browser_state() create. Table. Freq. Figure(data, 'credit_line',")
![Plot information about column ‘classification’ In [ ]: configure_plotly_browser_state() create. Table. Freq. Figure(data, 'classification',](https://slidetodoc.com/presentation_image_h2/8ec48256d39f3c43bcfef546a071c6a9/image-56.jpg "Plot information about column ‘classification’ In [ ]: configure_plotly_browser_state() create. Table. Freq. Figure(data, 'classification',")
![Plot information about column ‘nationality’ In [ ]: configure_plotly_browser_state() create. Table. Freq. Figure(data, 'nationality',](https://slidetodoc.com/presentation_image_h2/8ec48256d39f3c43bcfef546a071c6a9/image-57.jpg "Plot information about column ‘nationality’ In [ ]: configure_plotly_browser_state() create. Table. Freq. Figure(data, 'nationality',")
![Plot information about column ‘classification’ for a specific nationality In [ ]: configure_plotly_browser_state() create.](https://slidetodoc.com/presentation_image_h2/8ec48256d39f3c43bcfef546a071c6a9/image-58.jpg "Plot information about column ‘classification’ for a specific nationality In [ ]: configure_plotly_browser_state() create.")


- Slides: 71
Information management for artworks and artists from Museums’ Githubs Sotiris Kotsiantis, University of Patras
Aim and objectives • The aim of this presentation is to introduce knowledge and information management for museums • The main objective is the extraction of knowledge about Artworks and Artists from Museums’ Githubs • In this presentation, we shall present case studies of knowledge extraction from Githubs of Carnegie Museum of Art, Cleveland Museum of Art and Museum of Modern (Mo. MA) Art • One main topic is how to use google colab environment and python libraries pandas, matplotlib and plotly for easily extracting knowledge from artworks and artists Information
Learning outcomes • At the end of this presentation, you will be able to: • Use information from a museum Github. • Implement queries for finding paintings of an artist. • Implement queries for counting Objects in a museum. • Implement queries for counting nationality or gender of artists. • Graph plots for culture or technique in a collection.
Terms and keywords • Github • Git. Hub is a platform for sharing and collaborating on code repositories. In a Git. Hub repository, the README functions as an overview of the repository and its contents. In the museum context, the README may act as a guide for how institutions have chosen to share their collections data. • Colab • A free cloud service based on Jupyter Notebooks. One can write and execute python scripts, save and share the analyses, and access powerful computing resources, all for free from a web browser.
Knowledge management • Knowledge management (KM) in museums can be briefly defined as a conscious strategy of supporting people to share and place information into action in ways that make effort to improve museum performance. • With the advent of World Wide Web (WWW), the role of museums have changed and expanded their services beyond the traditional boundaries. Using knowledge management tools, museum professionals can provide effective services to their users.
Knowledge management (2) • KM techniques help museums to survive in an ever faster-moving and competitive environment. In this electronic era, KM has become an important tool which provides dynamic and effective service to the museum audiences. • In a digital world, access to an individual object can follow a path from (metadata about) the museum, to (metadata about) a specific collection, to (metadata about) an individual object.
Metadata • Establishing a context for digital collections online is an entirely different process from what museums and their visitors are used to. Onsite, museums control the environment in which the visitor can observe the object by giving it a specific context. • Online, alternative contexts are possible as multiple metadata can be displayed. Furthermore, the user is no longer inside the information space provided by the museum but free to explore any context he or she likes, following personal interests and information needs, which, usually, change over time. The museum institution can no longer fully control the context in which its objects are observed. It can only control the quality and quantity of the metadata provided to assist the interpretation process.
Museums and Github • The digitization of collections has first of all provided new means of display of and access to existing museum collections. Benefits of digitization are usually based on the use of networked media (the Internet), which allows access from anywhere anytime anyhow. Objects can be accessed at home on a desktop at night or on the street from a mobile phone during holidays. • Although museums can have works that are restricted by very specific copyrights, museums can also have works that have passed into the public domain either through the passage of time or because the artist has chosen to do so. Works in the public domain are what one’ll most often find on museum Git. Hub accounts.
Some active museum Git. Hub accounts Museum: Tate Git. Hub link: Posted rights/license: https: //github. com/tategallery/collectio CC 0 1. 0 Universal, and requests n attribution CCo 1. 0 Universal, except for images, says to contact their R&R Carnegie Museum of Art https: //github. com/cmoa/collection Mo. MA https: //github. com/Museumof. Modern. A CCo 1. 0 Universal, except for rt/collection images, says give attribution
Github Carnegie Museum of Art in Pittsburgh, Pennsylvania
Artwork Information (1) Carnegie Museum of Art in Pittsburgh, Pennsylvania Header title Description Example The main title that identifies the object or artwork. No Portrait of A Boy OR Wheatfields After multiples. the Rain. creation_date The human readable date of creation for the object. Note that this is a string and may not be a valid date. creation_date_earliest This is the earliest date the object could have been created. May be null if no date known. May be the same as creation_date_latest, which indicates an exact date known. 33163 creation_date_latest This is the latest date the object could have been created. May be null if no date known. May be the same as creation_date_earliest, which indicates an exact date known. 33163 medium Material of which this is this object/artwork is made. accession_number This is a number assigned by the museum when it takes 2001. 45. 3 OR 2013. 29. 1 A-B OR 96. 1 official ownership of an object. c. 1950” OR date unknown Oil on canvas OR Acrylic on board OR Plastic, glass, and rubber
Artwork Information (2) Carnegie Museum of Art in Pittsburgh, Pennsylvania id A unique string that identifies the record of the object 692 a 68 c 5 -af 1 e-4124 -80 f 1 in the collections database. cbf 38 be 51 abe credit_line Identifies and gives credit to the person, foundation, or Gift of John Doe OR Museum Purchase, method by which the object was acquired. by Exchange. date_acquired The date the object became the legal property of the museum. department Fine Arts OR Decorative The department within the museum that is responsible Arts ORPhotography OR Contemporary for the item. Art physical_location The location of the object/artwork within the museum. When an object is on view in the galleries, a specific Scaife Gallery 8 OR On loan ORNot on gallery location is given. When an object is in storage, view. the location will only say Not on View. If an object is on loan to another institution, it will say on loan. item_width The maximum width of the artwork/object in inches. 33163 11. 5
Artwork Information (3) Carnegie Museum of Art in Pittsburgh, Pennsylvania item_height item_depth item_diameter web_url The maximum height of the artwork/object in inches. The maximum depth of the artwork/object in inches. The maximum diameter of the artwork/object in inches. The URL of the collection page for this item. 11. 5 14. 5 180. 53 Mary Cassatt [1844 -1926], France; Galeries Durand-Ruel, Paris, France, by August 1892 [1]; Durand-Ruel Galleries, New York, NY, 1895; purchased by Department of Fine Arts, Carnegie Institute, Pittsburgh, PA, October 1922. NOTES: [1] Recorded in stock book in August 1892. provenance_text The ownership history of an object/artwork. classification The name of a group to which the work belongs within the museum's classification scheme, based Prints OR Photographs on similar characteristics.
Image Information Carnegie Museum of Art in Pittsburgh, Pennsylvania Header Description image_url The URL of a thumbnail image of the artwork. image_rights The rights text associated with the linked image. (not currently exported)
Artist Information Carnegie Museum of Art in Pittsburgh, Pennsylvania Header artist_id party_type full_name cited_name role nationality birth_date death_date birth_place death_place Description Example This is a unique identifier for the artist. 123456 This is the type of entity represented. Possible values are: Organization OR Person OR Collaboration The full name of the artist, creator, or creators, who made John Singer Sargent. the object. The name of the artist as used in a standard citation, with Cassatt, Mary. surname first, and forename last. Describes a person’s involvement with this object. designer, manufacturer, artist. The nationality of the artist/creator. French, American, Italian. The birthdate of the artist/creator. Precision may vary based 1959 -01 -01 OR 1959 on how much is known about the artist The death date of the artist/creator. Precision may vary 1959 -01 -01 OR 1959 based on how much is known about the artist Name of place of birth, with as much specificity as possible, preference is for City, Country if known. If city is unknown, Paris, France. then list only country. Name of place of death, with as much specificity as possible, preference is for City, Country if known. If city is unknown, Paris, France. then list only country.
CSV, basic sharing • A basic approach to share data is the comma separated value (CSV) format • it is a text format, accessible to all apps • each line (even if blank) is a row • in each row, each value is separated from the others by a comma (even if it is blank) • cannot capture complex things like formula
Spread sheet and corresponding CSV file Title, Artist "Ferdinandsbrücke Project, Vienna, Austria, Elevation, preliminary version", Otto Wagner "City of Music, National Superior Conservatory of Music and Dance, Paris, France, View from interior courtyard", Christian de Portzamparc "Villa near Vienna Project, Outside Vienna, Austria, Elevation", Emil Hoppe
JSON supports array whereas XML does not CSV JSON Title, Artist [ "Ferdinandsbrücke Project, Vienna, Austria, Elevation, preliminary version", Otto Wagner "Title": "Ferdinandsbrücke Project, Vienna, Austria, Elevation, preliminary version", "Artist": "Otto Wagner" }, { "Title": "City of Music, National Superior Conservatory of Music and Dance, Paris, France, View from interior courtyard", "Artist": "Christian de Portzamparc" }, { "Title": "Villa near Vienna Project, Outside Vienna, Austria, Elevation", "Artist": "Emil Hoppe" } ] "City of Music, National Superior Conservatory of Music and Dance, Paris, France, View from interior courtyard", Christian de Portzamparc "Villa near Vienna Project, Outside Vienna, Austria, Elevation", Emil Hoppe {
Python Library Pandas § adds data structures and tools designed to work with table-like data § provides tools for data manipulation: reshaping, merging, sorting, slicing, aggregation etc. § allows handling missing data Link: http: //pandas. pydata. org/ 19
Pandas vs Excel • Pandas operates right on the back of Python. As a result, is extremely fast and efficient. In Excel, once you exceed 10, 000 rows, it starts to slow down — considerably. • Pandas, on the other hand, has no real limit and handles millions of data points seamlessly. In terms of pure space, Excel caps a single spreadsheet at 1, 048, 576 rows exactly. At that point, your calculations would take forever to compute. More likely, Excel would just crash. • Pandas, however, has no limitation to the number of data points you can have in a Data. Frame (their version of a data set). It’s limited only by the computing power and memory of the computer it is running on.
Pandas • It is also easier to create and use complex equations and calculations on your data. • You can apply hundreds of computations to millions of data points instantly with pandas. • Pandas is also very effective for visualizing data to see trends and patterns. Although Excel’s interface for making graphs and charts is easy to use, pandas is much more malleable and can do much more. Graphs are much more customizable and you can create pretty much any concept you want with pandas.
Python Library Num. Py § introduces objects for multidimensional arrays and matrices, as well as functions that allow to easily perform advanced mathematical and statistical operations on those objects § provides vectorization of mathematical operations on arrays and matrices which significantly improves the performance Link: http: //www. numpy. org/ 22
Python Library matplotlib § python 2 D plotting library which produces publication quality figures in a variety of formats § line plots, scatter plots, barcharts, histograms, pie charts etc. § relatively low-level; some effort needed to create advanced visualization Link: https: //matplotlib. org/ 23
Python Libraries Seaborn and Plotly § based on matplotlib § provide high level interface for drawing attractive statistical graphics Links: https: //seaborn. pydata. org/ , https: //plot. ly 24
Run Jupyter Online with Colab is a free cloud service based on Jupyter Notebooks for education and research. You can write and execute python code, save and share your analyses, and access powerful computing resources, all for free from your browser. To start working with Colab you first need to log in to your google/gmail account, then go to this link https: //colab. research. google. com.
EXAMPLES: Contain a number of Jupyter notebooks of various examples. RECENT: Jupyter notebook you have recently worked with. GOOGLE DRIVE: Jupyter notebook in your google drive. GITHUB: You can add Jupyter notebook from your Git. Hub but you first need to connect Colab with Git. Hub. UPLOAD: Upload from your local directory.
If you want to open something specific, drop the “File” menu down to “Open Notebook…”
New notebook
Download Jupyter Notebook in your PC
Loading Python Libraries In [ ]: #Import Python Libraries import numpy as np import pandas as pd import matplotlib as plt import seaborn as sns Press Shift+Enter to execute the cell in colab cell 30
Reading data using pandas Open cmoa. csv from Carnegie Museum of Art In [ ]: #Read csv file import warnings. filterwarnings('ignore') url='https: //raw. githubusercontent. com/cmoa/collection/master/cmoa. csv ' data =pd. read_csv(url) 31
Presentation of the columns In [ ]: #Columns of file data. columns Index(['title', 'creation_date_earliest', 'creation_date_latest', 'medium', 'accession_number', 'id', 'credit_line', 'date_acquired', 'department', 'physical_location', 'item_width', 'item_height', 'item_depth', 'item_diameter', 'web_url', 'provenance_text', 'classification', 'image_url', 'artist_id', 'party_type', 'full_name', 'cited_name', 'role', 'nationality', 'birth_date', 'death_date', 'birth_place', 'death_place'], dtype='object')
Selecting a column in a Data Frame Method 1: name: Subset the data frame using column data['title'] Method 2: attribute: Use the column name as an data. title 33
Data Frames groupby method Using "group by" method we can: • Split the data into groups based on some criteria • Calculate statistics (or apply a function) to each group In [ ]: #Group data using rank df_medium = data. groupby(['medium']) In [ ]: #Calculate mean value for each numeric column per each group df_medium. mean() 34
Data Frames groupby method Once groupby object is create we can calculate various statistics for each group: In [ ]: # Calculate mean value for a specific numeric column per each group df. groupby('medium')[['item_width']]. mean() Note: If single brackets are used to specify the column (e. g. 'item_width), then the output is Pandas Series object. When double brackets are used the output is a Data Frame 35
Data Frame: filtering To subset the data we can apply Boolean indexing. This indexing is commonly known as a filter. For example if we want to subset the rows in which the item_width value is greater than 13: In [ ]: df_sub = data['item_width'] > 13 ] Any Boolean operator can be used to subset the data: > greater; >= greater or equal; < less; <= less or equal; == equal; != not equal; In [ ]: df_f = data['medium'] == 'gelatin silver print' ] 36
Data Frames: Slicing There a number of ways to subset the Data Frame: • one or more columns; • one or more rows; • a subset of rows and columns. Rows and columns can be selected by their position or label 37
Data Frames: Slicing When selecting one column, it is possible to use single set of brackets, but the resulting object will be a Series (not a Data. Frame): In [ ]: #Select column title: data['title'] When we need to select more than one column and/or make the output to be a Data. Frame, we should use double brackets: In [ ]: #Select column salary: data[['title', 'item_width']] 38
Data Frames: Selecting rows If we need to select a range of rows, we can specify the range using ": " In [ ]: #Select rows by their position: data[10: 20] Notice that the first row has a position 0, and the last value in the range is omitted. So for 0: 10 range the first 10 rows are returned with the positions starting with 0 and ending with 9 39
Data Frames: method loc If we need to select a range of rows, using their labels we can use method loc: In [ ]: #Select rows by their labels: df_sub. loc[10: 20, ['title', 'item_width', 'item_heigth']] 40
Data Frames: method iloc (summary) data. iloc[0] # First row of a data frame data. iloc[i] #(i+1)th row data. iloc[-1] # Last row data. iloc[: , 0] # First column data. iloc[: , -1] # Last column data. iloc[0: 7] #First 7 rows data. iloc[: , 0: 2] #First 2 columns data. iloc[1: 3, 0: 2] #Second through third rows and first 2 columns data. iloc[[0, 5], [1, 3]] #1 st and 6 th rows and 2 nd and 4 th columns 41
Data Frames: Sorting We can sort the data by a value in the column. By default the sorting will occur in ascending order and a new data frame is return. In [ ]: # Create a new data frame from the original sorted by the column Salary df_sorted = data. sort_values( by ='item_width') We can sort the data using 2 or more columns: In [ ]: df_sorted = data. sort_values( by =['item_width', 'item_heigth'], ascending = [True, False]) 42
Missing Values Missing values are marked as Na. N In [ ]: # Select the rows that have at least one missing value data[data. isnull(). any(axis=1)] 43
Missing Values There a number of methods to deal with missing values in the data frame: df. method() description dropna() Drop missing observations dropna(how='all') Drop observations where all cells is NA dropna(axis=1, how='all') Drop column if all the values are missing dropna(thresh = 5) Drop rows that contain less than 5 non-missing values fillna(0) Replace missing values with zeros isnull() returns True if the value is missing notnull() Returns True for non-missing values 44
Aggregation Functions in Pandas Aggregation - computing a summary statistic about each group, i. e. • compute group sums or means • compute group sizes/counts Common aggregation functions: min, max count, sum mean, median std, var 45
Aggregation Functions in Pandas agg() method is useful when multiple statistics are computed per column: In [ ]: data[['item_width', 'item_height']]. agg(['min', 'mean', 'max']) Out[ ]: 46
Mo. MA github
Reading data using pandas Open Artists. csv from Mo. MA
Nationality of artists
Gender of artists
The example code for Mo. MA can be executed in colab https: //colab. research. google. com/drive /10 xr. EKzn 4 ho. Cv. Qh. Dz. ZOYPTYEddh. Q 7 AU f 7 You can save a copy in your drive to execute the code from your PC via colab. To start working with Colab you just need to log in to your gmail account
Helpful Function import plotly. offline as py import plotly. graph_objs as go py. init_notebook_mode(connected=False) def configure_plotly_browser_state(): import IPython display(IPython. core. display. HTML(''' <script src="/static/components/requirejs/require. js"></script> <script> requirejs. config({ paths: { base: '/static/base', plotly: 'https: //cdn. plot. ly/plotly-1. 5. 1. min. js? noext', }, }); </script> ''')) from plotly. offline import download_plotlyjs, plot, iplot def create. Table. Freq. Figure(data, name, n=5, m=1000): s = pd. Data. Frame(data[name]. value_counts()) s. columns=['Count'] s['Name'] = s. index. tolist() s. sort_values(by="Count", ascending=False) s = s. reset_index(drop=True) print(s. head(n)) plt. figure(figsize=(80, 80)) temp = s[s['Count']>=m] labels=temp['Name'] values=temp['Count'] trace=go. Pie(labels=labels, values=values, title= name) iplot([trace])
Reading data using pandas Open cmoa. csv from Carnegie Museum of Art In [ ]: #Import Python Libraries import numpy as np import pandas as pd import matplotlib as plt import seaborn as sns #Read csv file In [ ]: import warnings. filterwarnings('ignore') url='https: //raw. githubusercontent. com/cmoa/collection/master/cmoa. csv ' data =pd. read_csv(url) 53
Plot information about column ‘medium’ In [ ]: configure_plotly_browser_state() create. Table. Freq. Figure(data, 'medium', n=5, m=400)#the top n with at least m value counts Out[ ]: Count Name 3492 gelatin silver print 1703 woodblock print on paper 1076 lithograph on paper 825 etching 801 oil on canvas
Plot information about column ‘credit_line’ In [ ]: configure_plotly_browser_state() create. Table. Freq. Figure(data, 'credit_line', n=5, m=500) Out[ ]: Count 2468 1052 911 746 725 Name Bequest of Dr. James B. Austin Gift of the Carnegie Library of Pittsburgh Leisser Art Fund Purchase: gift of the Drue Heinz Trust Purchase: gift of Henry J. and Drue Heinz
Plot information about column ‘classification’ In [ ]: configure_plotly_browser_state() create. Table. Freq. Figure(data, 'classification', n=5, m=500) Out[ ]: Count 8907 5605 4835 2161 1364 Name prints drawings and watercolors photographs Ceramics paintings
Plot information about column ‘nationality’ In [ ]: configure_plotly_browser_state() create. Table. Freq. Figure(data, 'nationality', n=5, m=500) Out[ ]: Count 13841 2225 2003 1365 1017 Name American Japanese French English British
Plot information about column ‘classification’ for a specific nationality In [ ]: configure_plotly_browser_state() create. Table. Freq. Figure(data['nationality']=='Japanese'], 'classification', n=5, m=20) ) Out[ ]: Count 2044 38 29 28 16 Name prints drawings and watercolors Ceramics Metals paintings
The example code for Carnegie Museum can be executed in colab https: //colab. research. google. com/d rive/1 g-v. G_wx. LGz. CH 6 Ug 8 k-Nz 9 b. O 5 -Oguu. At. You can save a copy in your drive to execute the code from your PC via colab. To start working with Colab you just need to log in to your gmail account
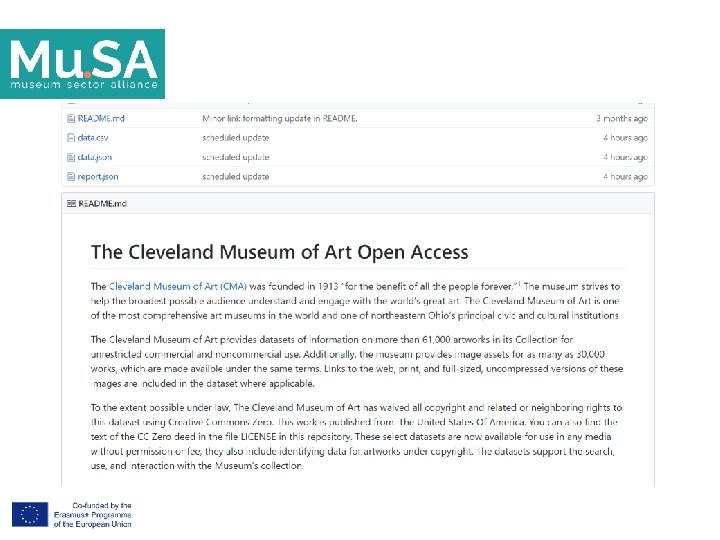
Reading data using pandas Open data. csv from Cleveland Museum of Art In [ ]: #Read csv file import warnings. filterwarnings('ignore') url='https: //media. githubusercontent. com/media/Cleveland. Museum. Art/openaccess/mast er/data. csv' data =pd. read_csv(url) 61
Columns
Plot information about column ‘culture’
Plot information about column ‘technique’
Plot information about column ‘support_materials’
Plotting culture for lithograph technique
The example code for Cleveland Museum can be executed in colab https: //colab. research. google. com/drive/1 LIqd bhnw 64 P-Xvmw 05 l. CRTBYSz 7 Eupv. M You can save a copy in your drive to execute the code from your PC via colab.
Synopsis • This presentation was about the extraction of knowledge about Artworks and Artists from Museum Githubs • Now that you finished watching it, you should be able to: • Use information from a museum Github; • Implement queries for finding paintings of an artist; • Implement queries for counting Objects in a museum; • Implement queries for counting nationality or gender of artists; • Graph plots for culture or technique in a collection.
List of references • https: //colab. research. google. com • https: //github. com • https: //matplotlib. org • https: //pandas. pydata. org • https: //plot. ly
Presenter’s bio page • The research interests of Sotiris Kotsiantis are in the field of data science and its application in the education and culture. He has a lot of publications to his credit in international journals and conferences: https: //dblp. org/pers/hd/k/Kotsia ntis: Sotiris_B= • Assistant Professor in University of Patras, Greece • Tutor in Hellenic Open University
Thank you for your attention! Credits • • • www. project-musa. eu Author: Sotiris Kotsiantis, University of Patras Technical Reviewers: Christos Pierrakeas and Panagiota Polymeropoulou, HOU Scientific Reviewer: Maria Manuela Pinto, UPorto musa@daissy. eap. gr @Museum. Sector. Alliance #Museum. Sector. Alliance Project Number: 575907 -EEP-1 -2016 -1 -EL-EPPKA 2 -SSA This project has been funded with support from the European Commission. This presentation reflects the views only of the author, and the Commission cannot be held responsible for any use which may be made of the information contained therein.