Frank Revitte National Weather Service Weather Forecast Office


 Named Storms 12 14 ?")


 Landfall 9 pm Aug 17 in SE LA/MS as category 5")
 Landfall 10 pm July 5 in SE LA as a category")


 account for over three quarters of")


 Size (bigger more")


 ~25% chance of flooding in a")


 flooding Does")


- Slides: 51
Frank Revitte National Weather Service Weather Forecast Office New Orleans/Baton Rouge
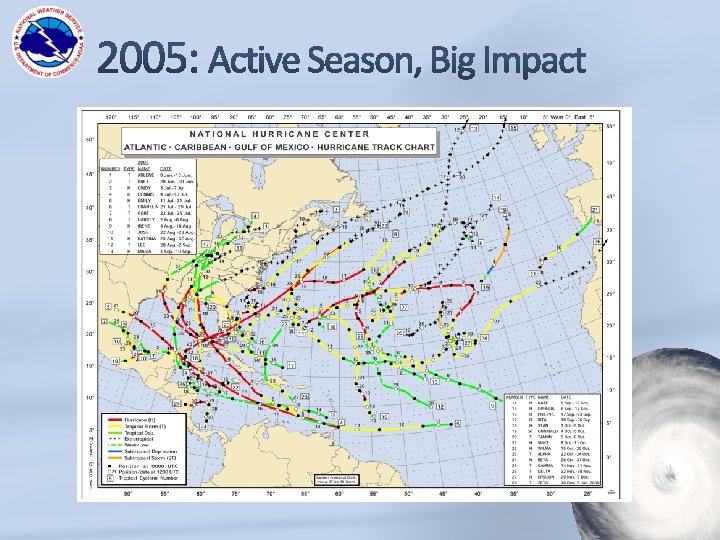
• Above normal activity • 17 Total Named Storms • 7 Tropical Storms • 4 Hurricanes • 6 Major Hurricanes Record Setting Season Not the most active, 2005 with 28 named, 7 major Irma – Strongest Atlantic Storm, held intensity for 37 hours Harvey – Most rain in the U. S. with 60 inches First time two CAT 4 landfalls in the CONUS, most active September on record, and first CAT 5 impacting Dominca
Average Colo. State Fcst NOAA Fcst (Released late May) Named Storms 12 14 ? ? Hurricanes 6 7 ? ? Major Hurricanes 2 3 ? ? Caution: it only takes one
• Neutral El Niño • Well below normal activity • 7 Named Storms • 4 Hurricanes • 1 Major Hurricane • Andrew caused significant impacts across FL and LA
• It takes MUCH more than warm oceans for hurricane formation and sustainability • Generally • El Nino = fewer Atlantic storms • La Nina = more Atlantic storms • Landfall Location - ? ? • Reality = it only takes one, so we MUST prepare like we will get hit every year (at work and at home)
Hurricane Camille (1969) Landfall 9 pm Aug 17 in SE LA/MS as category 5 with estimated gusts of 150 -170 mph Classified as a tropical storm near Grand Cayman at 2 pm Aug 14 th; about 80 hrs prior to landfall
Hurricane Cindy (2005) Landfall 10 pm July 5 in SE LA as a category 1 with winds of 75 mph. Most areas experienced tropical storm force winds around 60 mph. Was not classified 72 hrs prior to landfall Classified as a tropical depression at 4 pm July 3; about 48 hours prior to landfall
Beginning in 2017, NHC will have the option to issue watches and warnings for disturbances pose a threat of bringing tropical storm or hurricane conditions to land within 48 hours but aren’t yet tropical cyclones Will also be accompanied by the full suite of tropical products Systems would be identified as “Potential Tropical Cyclones” with the same numbering system as tropical depressions
Cyclone Beginning in 2017, NHC will have the option to issue watches and warnings for disturbances pose a threat of bringing tropical storm or hurricane conditions to land within 48 hours but aren’t yet tropical cyclones Will also be accompanied by the full suite of tropical products Systems would be identified as “Potential Tropical Cyclones” with the same numbering system as tropical depressions
Cyclone cy·clone ˈsīˌklōn/ noun. METEOROLOGY 1. a system of winds rotating inward to an area of low atmospheric pressure, with a counterclockwise (northern hemisphere) or clockwise (southern hemisphere) circulation; a depression. 2. another term for tropical storm.
Verified Position 1 PM Mon Forecast Position 1 PM Mon Along track errors can reduce lead time. TS winds started about 12 hours earlier than forecast 72 hrs prior
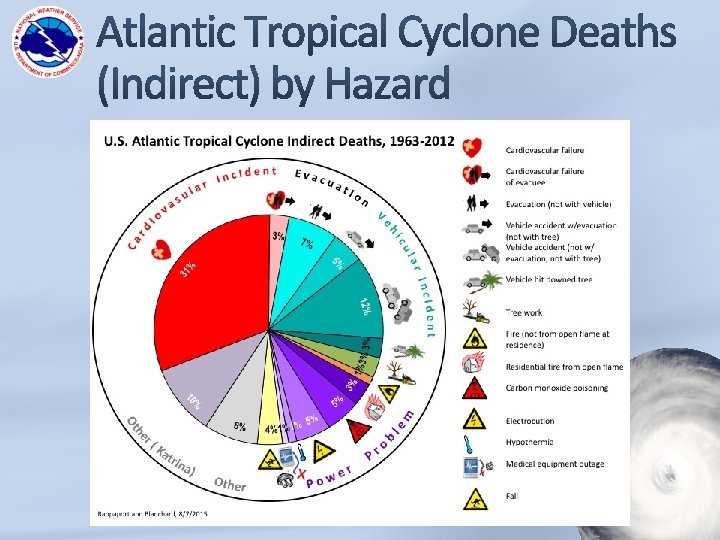
Flooding from storm surge and fresh water (rain) account for over three quarters of deaths directly attributable to Atlantic Basin Tropical Cyclones
1. 2. 3. 4. 5. 6. 7. Where the circulation center crosses the coast Direction of storm motion relative to the coast Wind strength (storm intensity) Radius of maximum winds Overall size of storm (outer wind radii) Slope of the continental shelf Shape of the coastline and other coastal features (barrier islands, bays, rivers, levees, etc) …It’s Complicated!
Cat 3 Moving NW at 10 mph Cat 3 Moving NE at 10 mph Angle of approach will determine which “nooks and crannies” the water will get into and become trapped
Cat 3 Moving NW at 10 mph Cat 3 Moving NW at 5 mph Longer duration of strong winds allows water to work its way farther inland, while also resulting in a slight reduction along the immediate coast in some areas
Single Track Storm Surge Plot
same storm – landfall moved west
Same storm – landfall moved east
Even Small Wrinkles Matter Hurricane Matthew
1. 2. 3. 4. 5. 6. Forward Speed (slower more rain) Size (bigger more rain) Rain Rate (atmospheric moisture content) Vertical Wind Shear (more rain on one side) Topography (more rain on windward side) Fronts/Upper-Level Troughs …It’s Complicated!
• 1962 TD- 23. 14” • 1989 TS Allison- 25. 67” • 1998 TS Frances- 22. 39” • 2001 TS Allison- 35+” near Houston, TX and 25+” in parts of SE LA • 2008 Hurricane Gustav 21. 00” (2001)
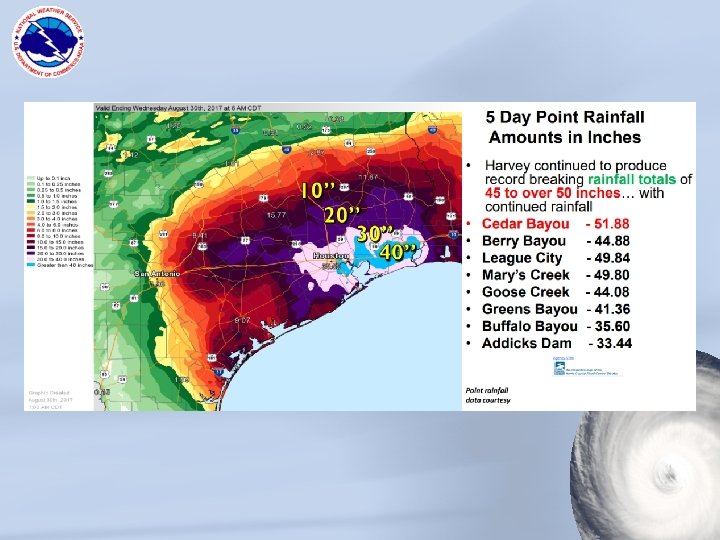
August 13 – tropical wave August 17 – tropical storm, disorganized and downgraded to a tropical wave on August 22. August 23 – tropical depression in warm Bay of Campeche waters. During the next 48 hours, became a CAT 4 hurricane. August 25 – 2 nd landfall near Port Aransas around 10 pm. Moved inland at 5 mph. Remained a tropical storm! August 30 – 3 rd landfall just west of Cameron
• • • “This is just a CAT 1 hurricane” “It has never flooded here before” “I’ve been through Katrina and Gustav, this is nothing” “I saw the news break into programming, that GFS thing says it won’t come here, phew!” “This is the same surge forecast as Gustav and I didn’t flood then” “My app has most of those lines way east of here. I like the one that says CLIPER” “We are going to evacuate for all CAT 1 hurricanes from now on” “Ah great, I have a GIS map. Finally something accurate” “We just had our 100 year storm last year”
1% annual flood risk (1% chance every year) ~25% chance of flooding in a typical 30 year mortgage We don’t use 100 year event “We just had our 100 year storm” 0. 2% annual flood risk, we don’t say 500 year event. 0. 1% annual flood risk, we don’t say 1000 year event. “It’s never flooded here before”
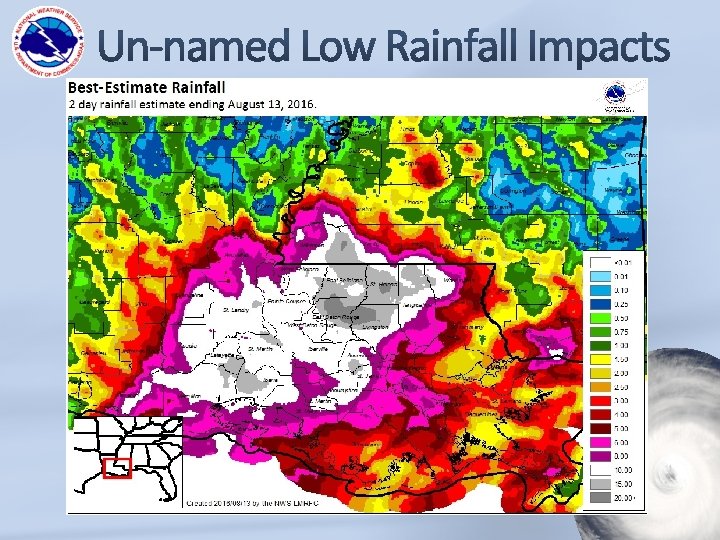
WPC Excessive Rainfall High Risk SPC Severe Weather Moderate Risk Thoughts: • WPC heavy rainfall outlooks haven’t been around as long and the thresholds are lower, but how do we communicate potential impact from these different hazards? • Is it harder to talk about other weather threats during the peak of hurricane season? • During tropical season, if it doesn’t have a name, it doesn’t get noticed?
5 -day graphic does NOT include current systems All potential development areas included For more detail, click on one of the disturbances
Model tracks for Debby on Jun 24, 2012 Model tracks for Isaac on Aug 22, 2012 Models notoriously struggle before an actual low pressure center has formed (i. e. for “invests”), so take any guidance with a grain of salt These plots can sometimes be used as a gauge of forecast confidence, but be careful, even a confident forecast can be wrong NWS meteorologists have years of experience and know the strengths and weaknesses of the different models
THE Armchair Weatherologist 4 hrs · My Mom’s Basement Look out Louisiana, latest GFS says you’ll be dealing with a category 3 hurricane in 10 days. Better start getting ready!!! 7 K 476 Comments 23, 582 Shares Just because something goes “viral” doesn’t mean it’s true Unfortunately, alarmism tends to spread much faster than level-headed reason Never take a 10 day model forecast as gospel If you have questions, just call us!
Represents most likely track of the storm CENTER Created by connecting imaginary circles representing 2/3 the average error over the past 5 years New feature: toggle on or off the initial wind field to help communicate risk outside the cone
Experimental for 2017 Available in two versions: Most likely onset Reasonable earliest onset Can toggle on or off the wind speed probability Will help with H-hour
MEOW – Category 2, NW 10 mph, High Tide Water levels noted feet above terrain (AGL) Shows overtopping of levees Uses multiple tracks and sizes, then keeps the highest value for each grid square Can be displayed reference to NAVD 88 or above ground level
• Initiated when Watches and Warnings are in effect (48 hrs prior to onset of TS winds) • Based on the current storm • Accounts for errors in speed, direction, intensity, and size • Accounts for tide • Available approximately 60 minutes after each advisory is issued
There can be a significant change in depiction when transitioning from MEOW to P-surge Potential Storm Surge Map uses “ 10 percent exceedance data – mapped onto high resolution grid. Will be available to everyone at the same time Small changes can occur from one advisory to the next – so don’t focus on exact boundaries
• This is ONLY surge flooding • NOT the forecast “Reasonable” worst case • Approx 80 min after advisory • Subtle changes possible with each update • No values shows inside risk reduction system
NOT the forecast - will likely include higher numbers than official forecast Does NOT account for flooding from heavy rainfall Will be available to everyone at the same time Subtle changes can occur with each advisory, so do not focus on hard boundaries
• Will now be tone alerted via NOAA Weather Radio and Wireless Emergency Alerts • Approximate representation also included in the public advisory and local hurricane statement text products • Issued for areas where flooding greater than 3 feet is possible • CAN be issued for areas inside the risk reduction system
Only accounts for storm surge flooding Does NOT include fresh water (rain) flooding Does NOT include any drainage flooding (water flowing downstream) Tone alerts through weather radio and WEA will likely “over warn” some areas Will be available to everyone at the same time
• Seasonal Outlooks can give us a general sense of the upcoming tropical activity, but not which areas may be most affected • Each season we need to be prepared for a direct impact – especially true for Louisiana with its unique vulnerability • Flooding from storm surge and fresh water is far and away the most dangerous hazard • Depending on storm evacuate areas of surge and flood risk.
www. weather. gov/neworleans Facebook: NWSNew. Orleans Twitter: @NWSNew. Orleans 985 -649 -0429 x 4 504 -522 -7330 x 4 Email: Frank Revitte – Warning Coordination Meteorologist Frank. Revitte@noaa. gov