
Welcome to Workshop cum interactive session on weather




- Slides: 73
Welcome to Workshop cum interactive session on weather information for Power-Sector Organized by ERLDC & ERPC Kolkata 07 Jul 2017
Institutional Setup for Power System Operation
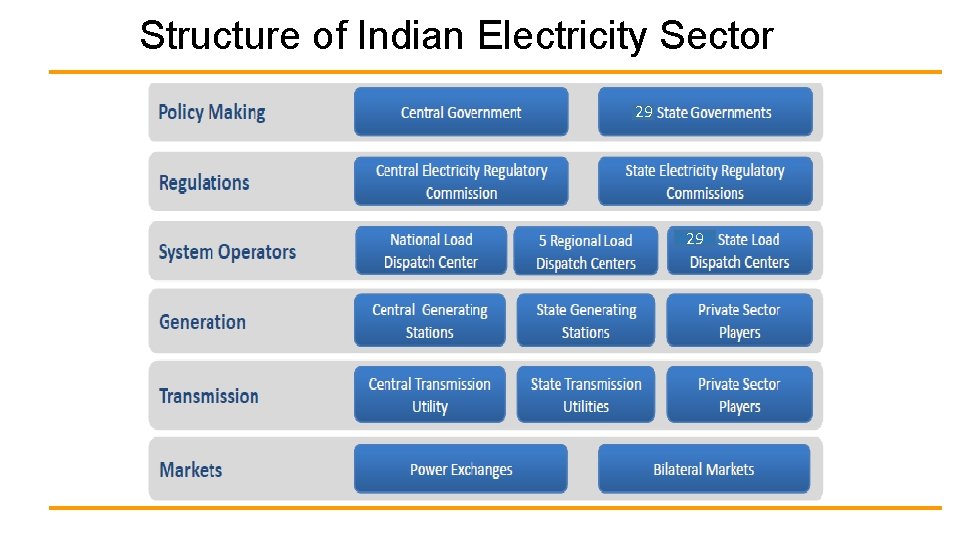
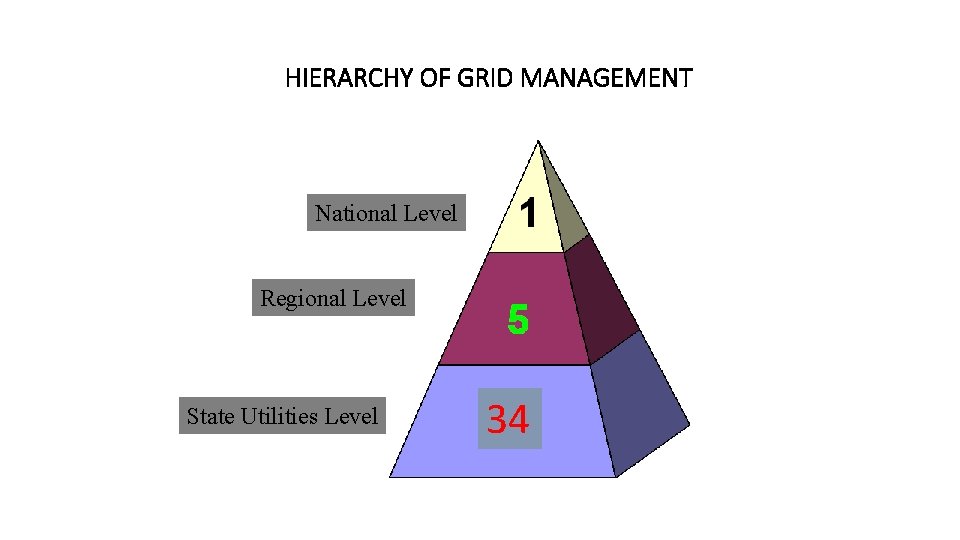
Structure of Indian Electricity Sector 29 29
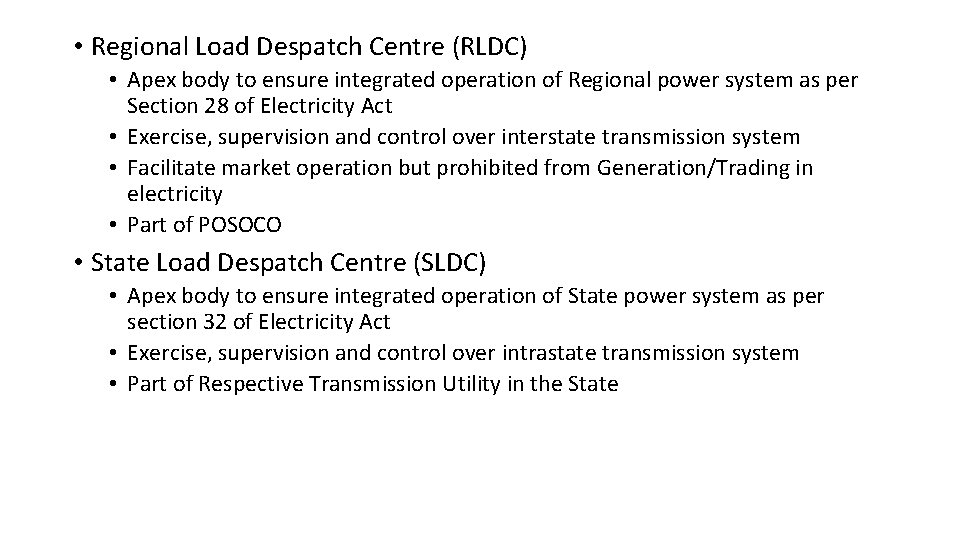
• Regional Load Despatch Centre (RLDC) • Apex body to ensure integrated operation of Regional power system as per Section 28 of Electricity Act • Exercise, supervision and control over interstate transmission system • Facilitate market operation but prohibited from Generation/Trading in electricity • Part of POSOCO • State Load Despatch Centre (SLDC) • Apex body to ensure integrated operation of State power system as per section 32 of Electricity Act • Exercise, supervision and control over intrastate transmission system • Part of Respective Transmission Utility in the State
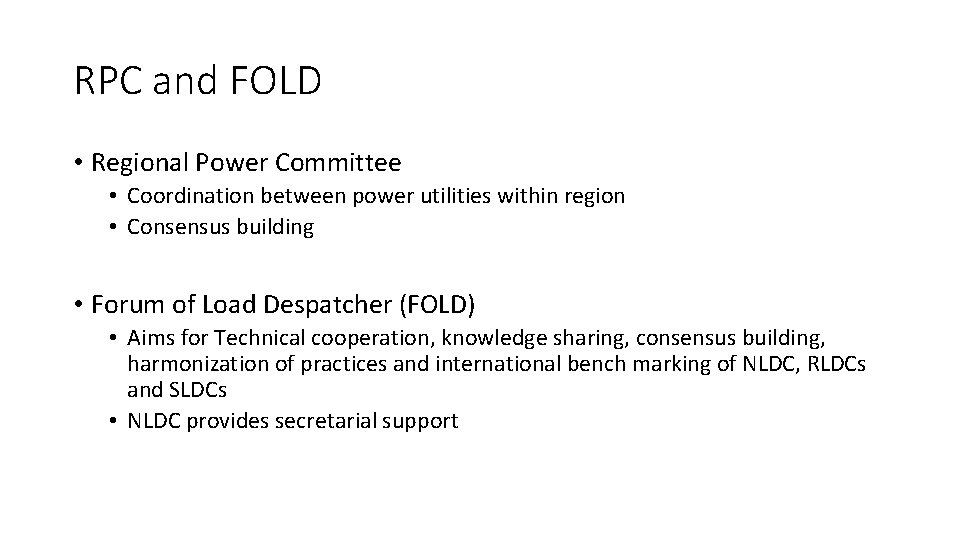
RPC and FOLD • Regional Power Committee • Coordination between power utilities within region • Consensus building • Forum of Load Despatcher (FOLD) • Aims for Technical cooperation, knowledge sharing, consensus building, harmonization of practices and international bench marking of NLDC, RLDCs and SLDCs • NLDC provides secretarial support
HIERARCHY OF GRID MANAGEMENT National Level Regional Level State Utilities Level 34
Impact of Weather in Power System Operation
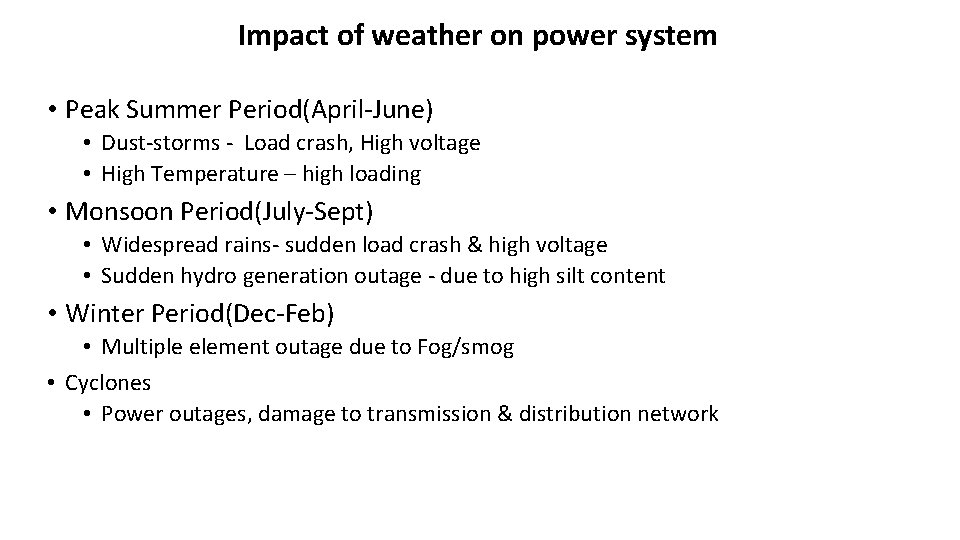
Impact of weather on power system • Peak Summer Period(April-June) • Dust-storms - Load crash, High voltage • High Temperature – high loading • Monsoon Period(July-Sept) • Widespread rains- sudden load crash & high voltage • Sudden hydro generation outage - due to high silt content • Winter Period(Dec-Feb) • Multiple element outage due to Fog/smog • Cyclones • Power outages, damage to transmission & distribution network
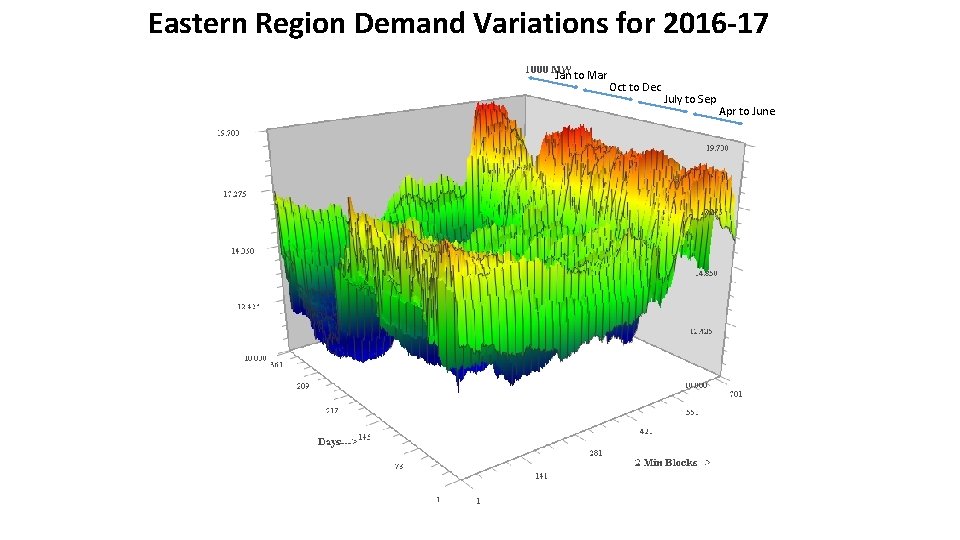
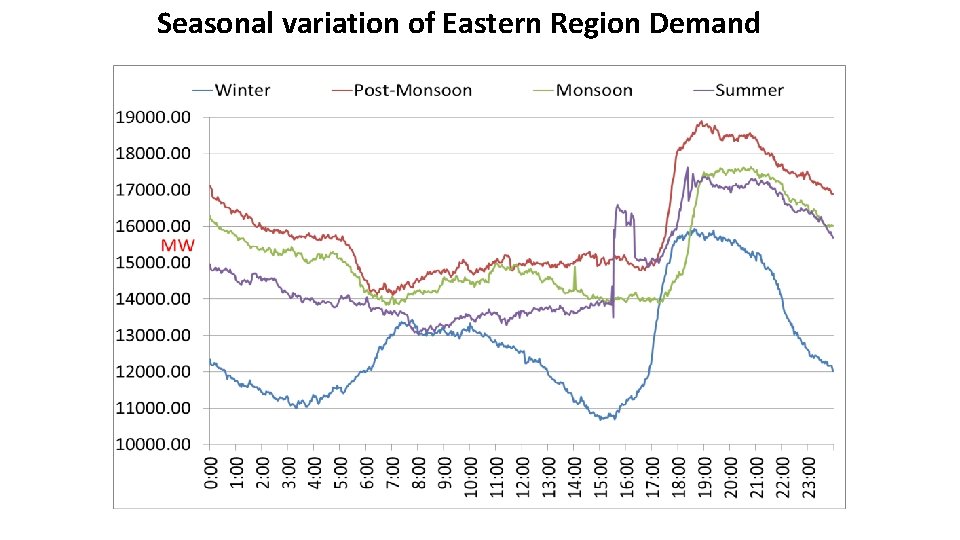
Eastern Region Demand Variations for 2016 -17 Jan to Mar Oct to Dec July to Sep Apr to June
Seasonal variation of Eastern Region Demand
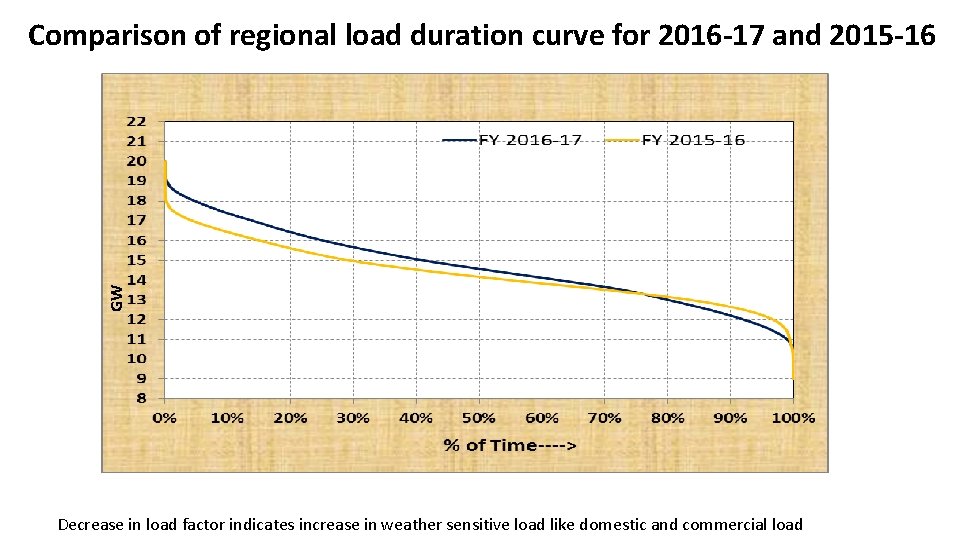
GW Comparison of regional load duration curve for 2016 -17 and 2015 -16 Decrease in load factor indicates increase in weather sensitive load like domestic and commercial load
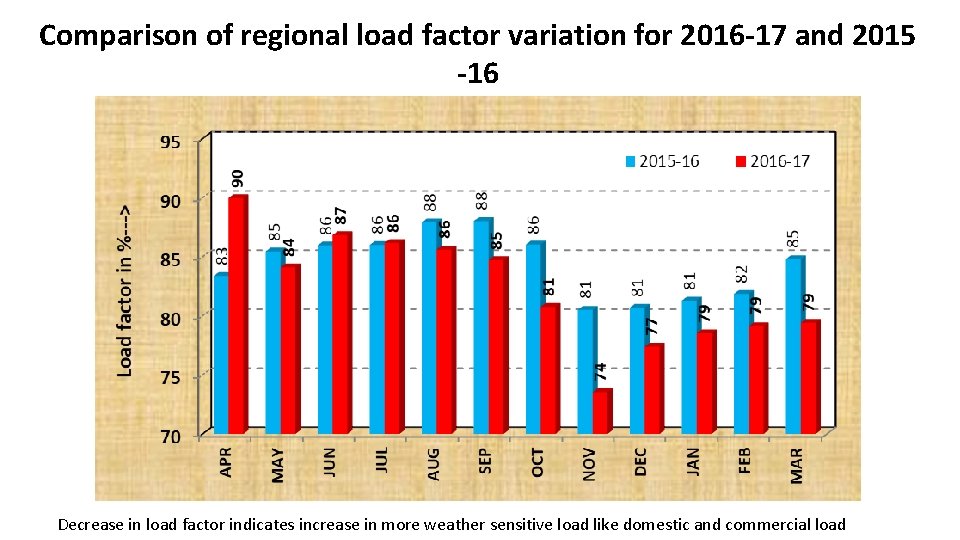
Comparison of regional load factor variation for 2016 -17 and 2015 -16 Decrease in load factor indicates increase in more weather sensitive load like domestic and commercial load
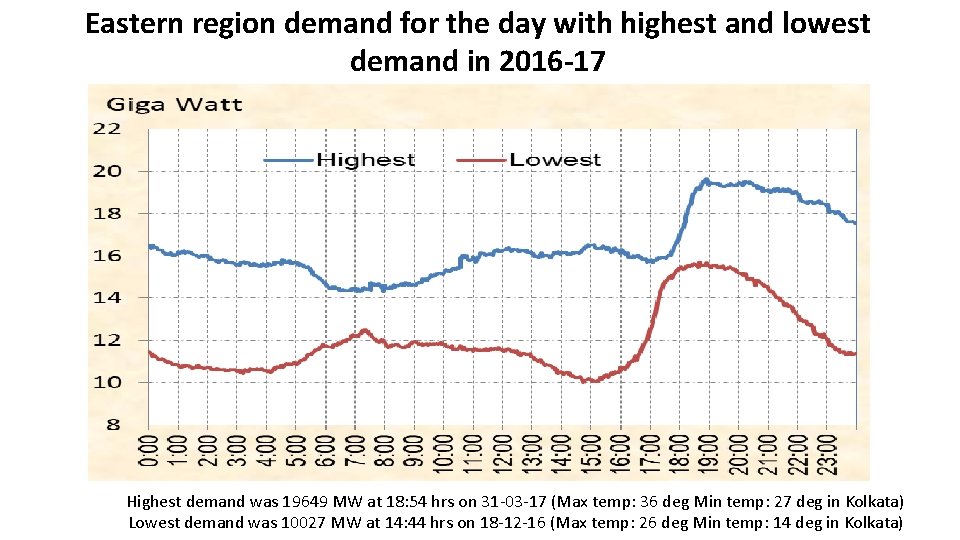
Eastern region demand for the day with highest and lowest demand in 2016 -17 Highest demand was 19649 MW at 18: 54 hrs on 31 -03 -17 (Max temp: 36 deg Min temp: 27 deg in Kolkata) Lowest demand was 10027 MW at 14: 44 hrs on 18 -12 -16 (Max temp: 26 deg Min temp: 14 deg in Kolkata)
Abnormal load variation due to cyclone
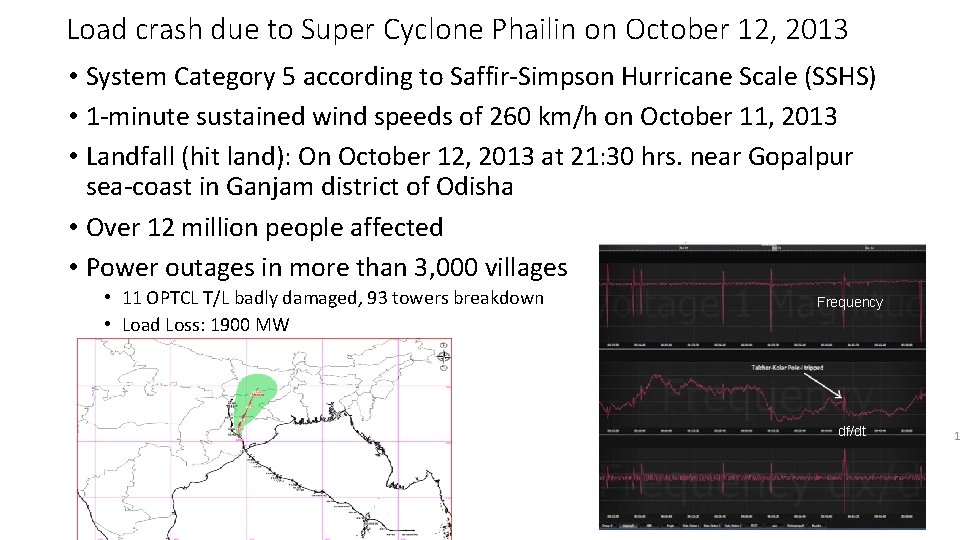
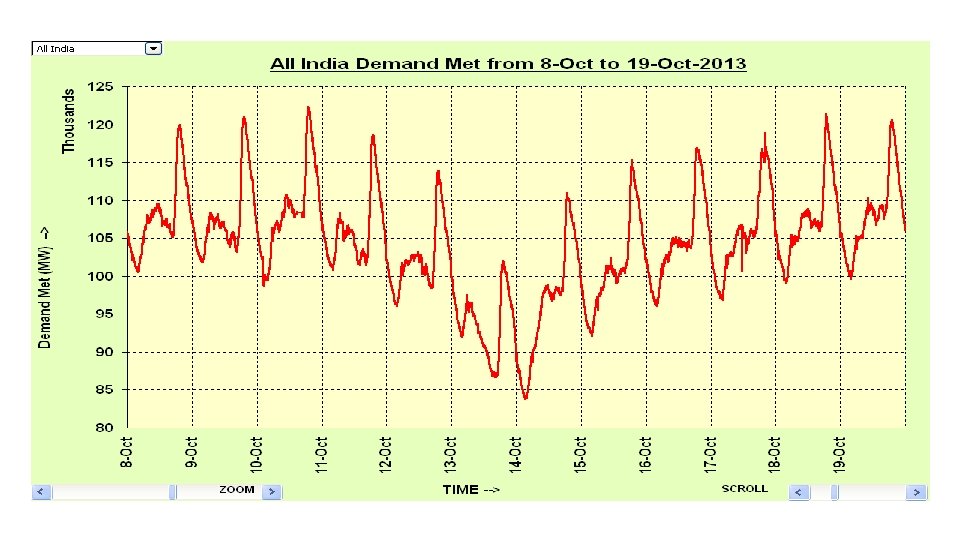
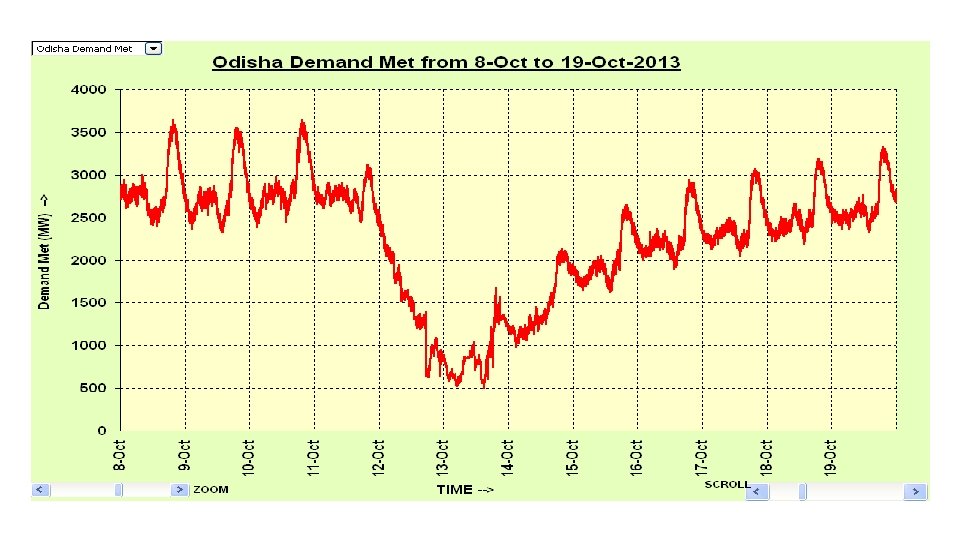
Load crash due to Super Cyclone Phailin on October 12, 2013 • System Category 5 according to Saffir-Simpson Hurricane Scale (SSHS) • 1 -minute sustained wind speeds of 260 km/h on October 11, 2013 • Landfall (hit land): On October 12, 2013 at 21: 30 hrs. near Gopalpur sea-coast in Ganjam district of Odisha Voltage • Over 12 million people affected • Power outages in more than 3, 000 villages • 11 OPTCL T/L badly damaged, 93 towers breakdown • Load Loss: 1900 MW Frequency df/dt 1
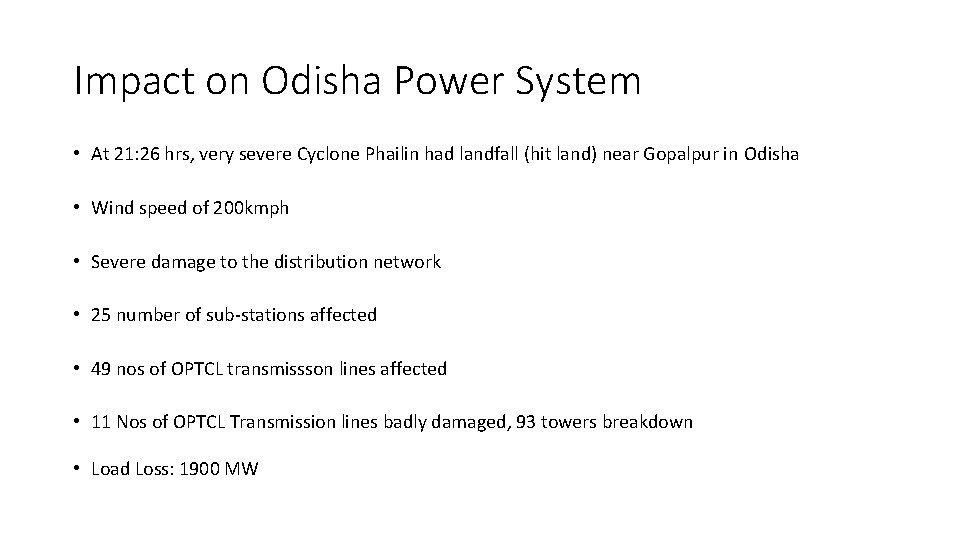
Impact on Odisha Power System • At 21: 26 hrs, very severe Cyclone Phailin had landfall (hit land) near Gopalpur in Odisha • Wind speed of 200 kmph • Severe damage to the distribution network • 25 number of sub-stations affected • 49 nos of OPTCL transmissson lines affected • 11 Nos of OPTCL Transmission lines badly damaged, 93 towers breakdown • Load Loss: 1900 MW
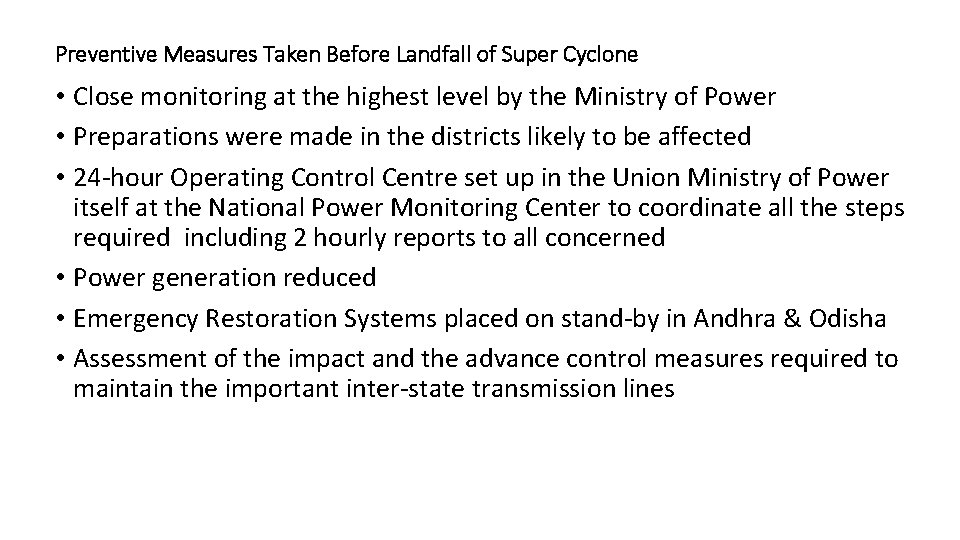
Preventive Measures Taken Before Landfall of Super Cyclone • Close monitoring at the highest level by the Ministry of Power • Preparations were made in the districts likely to be affected • 24 -hour Operating Control Centre set up in the Union Ministry of Power itself at the National Power Monitoring Center to coordinate all the steps required including 2 hourly reports to all concerned • Power generation reduced • Emergency Restoration Systems placed on stand-by in Andhra & Odisha • Assessment of the impact and the advance control measures required to maintain the important inter-state transmission lines
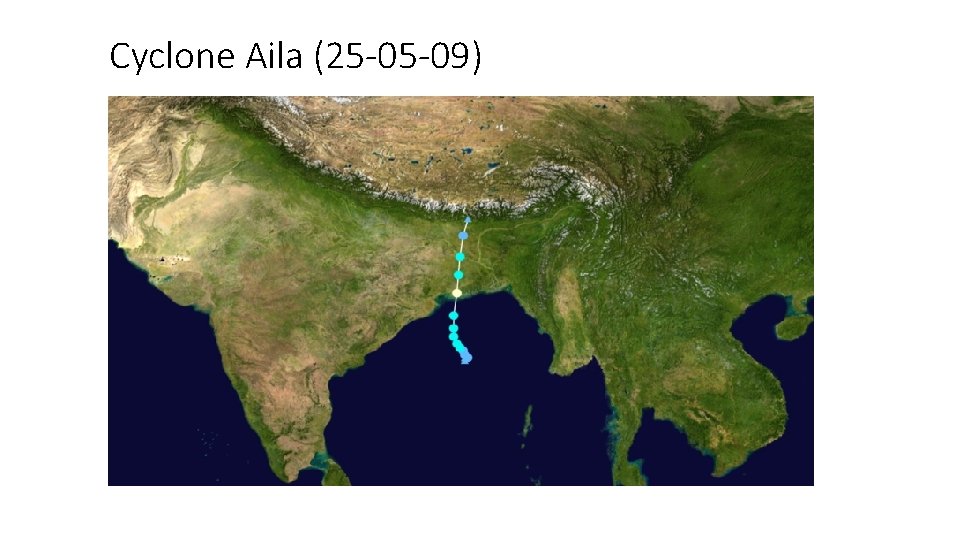
Cyclone Aila (25 -05 -09)
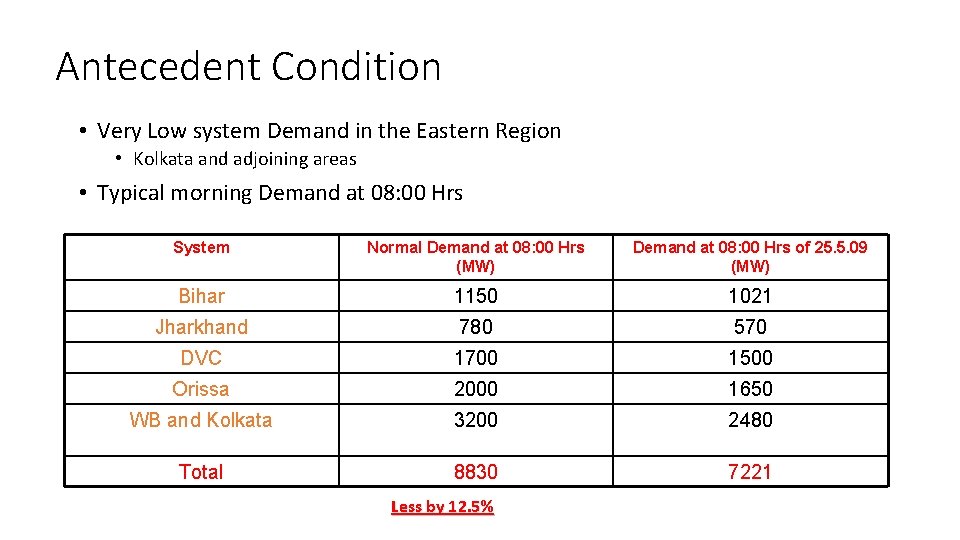
Antecedent Condition • Very Low system Demand in the Eastern Region • Kolkata and adjoining areas • Typical morning Demand at 08: 00 Hrs System Normal Demand at 08: 00 Hrs (MW) Demand at 08: 00 Hrs of 25. 5. 09 (MW) Bihar 1150 1021 Jharkhand 780 570 DVC 1700 1500 Orissa 2000 1650 WB and Kolkata 3200 2480 Total 8830 7221 Less by 12. 5%
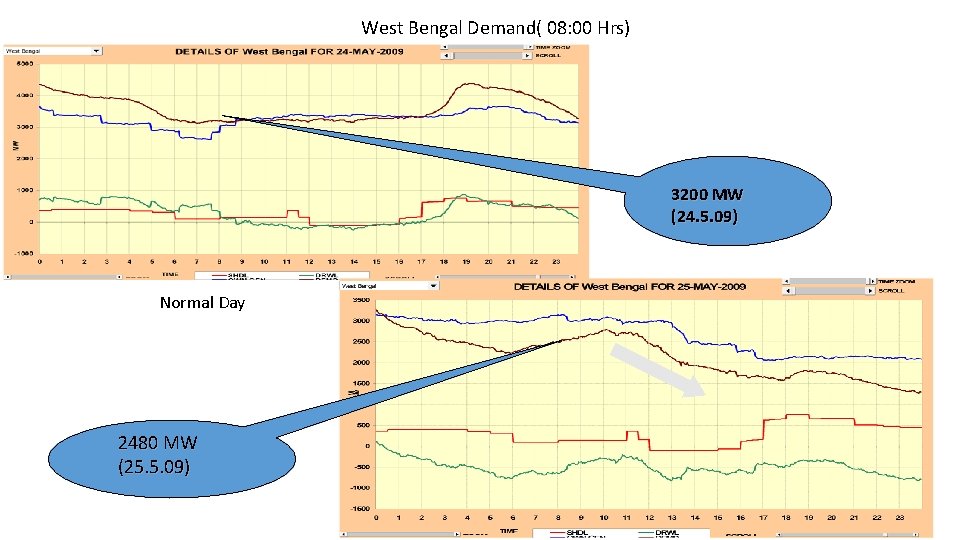
West Bengal Demand( 08: 00 Hrs) 3200 MW (24. 5. 09) Normal Day 2480 MW (25. 5. 09)
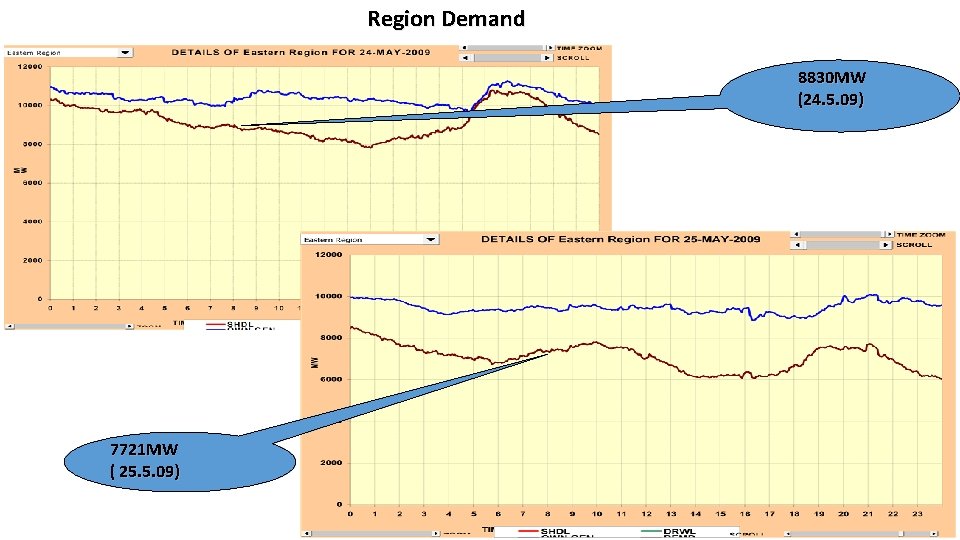
Region Demand 8830 MW (24. 5. 09) 7721 MW ( 25. 5. 09)
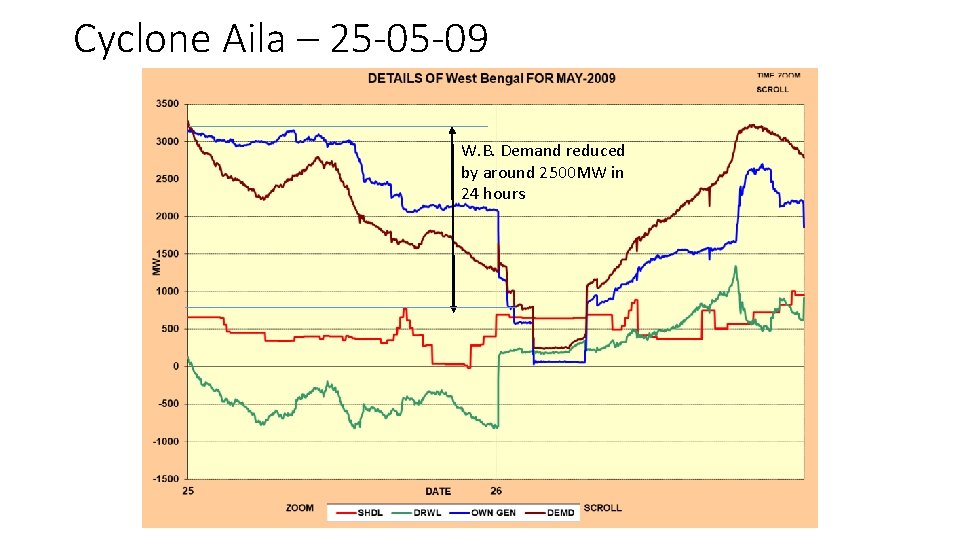
Cyclone Aila – 25 -05 -09 W. B. Demand reduced by around 2500 MW in 24 hours
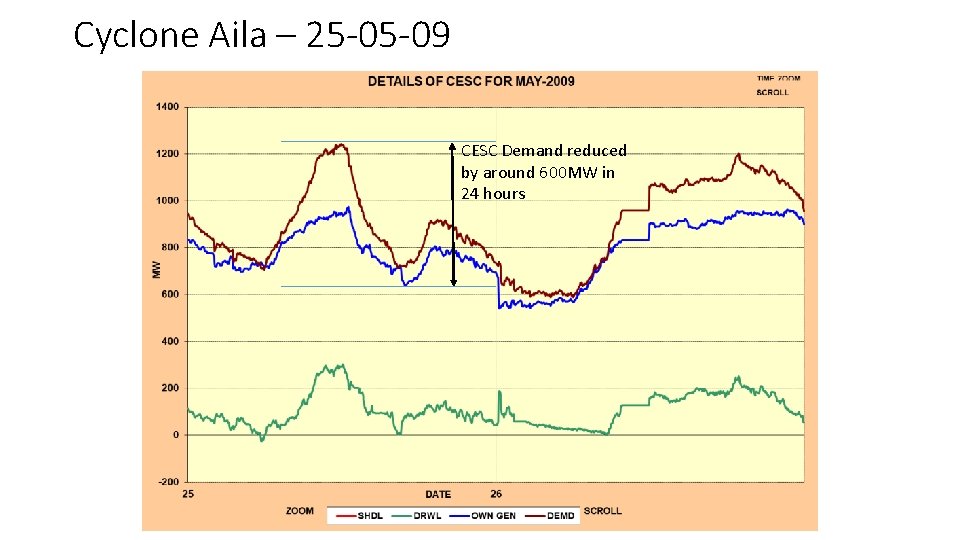
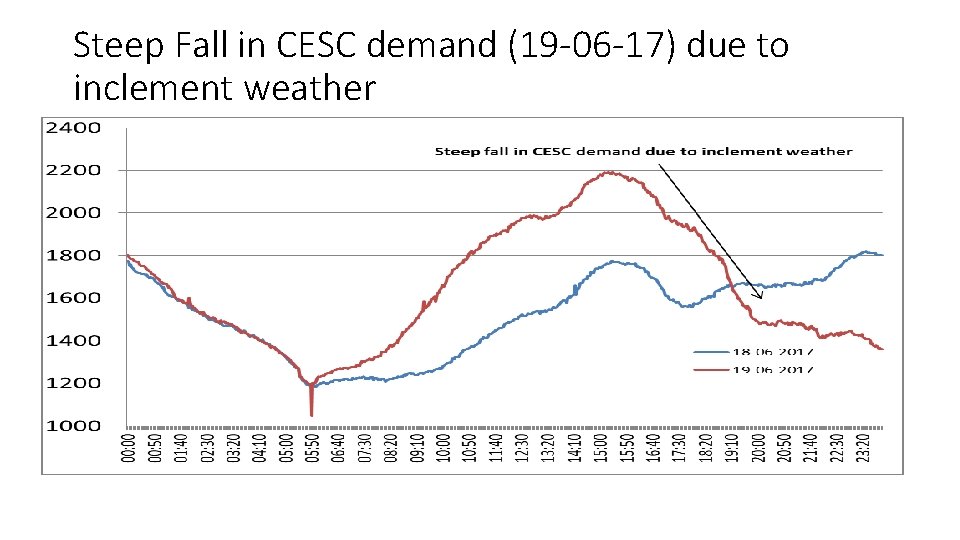
Cyclone Aila – 25 -05 -09 CESC Demand reduced by around 600 MW in 24 hours
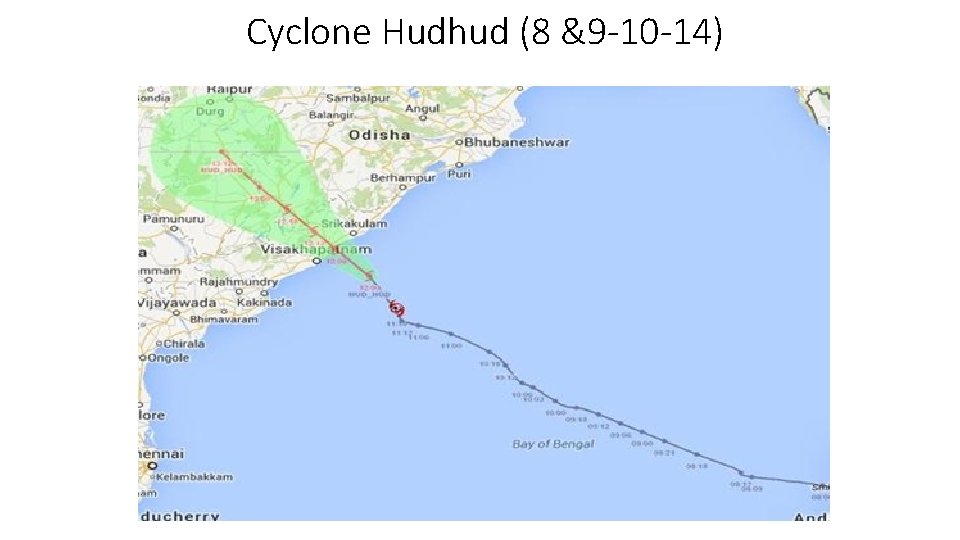
Cyclone Hudhud (8 &9 -10 -14)
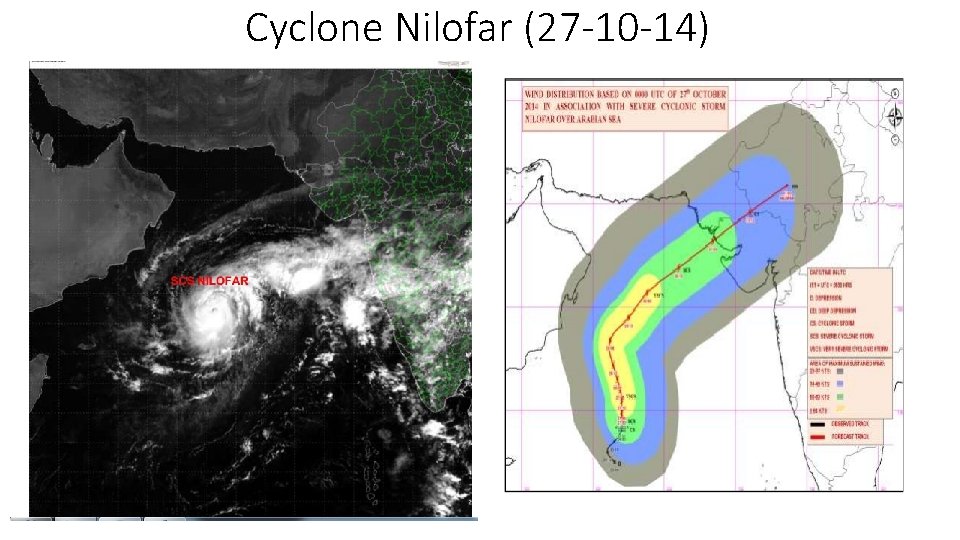
Cyclone Nilofar (27 -10 -14)
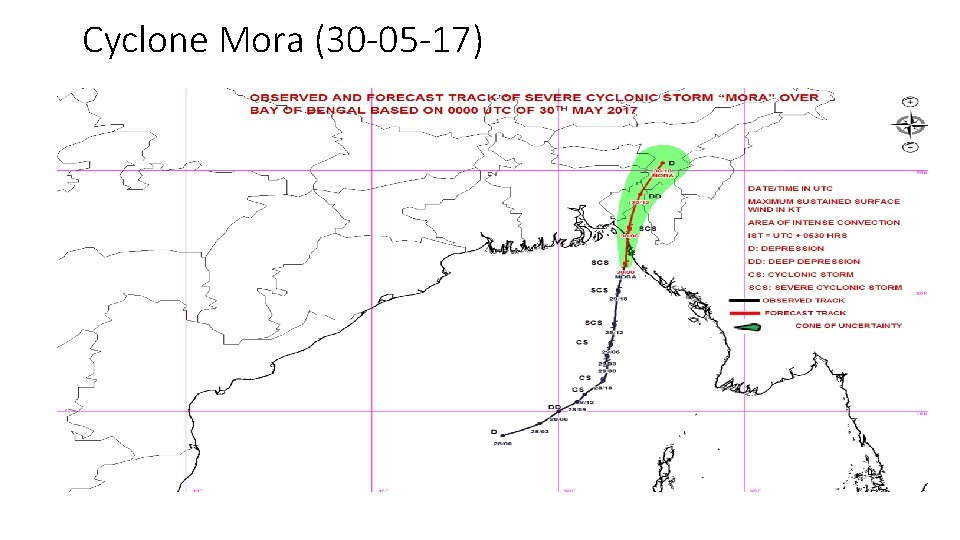
Cyclone Mora (30 -05 -17)
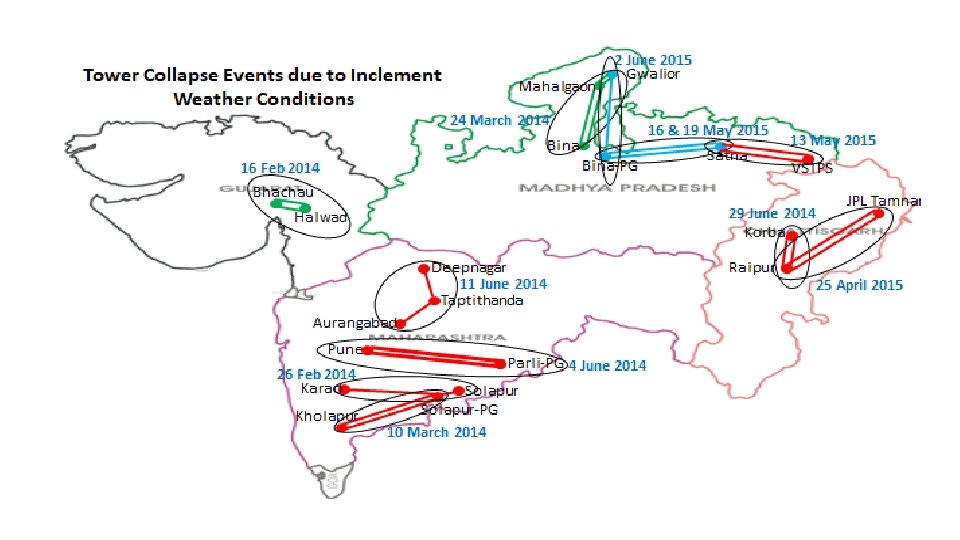
Load crash incidents due to inclement weather
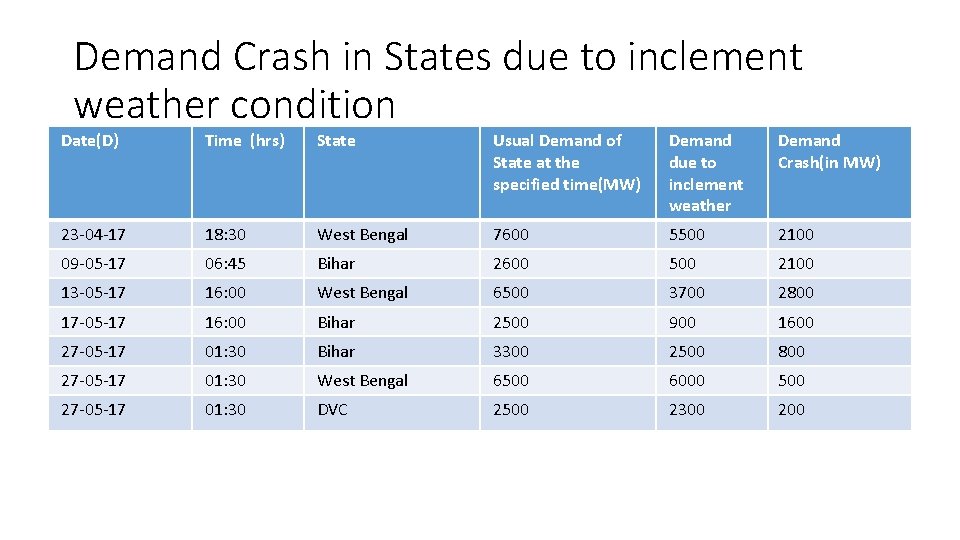
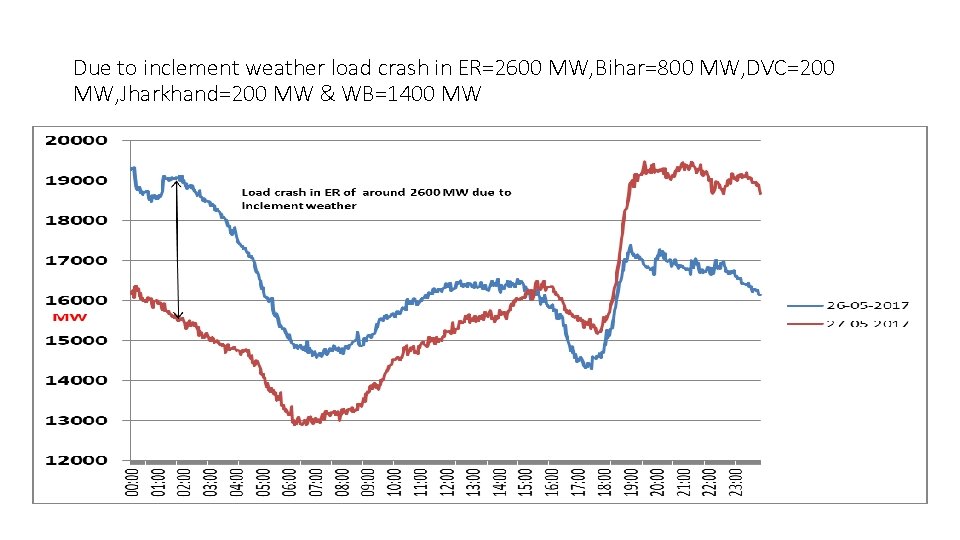
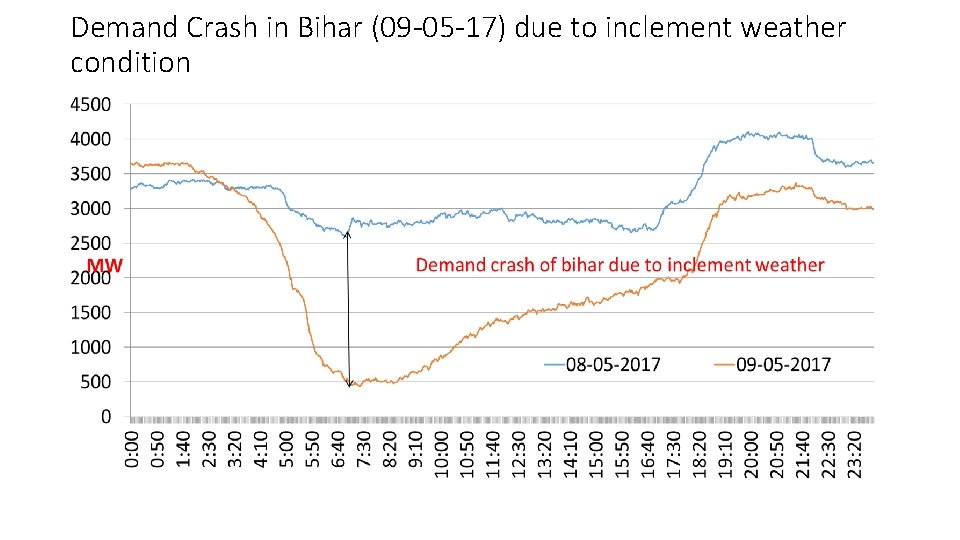
Demand Crash in States due to inclement weather condition Date(D) Time (hrs) State Usual Demand of State at the specified time(MW) Demand due to inclement weather Demand Crash(in MW) 23 -04 -17 18: 30 West Bengal 7600 5500 2100 09 -05 -17 06: 45 Bihar 2600 500 2100 13 -05 -17 16: 00 West Bengal 6500 3700 2800 17 -05 -17 16: 00 Bihar 2500 900 1600 27 -05 -17 01: 30 Bihar 3300 2500 800 27 -05 -17 01: 30 West Bengal 6500 6000 500 27 -05 -17 01: 30 DVC 2500 2300 200
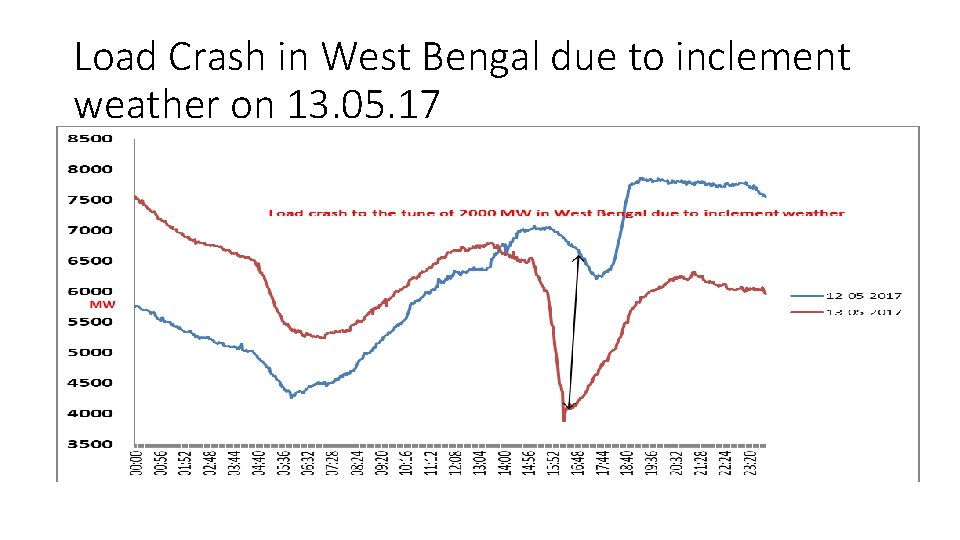
Load Crash in West Bengal due to inclement weather on 13. 05. 17
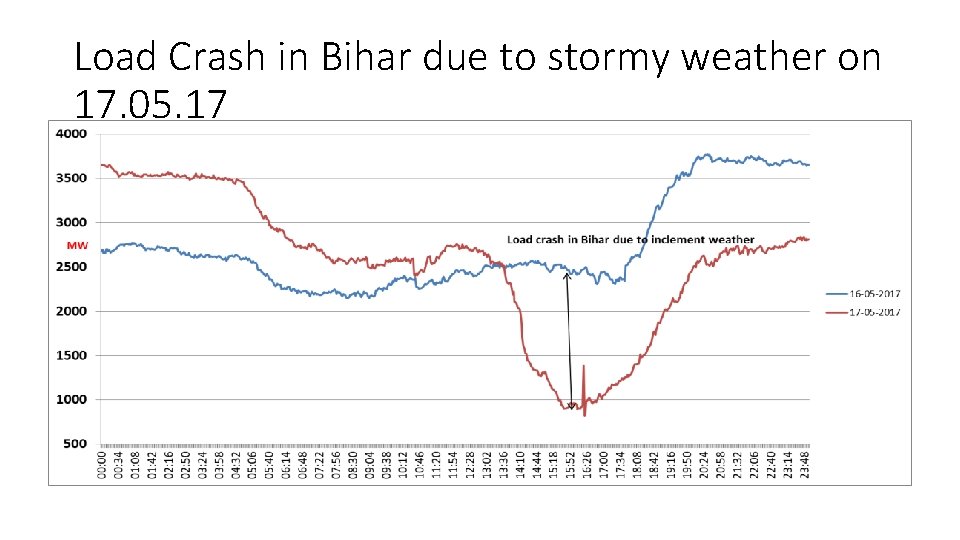
Load Crash in Bihar due to stormy weather on 17. 05. 17
Due to inclement weather load crash in ER=2600 MW, Bihar=800 MW, DVC=200 MW, Jharkhand=200 MW & WB=1400 MW
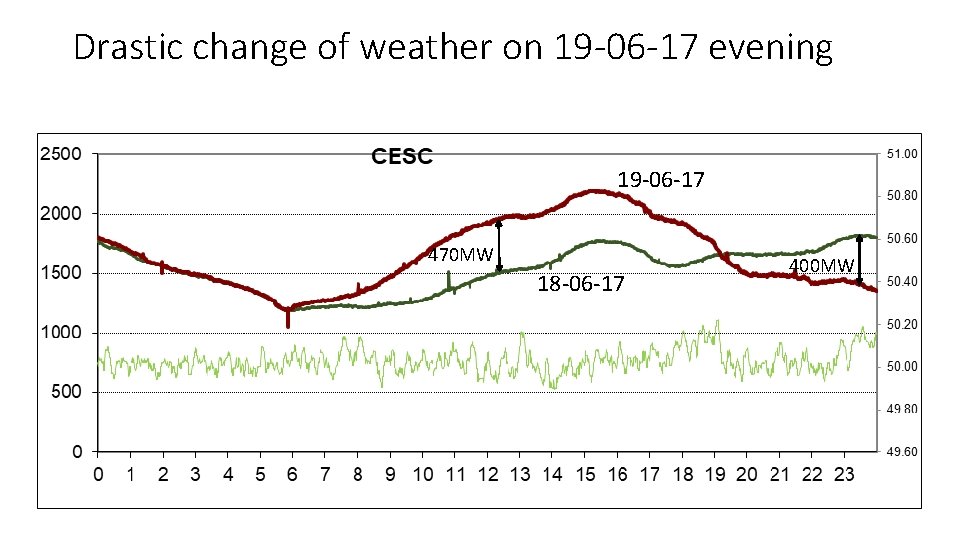
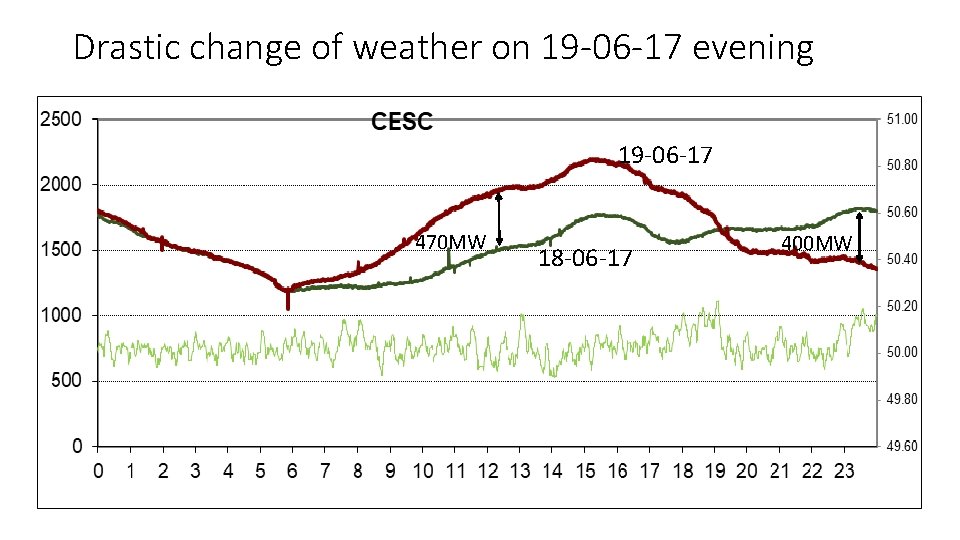
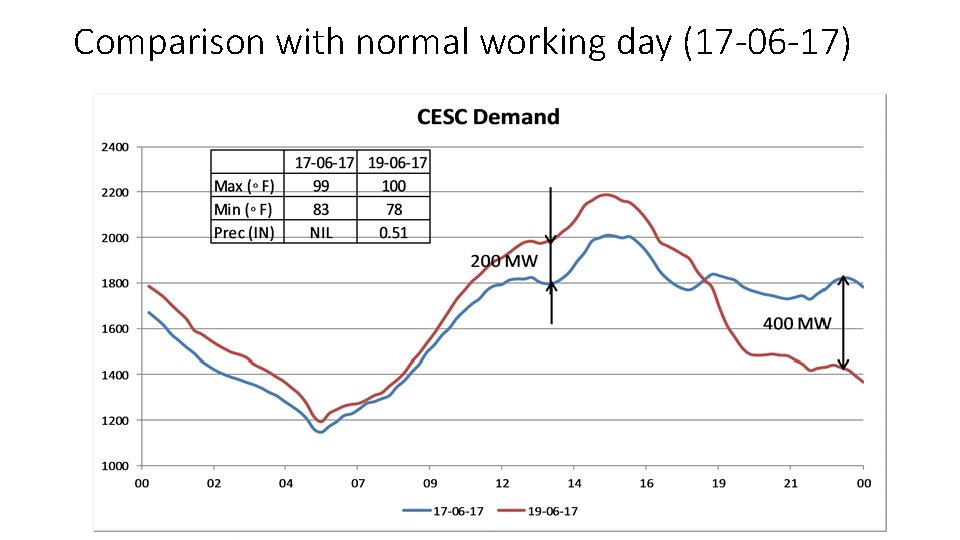
Steep Fall in CESC demand (19 -06 -17) due to inclement weather
Demand Crash in Bihar (09 -05 -17) due to inclement weather condition
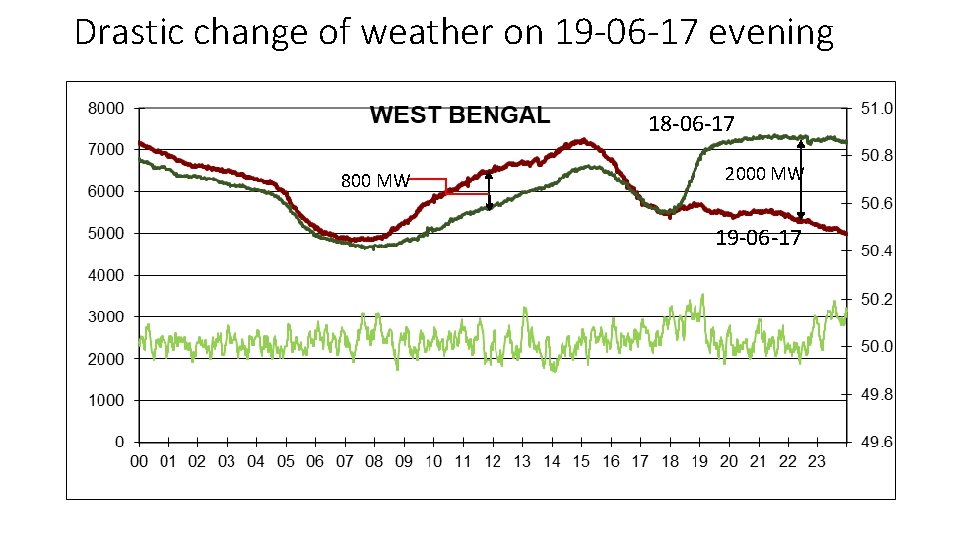
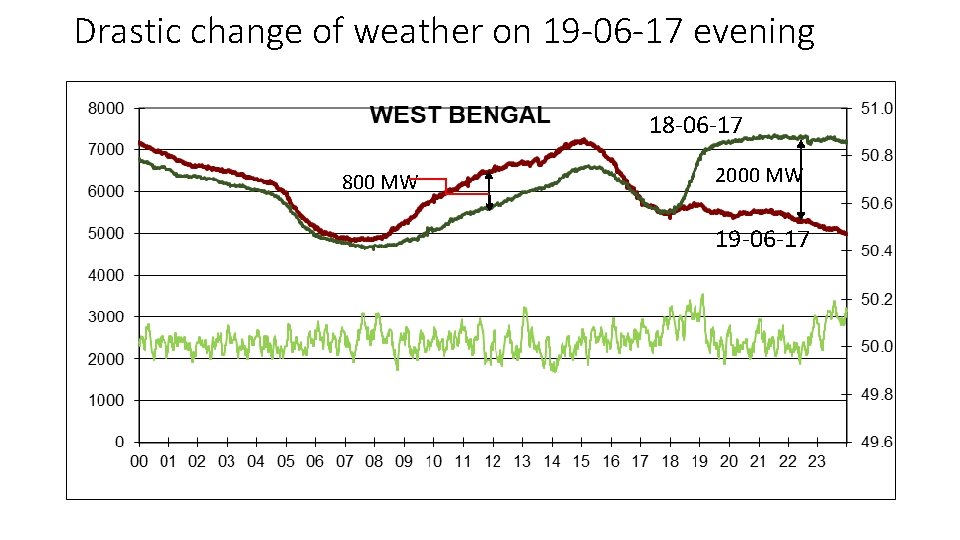
Drastic change of weather on 19 -06 -17 evening 18 -06 -17 800 MW 2000 MW 19 -06 -17
Drastic change of weather on 19 -06 -17 evening 19 -06 -17 470 MW 18 -06 -17 400 MW
Drastic change of weather on 19 -06 -17 evening 18 -06 -17 800 MW 2000 MW 19 -06 -17
Drastic change of weather on 19 -06 -17 evening 19 -06 -17 470 MW 18 -06 -17 400 MW
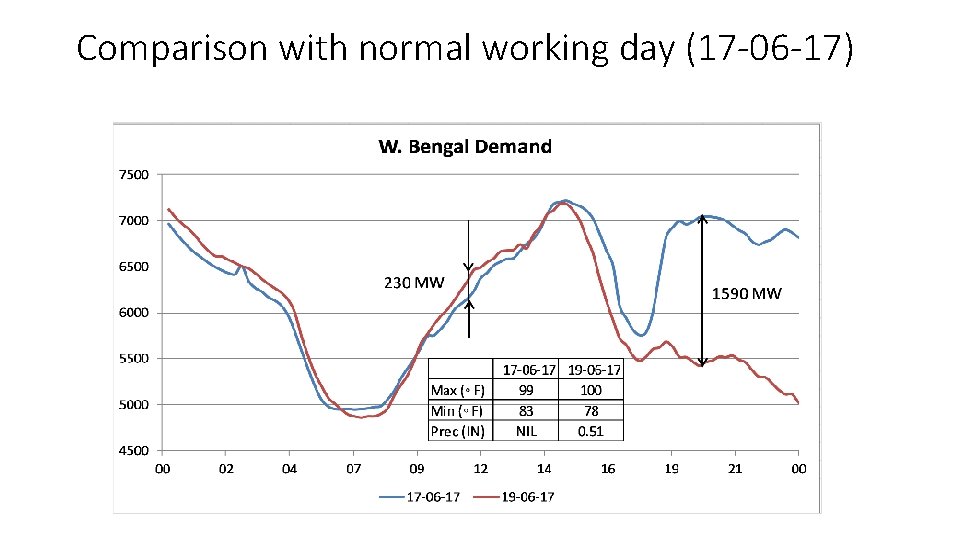
Comparison with normal working day (17 -06 -17)
Comparison with normal working day (17 -06 -17)
Use of weather in load forecasting
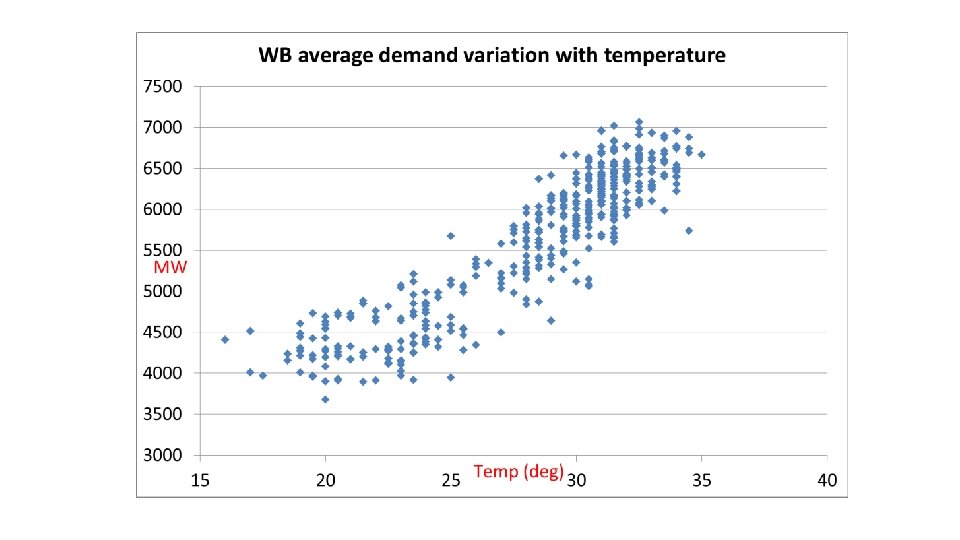
Influence of weather component • Weather variables are the most important factors that influence the load in short-term load forecasts. • Temperature and humidity are the most commonly used load predictors. • Rainfall, wind speed, and wind chill affect the forecasting accuracy during summer and winter • Short-term prediction of meteorological variables is important for many applications. For example, many ‘smart grid’ planning and control scenarios rely on accurate short term prediction of renewable energy generation and demand, which in turn requires accurate forecasts of wind-speed, cloud-cover, and other such variables. Accurate short-term weather forecasting therefore ensures secure and economic grid operation besides enabling smooth integration of renewables into future intelligent power systems
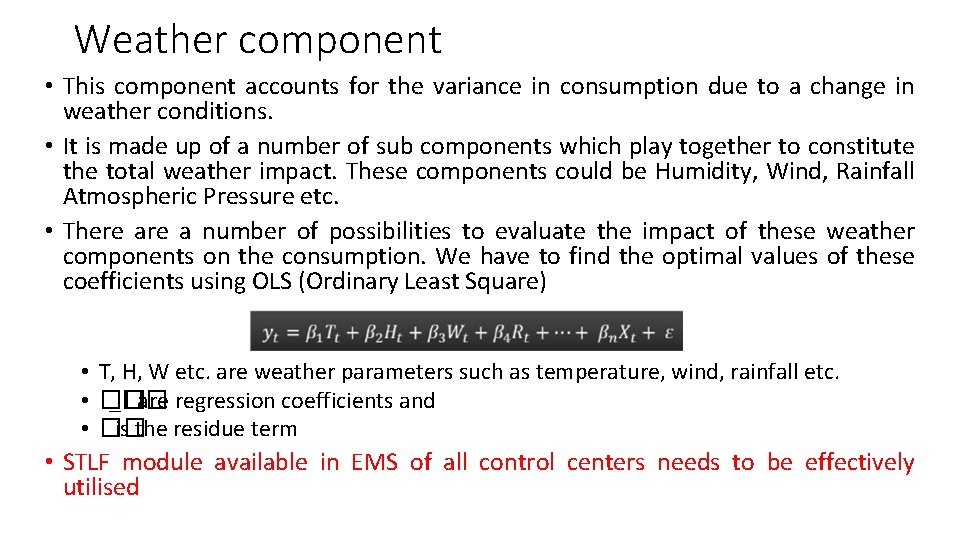
Weather component • This component accounts for the variance in consumption due to a change in weather conditions. • It is made up of a number of sub components which play together to constitute the total weather impact. These components could be Humidity, Wind, Rainfall Atmospheric Pressure etc. • There a number of possibilities to evaluate the impact of these weather components on the consumption. We have to find the optimal values of these coefficients using OLS (Ordinary Least Square) • T, H, W etc. are weather parameters such as temperature, wind, rainfall etc. • �� _�� are regression coefficients and • �� is the residue term • STLF module available in EMS of all control centers needs to be effectively utilised
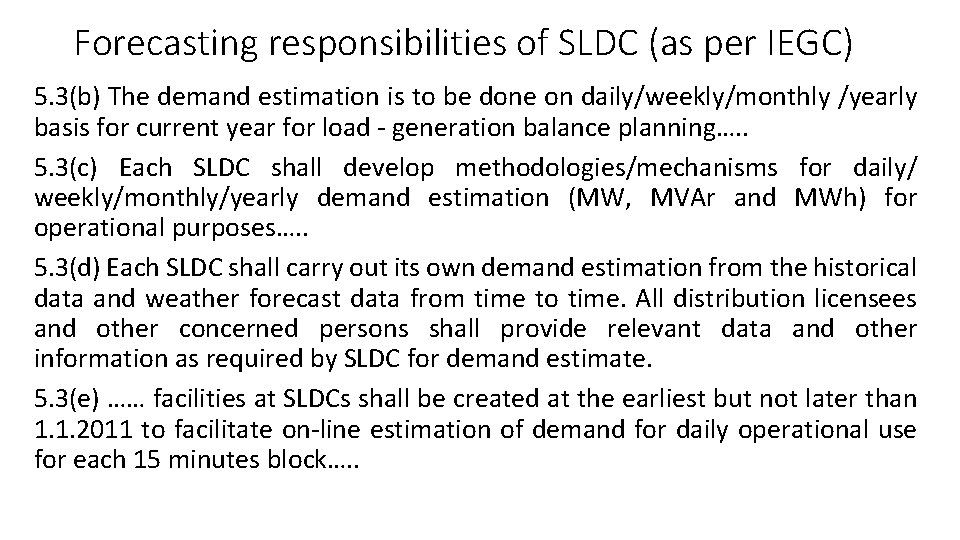
Forecasting responsibilities of SLDC (as per IEGC) 5. 3(b) The demand estimation is to be done on daily/weekly/monthly /yearly basis for current year for load - generation balance planning…. . 5. 3(c) Each SLDC shall develop methodologies/mechanisms for daily/ weekly/monthly/yearly demand estimation (MW, MVAr and MWh) for operational purposes…. . 5. 3(d) Each SLDC shall carry out its own demand estimation from the historical data and weather forecast data from time to time. All distribution licensees and other concerned persons shall provide relevant data and other information as required by SLDC for demand estimate. 5. 3(e) …… facilities at SLDCs shall be created at the earliest but not later than 1. 1. 2011 to facilitate on-line estimation of demand for daily operational use for each 15 minutes block…. .
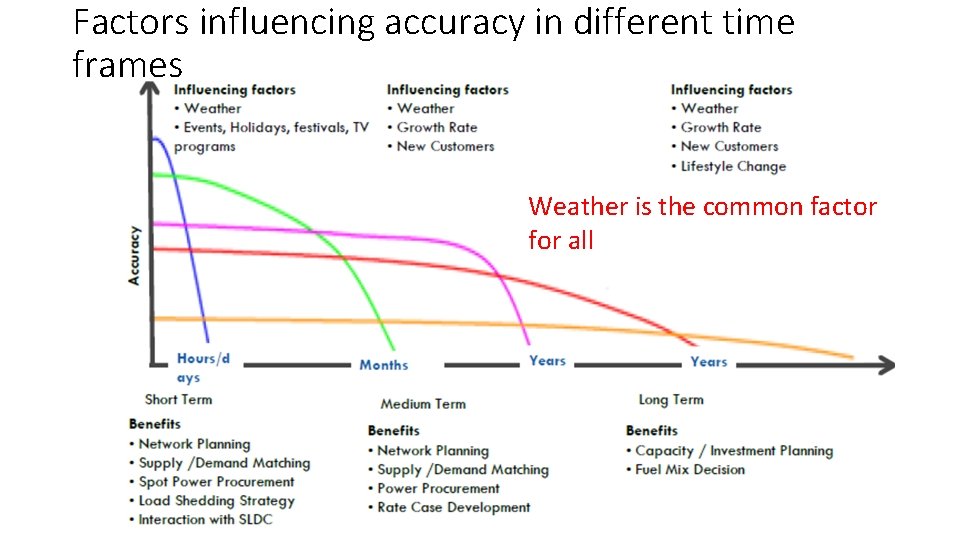
Factors influencing accuracy in different time frames Weather is the common factor for all
Benefits Achieved from weather portal
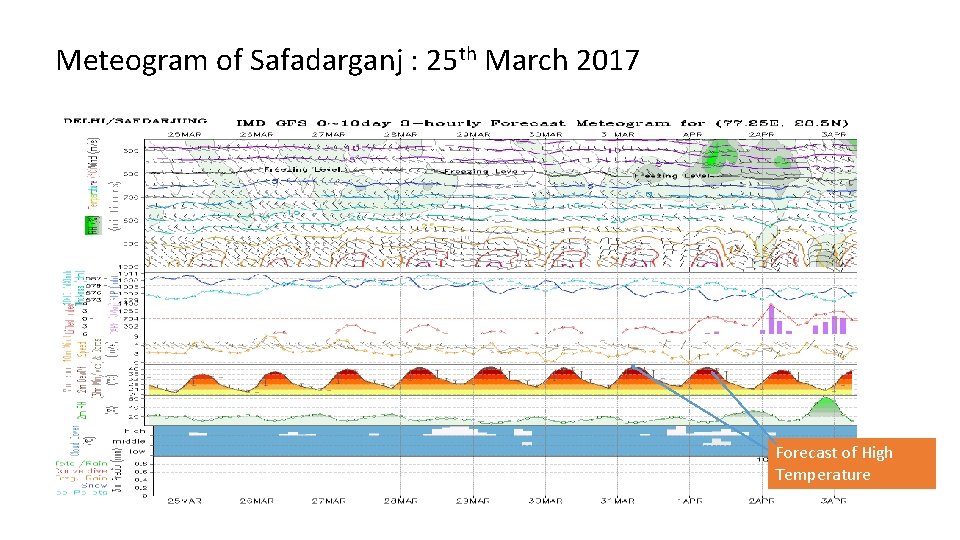
Case-I • The last week of March 2017 was predicted to be very hot and dry, which prompted units of Dadri TPS to be brought on bar to meet rising demand, in time. • BRPL sent a note to Delhi SLDC along with the Meteogram predicting severe temperatures during last week of March 2017
Meteogram of Safadarganj : 25 th March 2017 Forecast of High Temperature
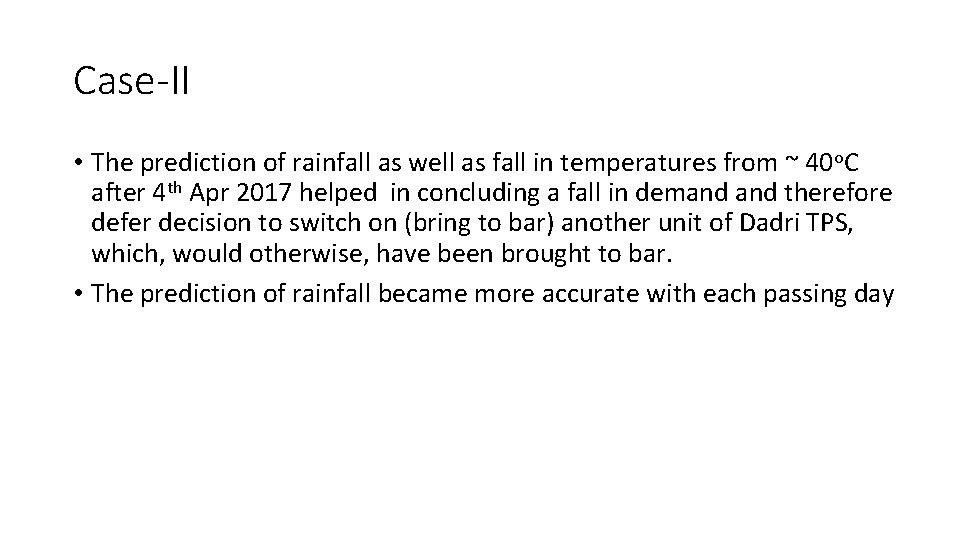
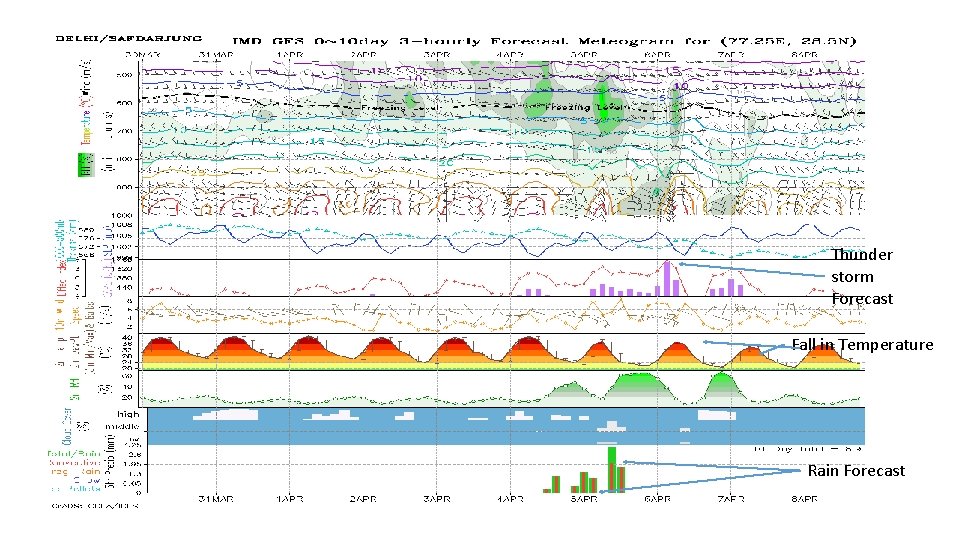
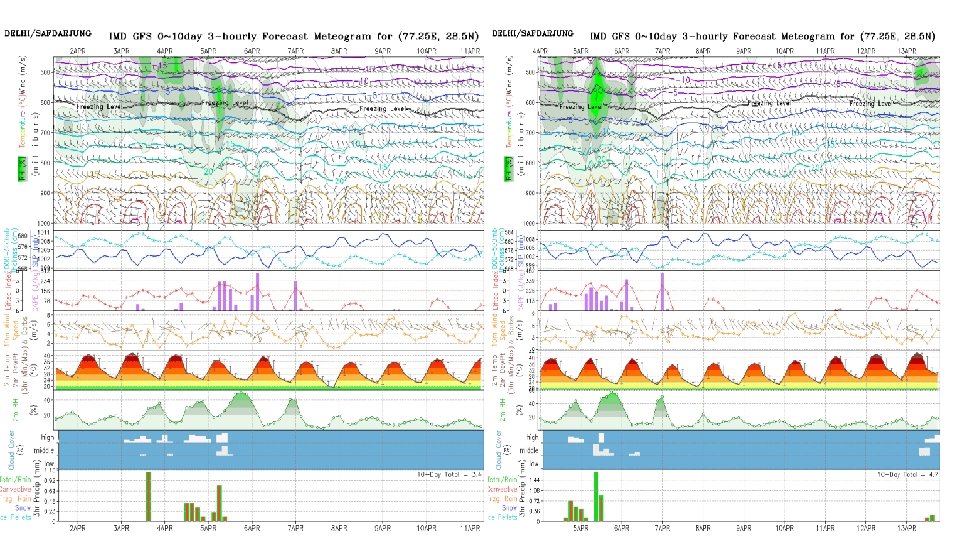
Case-II • The prediction of rainfall as well as fall in temperatures from ~ 40 o. C after 4 th Apr 2017 helped in concluding a fall in demand therefore defer decision to switch on (bring to bar) another unit of Dadri TPS, which, would otherwise, have been brought to bar. • The prediction of rainfall became more accurate with each passing day
Thunder storm Forecast Fall in Temperature Rain Forecast
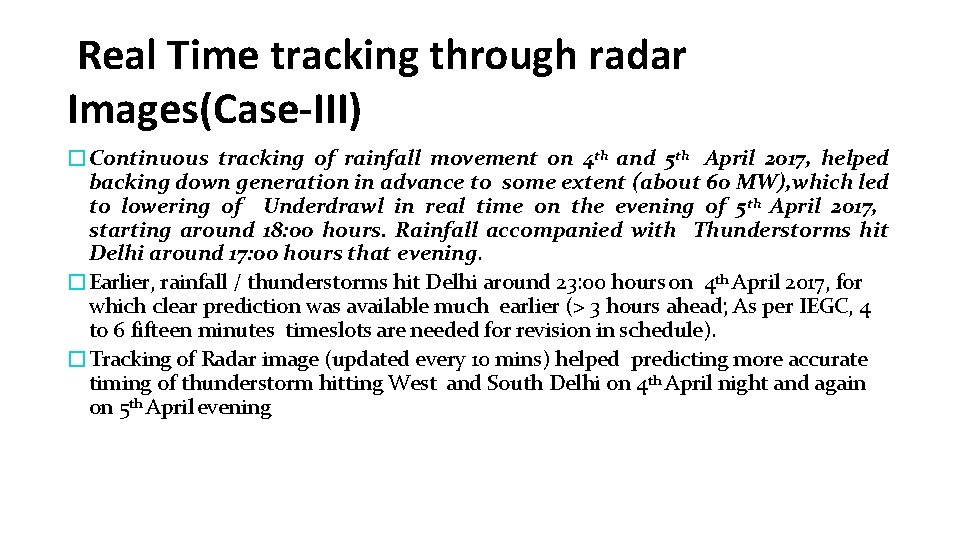
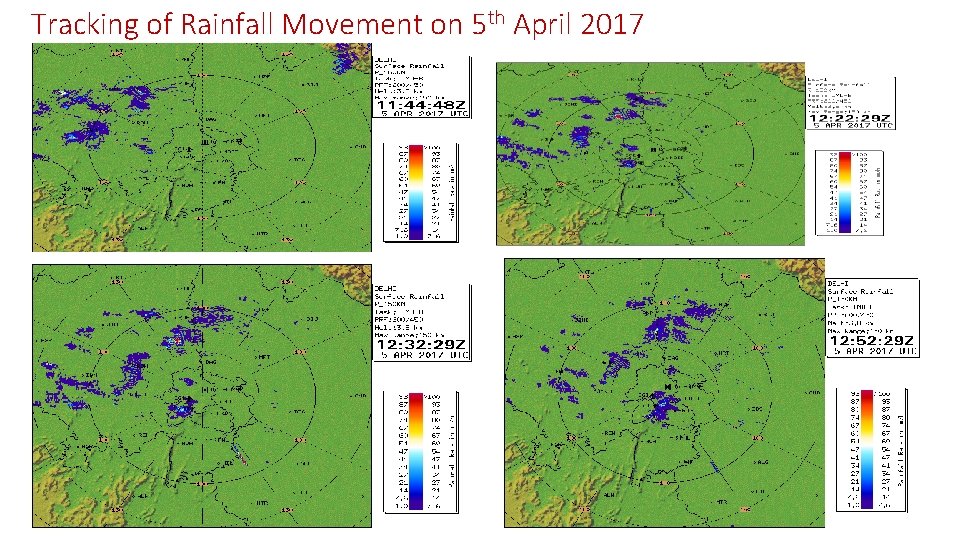
Real Time tracking through radar Images(Case-III) �Continuous tracking of rainfall movement on 4 th and 5 th April 2017, helped backing down generation in advance to some extent (about 60 MW), which led to lowering of Underdrawl in real time on the evening of 5 th April 2017, starting around 18: 00 hours. Rainfall accompanied with Thunderstorms hit Delhi around 17: 00 hours that evening. �Earlier, rainfall / thunderstorms hit Delhi around 23: 00 hours on 4 th April 2017, for which clear prediction was available much earlier (> 3 hours ahead; As per IEGC, 4 to 6 fifteen minutes timeslots are needed for revision in schedule). �Tracking of Radar image (updated every 10 mins) helped predicting more accurate timing of thunderstorm hitting West and South Delhi on 4 th April night and again on 5 th April evening
Tracking of Rainfall Movement on 5 th April 2017
Case-IV • Meteogram, wind and rain forecast for 27/28/29 -05 -2017 helped in better load assessment of UP control area by U. P. State Load Despatch Centre. • As anticipated, UP demand went down from 19000 MW to 17000 MW due to change in weather conditions. • Accordingly, STOA & purchase from Power Exchange of the order of 2000 MW was reduced. i. e Backing down of approximately 13 MU of costly thermal generation.
Weather impact on renewables
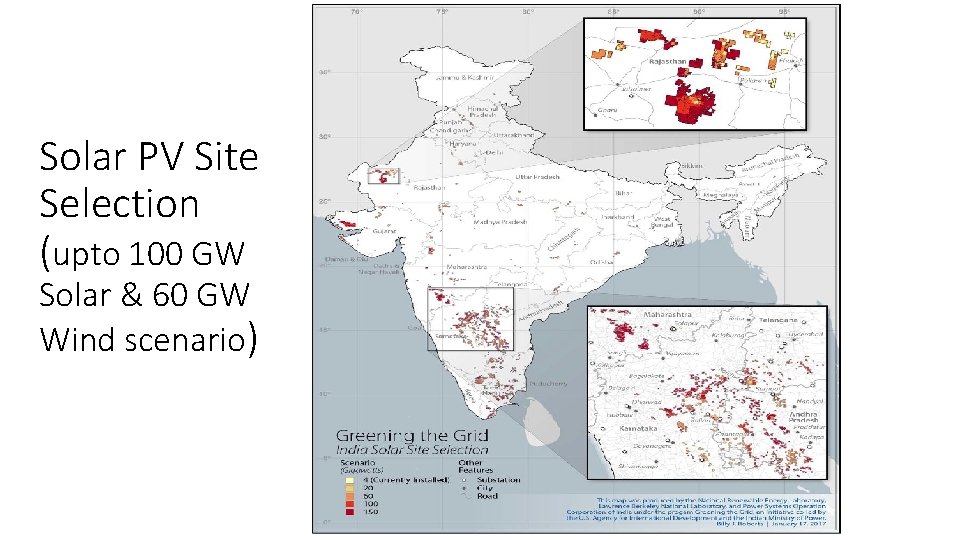
Solar PV Site Selection (upto 100 GW Solar & 60 GW Wind scenario)
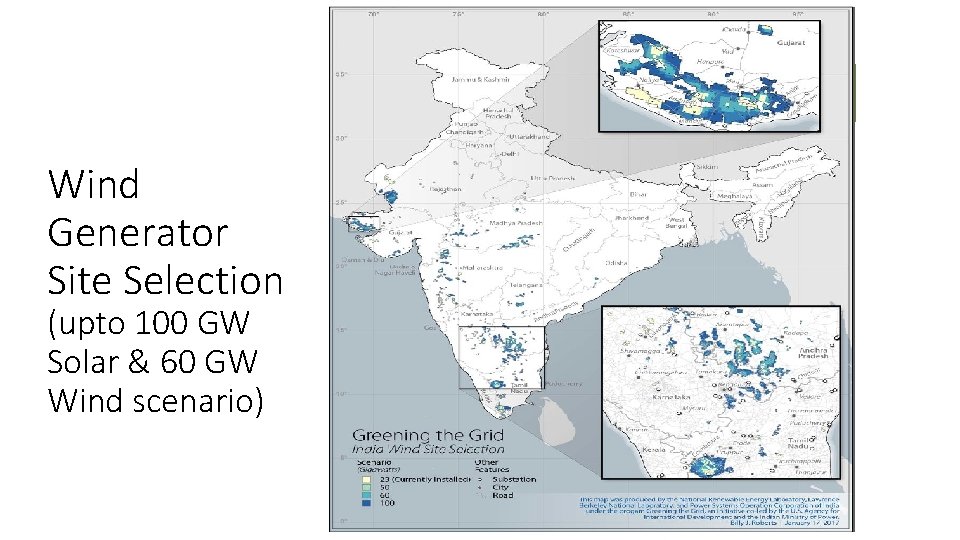
Wind Generator Site Selection (upto 100 GW Solar & 60 GW Wind scenario)
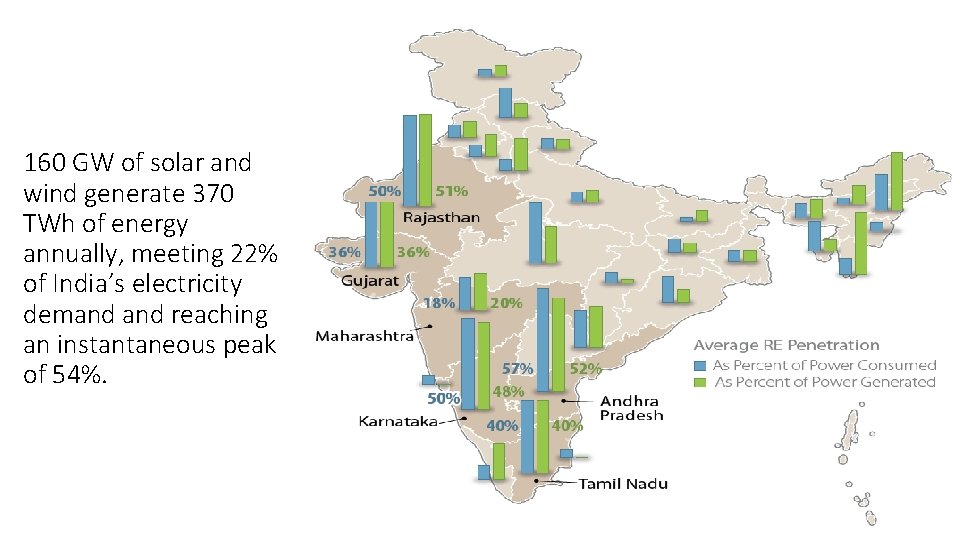
160 GW of solar and wind generate 370 TWh of energy annually, meeting 22% of India’s electricity demand reaching an instantaneous peak of 54%.
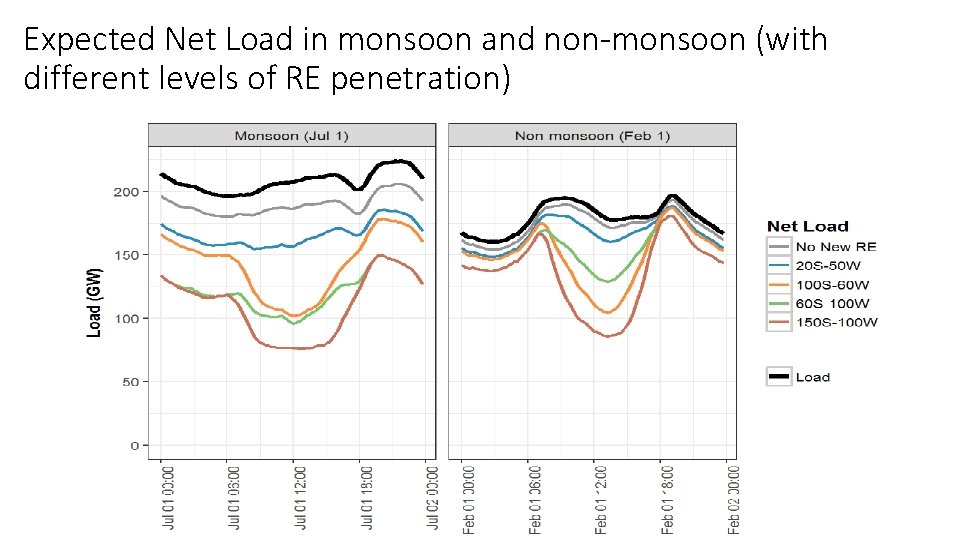
Expected Net Load in monsoon and non-monsoon (with different levels of RE penetration)
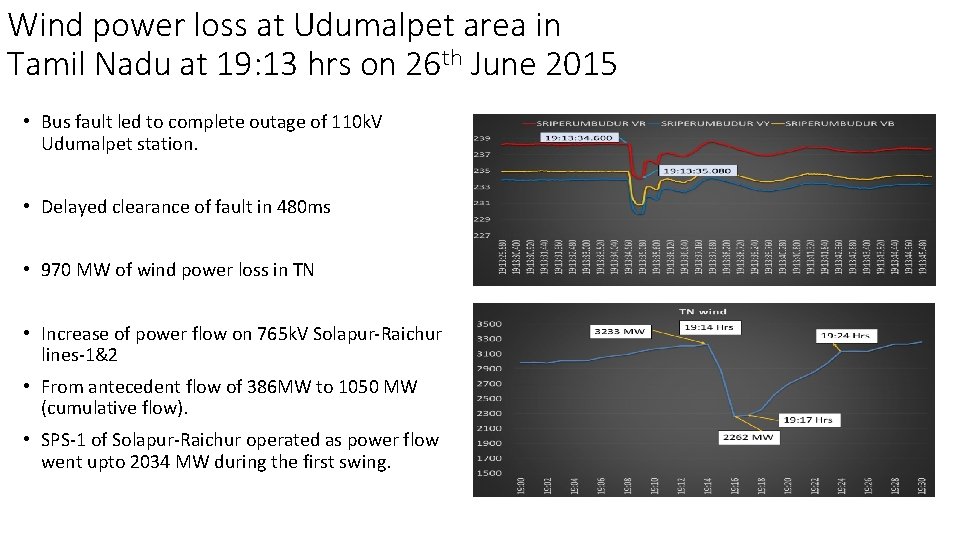
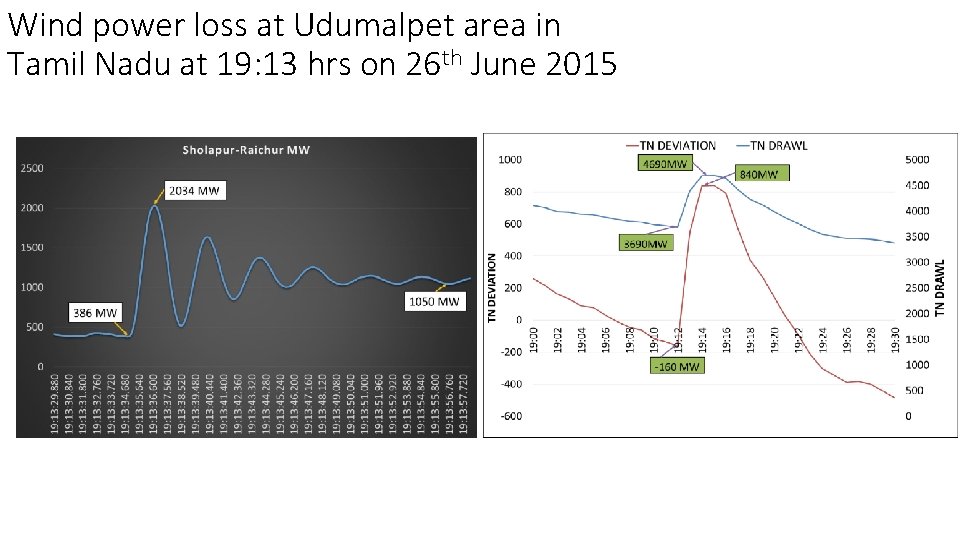
Wind power loss at Udumalpet area in Tamil Nadu at 19: 13 hrs on 26 th June 2015 • Bus fault led to complete outage of 110 k. V Udumalpet station. • Delayed clearance of fault in 480 ms • 970 MW of wind power loss in TN • Increase of power flow on 765 k. V Solapur-Raichur lines-1&2 • From antecedent flow of 386 MW to 1050 MW (cumulative flow). • SPS-1 of Solapur-Raichur operated as power flow went upto 2034 MW during the first swing.
Wind power loss at Udumalpet area in Tamil Nadu at 19: 13 hrs on 26 th June 2015
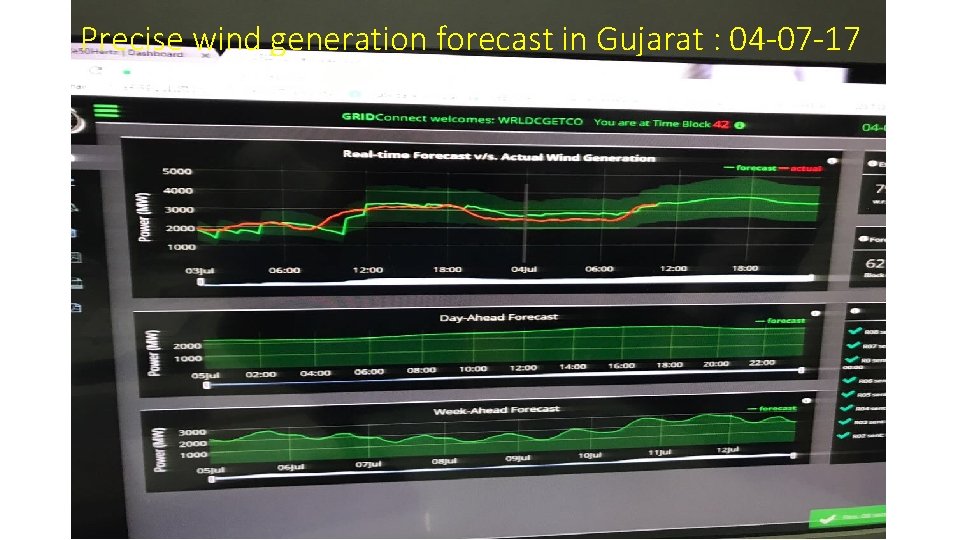
Precise wind generation forecast in Gujarat : 04 -07 -17
Preventive action to mitigate impact of weather
Minimizing Impact on Power System • Prior knowledge of Weather Conditions • • Demand estimation Generation requirement Maintenance scheduling of generating units and transmission lines Issuance of Advisory in case of warning • Power Generation Increase/Decrease • Assessment of Impact on Power Transmission lines • Simulation Studies • Advance Plan of restoration
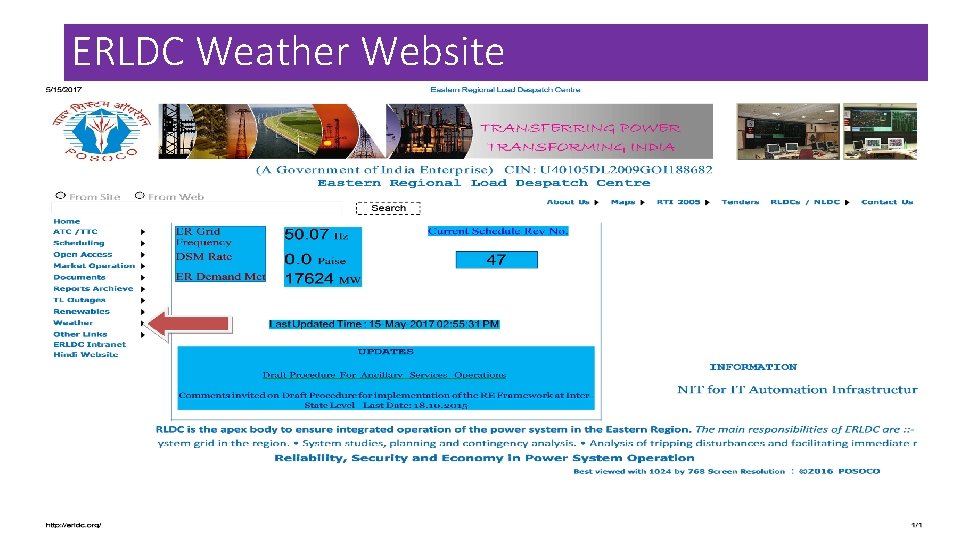
ERLDC Weather Website
IMD-POSOCO WEBSITE • The website can also be accessed via the following link: http: //amssdelhi. gov. in/ERLDC/MAIN. html
Memorandam Of Understanding • MOU signed on 18 th May, 2015 between India Meteorological Department (IMD) and Power System Operation Corporation(POSOCO) • Objective of MOU: Weather information provided by IMD shall be used by the Power System Operators across India for better management of Indian Power System.
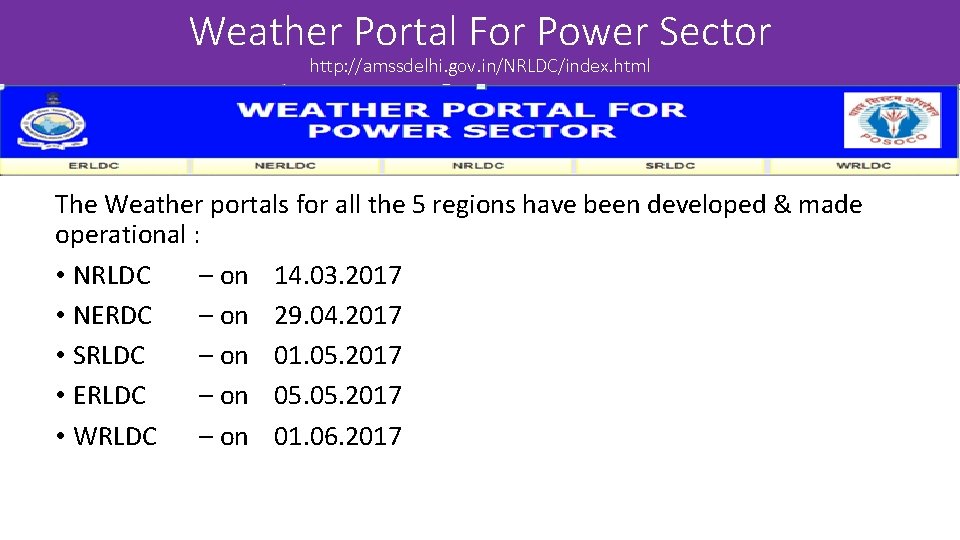
Weather Portal For Power Sector http: //amssdelhi. gov. in/NRLDC/index. html The Weather portals for all the 5 regions have been developed & made operational : • NRLDC – on 14. 03. 2017 • NERDC – on 29. 04. 2017 • SRLDC – on 01. 05. 2017 • ERLDC – on 05. 2017 • WRLDC – on 01. 06. 2017
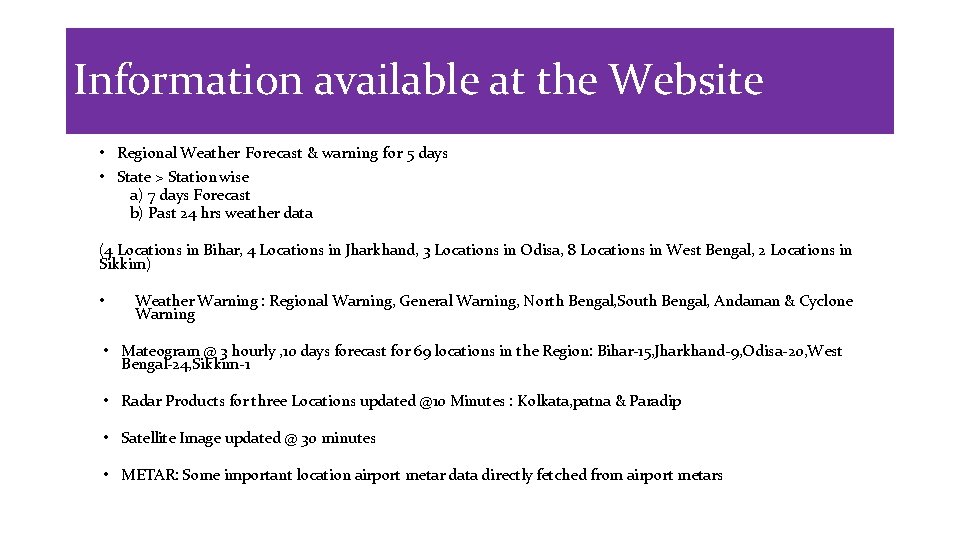
Information available at the Website • Regional Weather Forecast & warning for 5 days • State > Station wise a) 7 days Forecast b) Past 24 hrs weather data (4 Locations in Bihar, 4 Locations in Jharkhand, 3 Locations in Odisa, 8 Locations in West Bengal, 2 Locations in Sikkim) • Weather Warning : Regional Warning, General Warning, North Bengal, South Bengal, Andaman & Cyclone Warning • Mateogram @ 3 hourly , 10 days forecast for 69 locations in the Region: Bihar-15, Jharkhand-9, Odisa-20, West Bengal-24, Sikkim-1 • Radar Products for three Locations updated @10 Minutes : Kolkata, patna & Paradip • Satellite Image updated @ 30 minutes • METAR: Some important location airport metar data directly fetched from airport metars
Thank you !