Flisha Fernandez DATA MINING 1 WHAT IS DATA
- Slides: 77
Flisha Fernandez DATA MINING 1
WHAT IS DATA MINING? Data Mining is the discovery of hidden knowledge, unexpected patterns and new rules in large databases Automating the process of searching patterns in the data Emily Thomas, State University of New York 2
OBJECTIVE OF DATA MINING Any of four types of relationships are sought: Classes – stored data is used to locate data in predetermined groups Clusters – data items grouped according to logical relationships or consumer preferences Associations – Walmart example (beer and diapers) Sequential Patterns – data mined to anticipate behavior patterns and trends anderson. ucla. edu 3
DATA MINING TECHNIQUES Rule Induction – extraction of if-then rules Nearest Neighbors Artificial Neural Networks – models that learn Clustering Genetic Algorithms – concept of natural evolution Factor Analysis Exploratory Stepwise Regression Data Visualization – usage of graphic tools Decision Trees Emily Thomas, State University of New York 4
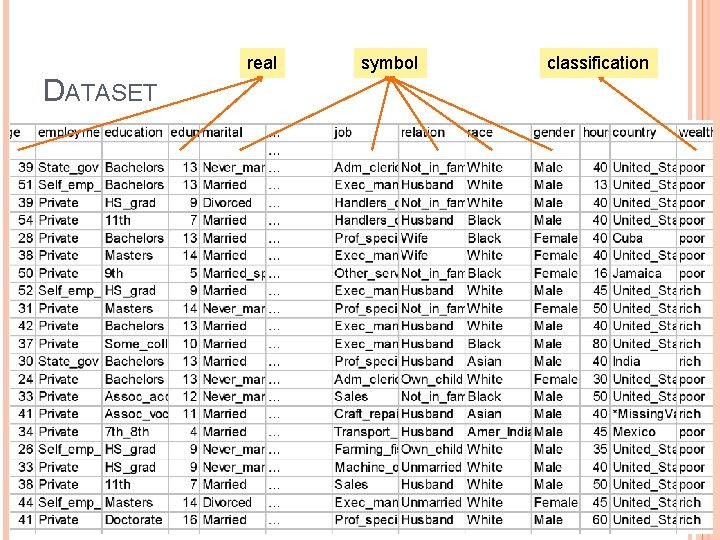
CLASSIFICATION A major data mining operation Given one attribute (e. g. Wealth), try to to predict the value of new people’s wealths by means of some of the other available attributes Applies to categorical outputs Flisha Fernandez Categorical attribute: an attribute which takes on two or more discrete values, also knows as a symbolic attribute Real attribute: a column of real numbers, also known as a continuous attribute 5
real symbol classification DATASET Kohavi 1995 6
Flisha Fernandez DECISION TREES 7
DECISION TREES Also called classification trees or regression trees Based on recursive partitioning of the sample space Tree-shaped structures that represent sets of decisions/data which generate rules for the classification of a (new, unclassified) dataset The resulting classification tree becomes an input for decision making anderson. ucla. edu / Wikipedia 8
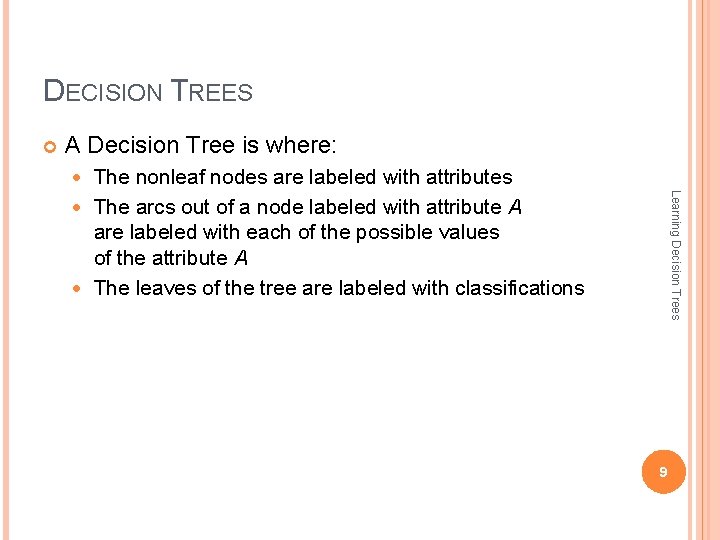
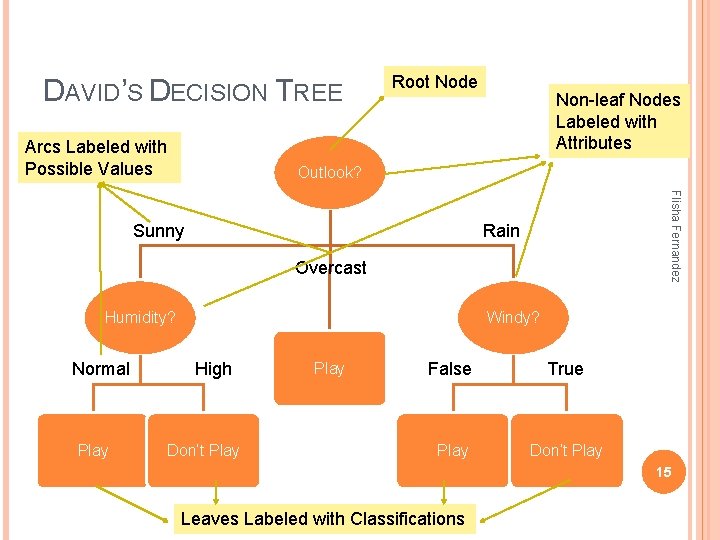
DECISION TREES A Decision Tree is where: The nonleaf nodes are labeled with attributes The arcs out of a node labeled with attribute A are labeled with each of the possible values of the attribute A The leaves of the tree are labeled with classifications Learning Decision Trees 9
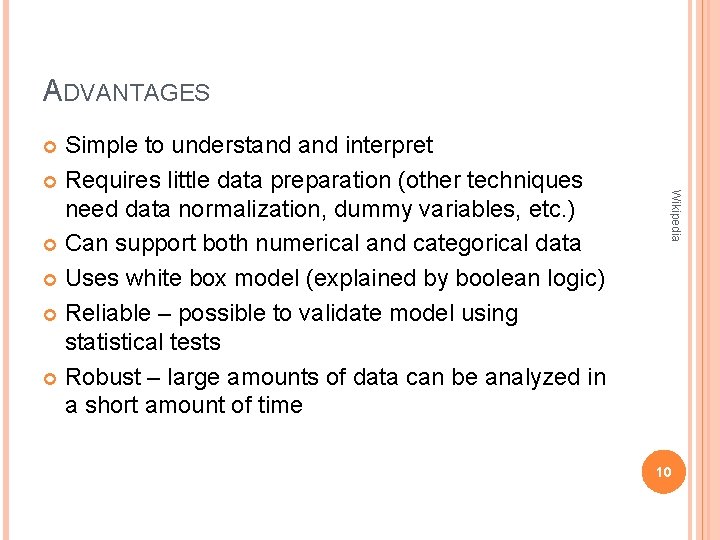
ADVANTAGES Simple to understand interpret Requires little data preparation (other techniques need data normalization, dummy variables, etc. ) Can support both numerical and categorical data Uses white box model (explained by boolean logic) Reliable – possible to validate model using statistical tests Robust – large amounts of data can be analyzed in a short amount of time Wikipedia 10
Flisha Fernandez DECISION TREE EXAMPLE 11
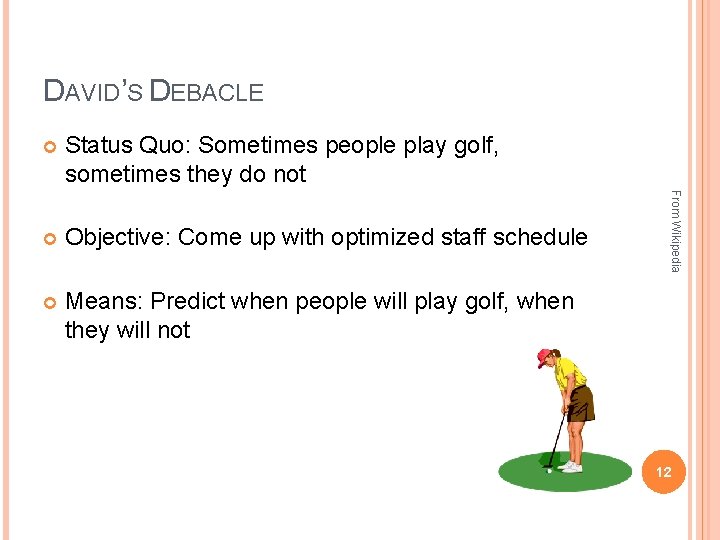
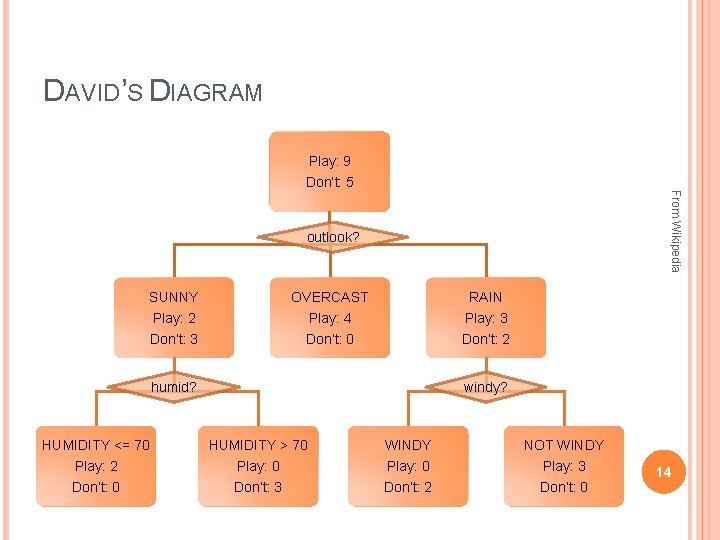
DAVID’S DEBACLE Status Quo: Sometimes people play golf, sometimes they do not Objective: Come up with optimized staff schedule Means: Predict when people will play golf, when they will not From Wikipedia 12
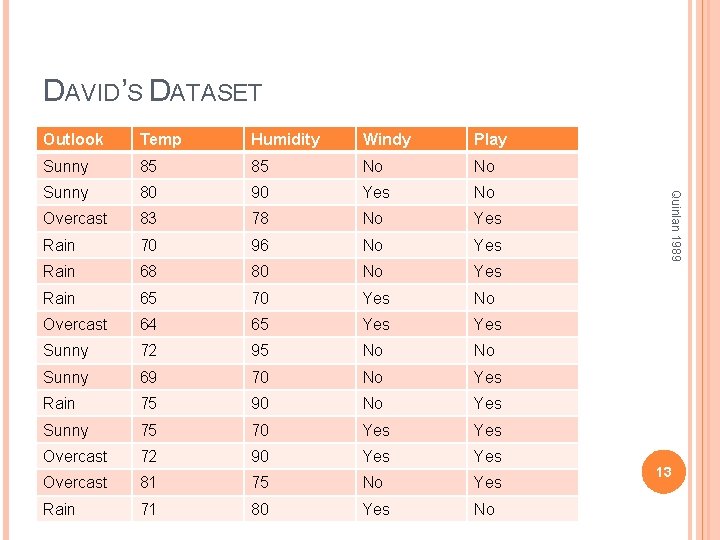
DAVID’S DATASET Temp Humidity Windy Play Sunny 85 85 No No Sunny 80 90 Yes No Overcast 83 78 No Yes Rain 70 96 No Yes Rain 68 80 No Yes Rain 65 70 Yes No Overcast 64 65 Yes Sunny 72 95 No No Sunny 69 70 No Yes Rain 75 90 No Yes Sunny 75 70 Yes Overcast 72 90 Yes Overcast 81 75 No Yes Rain 71 80 Yes No Quinlan 1989 Outlook 13
DAVID’S DIAGRAM Play: 9 From Wikipedia Don’t: 5 outlook? SUNNY OVERCAST RAIN Play: 2 Don’t: 3 Play: 4 Don’t: 0 Play: 3 Don’t: 2 humid? windy? HUMIDITY <= 70 HUMIDITY > 70 WINDY NOT WINDY Play: 2 Don’t: 0 Play: 0 Don’t: 3 Play: 0 Don’t: 2 Play: 3 Don’t: 0 14
DAVID’S DECISION TREE Arcs Labeled with Possible Values Root Node Non-leaf Nodes Labeled with Attributes Outlook? Flisha Fernandez Sunny Rain Overcast Humidity? Normal Play Windy? High Don’t Play False True Play Don’t Play 15 Leaves Labeled with Classifications
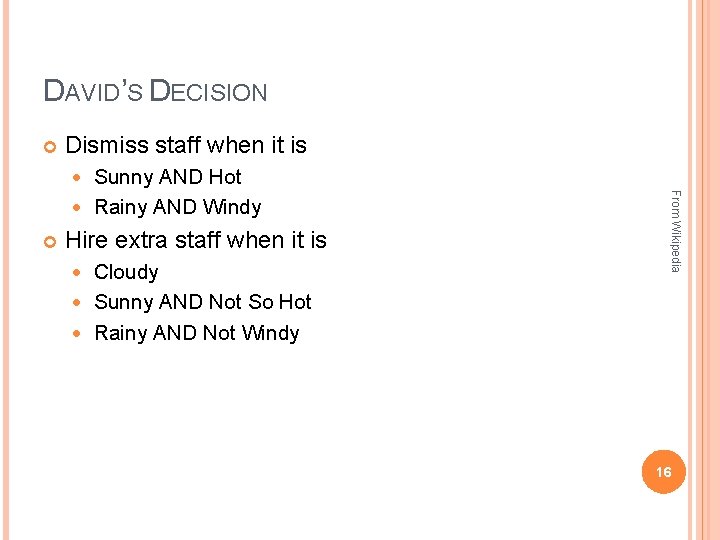
DAVID’S DECISION Dismiss staff when it is Sunny AND Hot Rainy AND Windy Hire extra staff when it is Cloudy Sunny AND Not So Hot Rainy AND Not Windy From Wikipedia 16
Flisha Fernandez DECISION TREE INDUCTION 17
DECISION TREE INDUCTION ALGORITHM Basic Algorithm (Greedy Algorithm) Simon Fraser University, Canada Tree is constructed in a top-down recursive divide-andconquer manner At start, all the training examples are at the root Attributes are categorical (if continuous-valued, they are discretized in advance) Examples are partitioned recursively based on selected attributes Test attributes are selected on the basis of a certain measure (e. g. , information gain) 18
ISSUES How should the attributes be split? What is the appropriate root? What is the best split? Decision Tree Learning When should we stop splitting? Should we prune? 19
TWO PHASES Tree Growing (Splitting) Splitting data into progressively smaller subsets Analyzing the data to find the independent variable (such as outlook, humidity, windy) that when used as a splitting rule will result in nodes that are most different from each other with respect to the dependent variable (play) Tree Pruning DBMS Data Mining Solutions Supplement 20
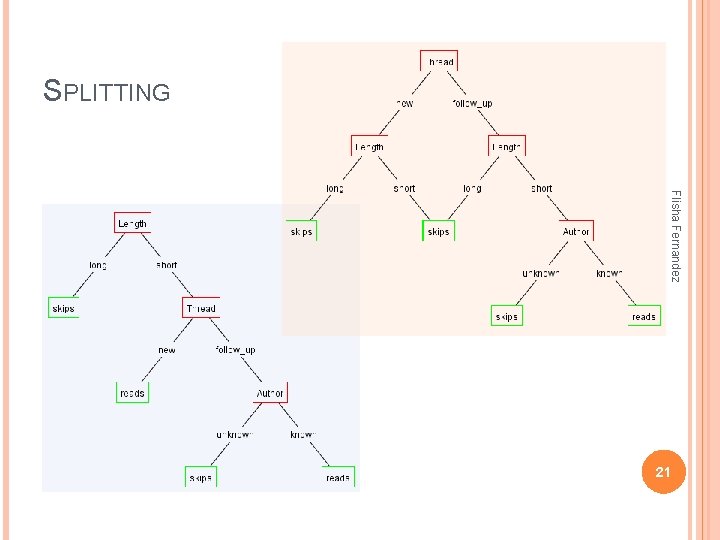
SPLITTING Flisha Fernandez 21
SPLITTING ALGORITHMS Random Information Gain Ratio GINI Index DBMS Data Mining Solutions Supplement 22
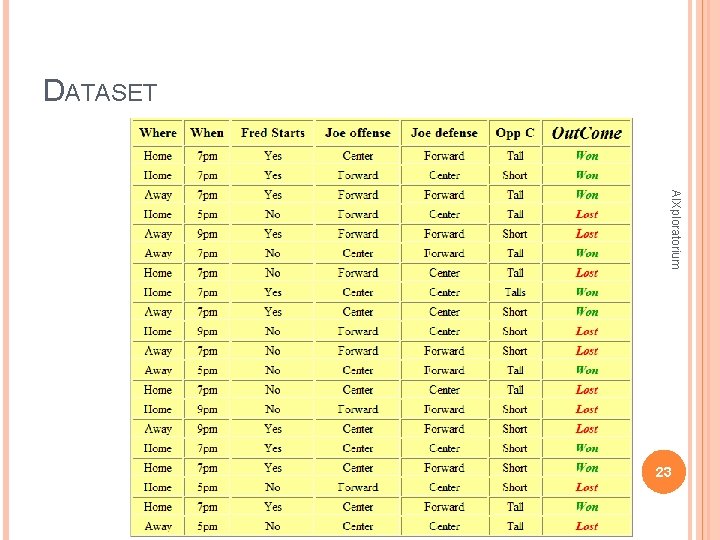
DATASET AIXploratorium 23
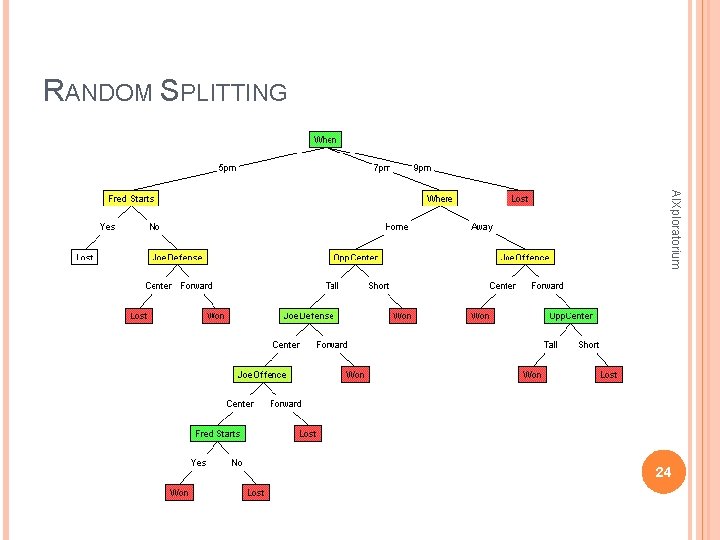
RANDOM SPLITTING AIXploratorium 24
RANDOM SPLITTING Disadvantages Trees can grow huge Hard to understand Less accurate than smaller trees AIXploratorium 25
SPLITTING ALGORITHMS Random Information Gain Ratio GINI Index DBMS Data Mining Solutions Supplement 26
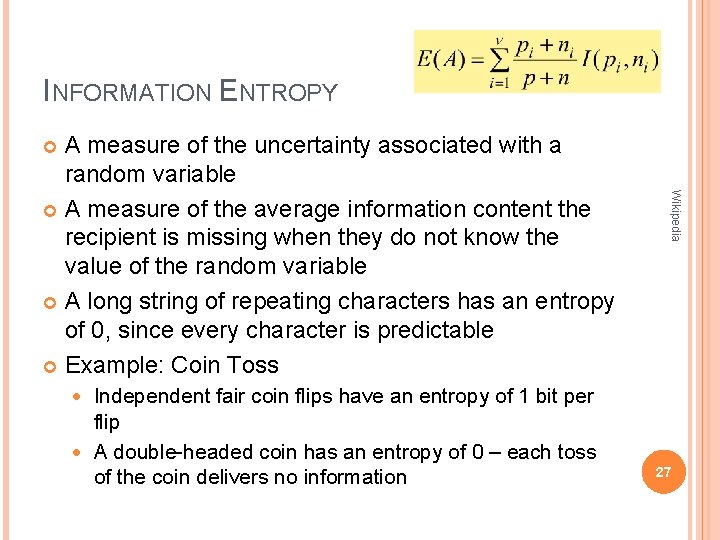
INFORMATION ENTROPY A measure of the uncertainty associated with a random variable A measure of the average information content the recipient is missing when they do not know the value of the random variable A long string of repeating characters has an entropy of 0, since every character is predictable Example: Coin Toss Wikipedia Independent fair coin flips have an entropy of 1 bit per flip A double-headed coin has an entropy of 0 – each toss of the coin delivers no information 27
INFORMATION GAIN A good measure for deciding the relevance of an attribute The value of Information Gain is the reduction in the entropy of X achieved by learning the state of the random variable A Can be used to define a preferred sequence (decision tree) of attributes to investigate to most rapidly narrow down the state of X Used by ID 3 and C 4. 5 Wikipedia 28
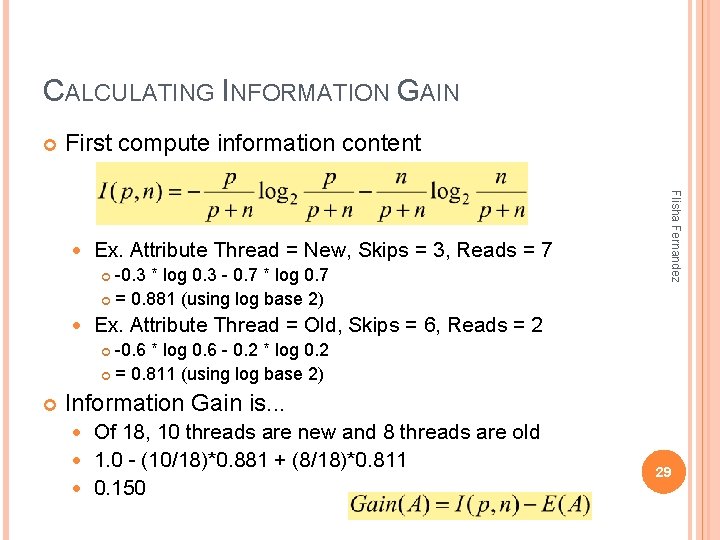
CALCULATING INFORMATION GAIN First compute information content Ex. Attribute Thread = New, Skips = 3, Reads = 7 -0. 3 * log 0. 3 - 0. 7 * log 0. 7 = 0. 881 (using log base 2) Flisha Fernandez Ex. Attribute Thread = Old, Skips = 6, Reads = 2 -0. 6 * log 0. 6 - 0. 2 * log 0. 2 = 0. 811 (using log base 2) Information Gain is. . . Of 18, 10 threads are new and 8 threads are old 1. 0 - (10/18)*0. 881 + (8/18)*0. 811 0. 150 29
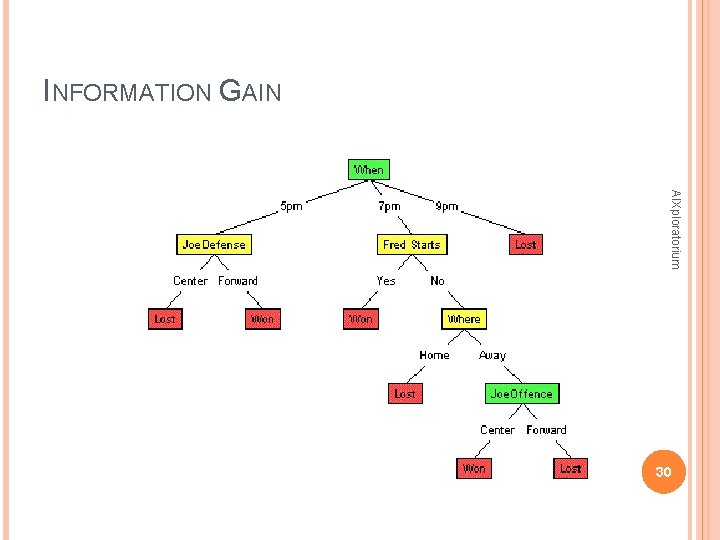
INFORMATION GAIN AIXploratorium 30
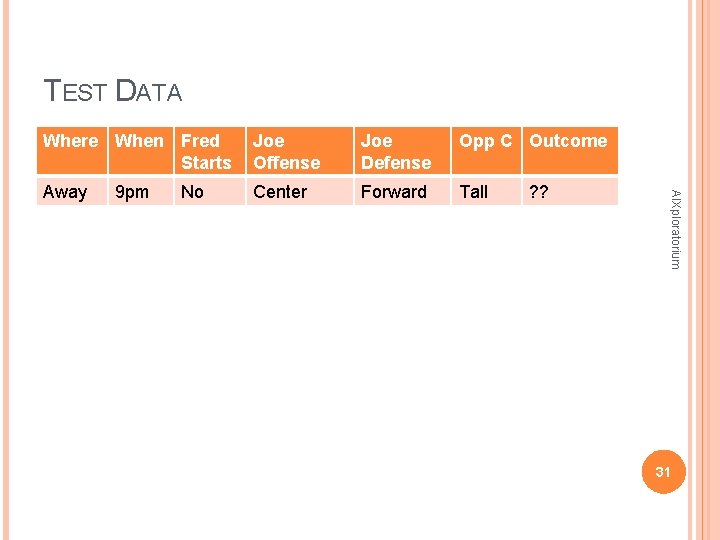
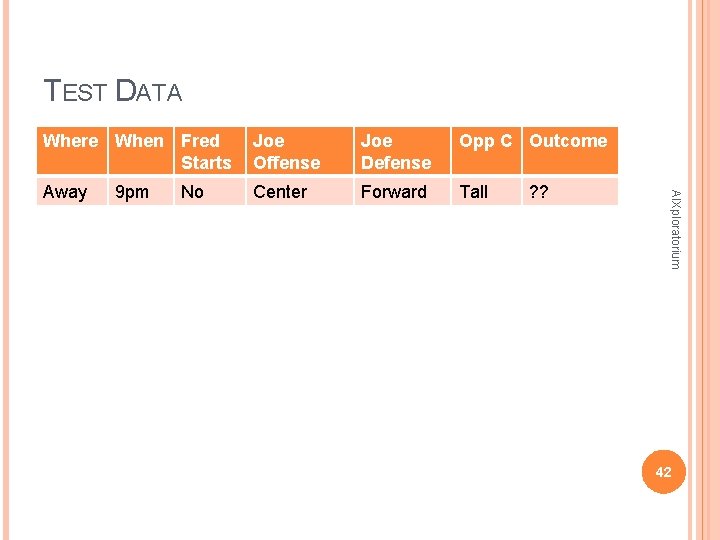
TEST DATA Joe Offense Joe Defense Opp C Outcome Away Center Forward Tall 9 pm No ? ? AIXploratorium Where When Fred Starts 31
DRAWBACKS OF INFORMATION GAIN Prefers attributes with many values (real attributes) Prefers Audience. Size {1, 2, 3, . . . , 150, 151, . . . , 1023, 1024, . . . } But larger attributes are not necessarily better Wikipedia / AIXploratorium Example: credit card number Has a high information gain because it uniquely identifies each customer But deciding how to treat a customer based on their credit card number is unlikely to generalize customers we haven't seen before 32
SPLITTING ALGORITHMS Random Information Gain Ratio GINI Index DBMS Data Mining Solutions Supplement 33
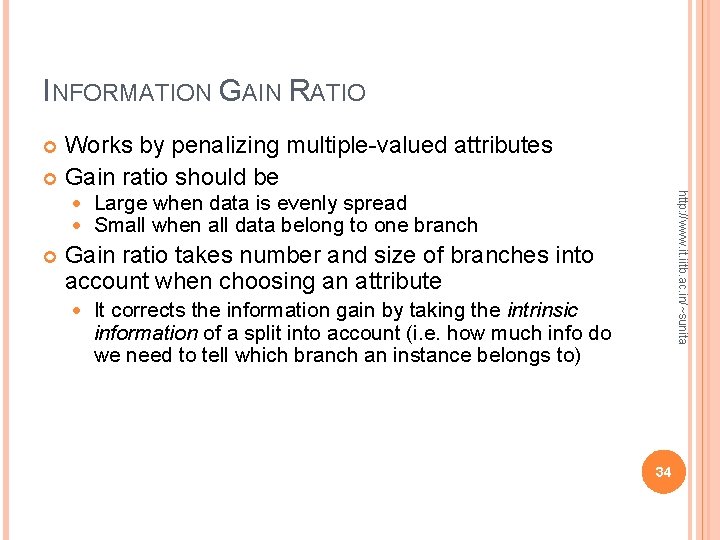
INFORMATION GAIN RATIO Works by penalizing multiple-valued attributes Gain ratio should be http: //www. it. iitb. ac. in/~sunita Large when data is evenly spread Small when all data belong to one branch Gain ratio takes number and size of branches into account when choosing an attribute It corrects the information gain by taking the intrinsic information of a split into account (i. e. how much info do we need to tell which branch an instance belongs to) 34
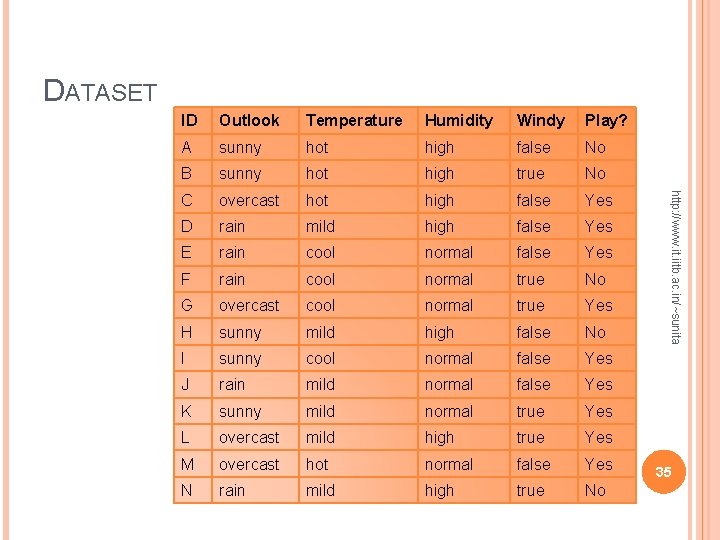
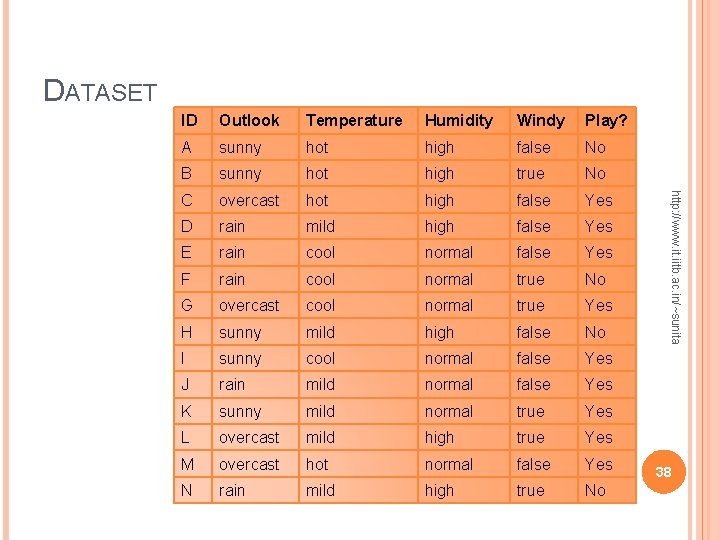
DATASET Outlook Temperature Humidity Windy Play? A sunny hot high false No B sunny hot high true No C overcast hot high false Yes D rain mild high false Yes E rain cool normal false Yes F rain cool normal true No G overcast cool normal true Yes H sunny mild high false No I sunny cool normal false Yes J rain mild normal false Yes K sunny mild normal true Yes L overcast mild high true Yes M overcast hot normal false Yes N rain mild high true No http: //www. it. iitb. ac. in/~sunita ID 35
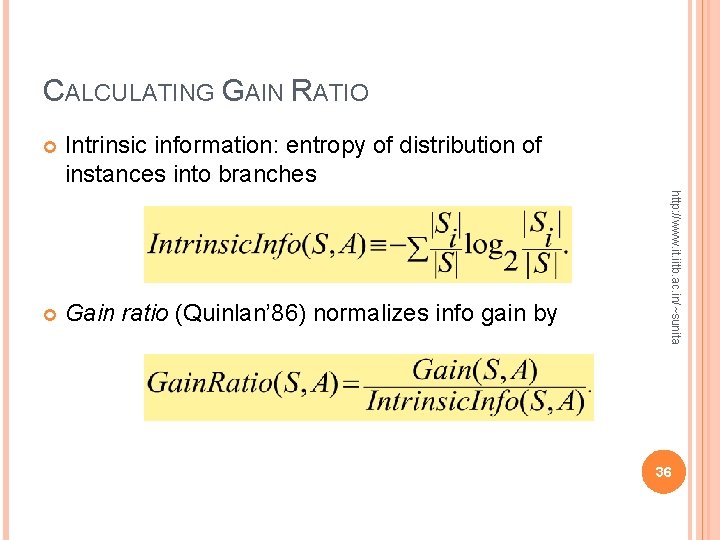
CALCULATING GAIN RATIO Intrinsic information: entropy of distribution of instances into branches Gain ratio (Quinlan’ 86) normalizes info gain by http: //www. it. iitb. ac. in/~sunita 36
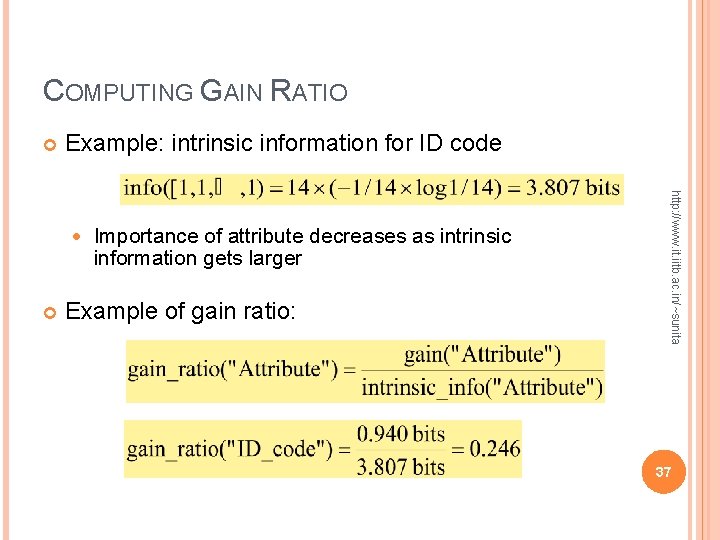
COMPUTING GAIN RATIO Example: intrinsic information for ID code Importance of attribute decreases as intrinsic information gets larger Example of gain ratio: http: //www. it. iitb. ac. in/~sunita 37
DATASET Outlook Temperature Humidity Windy Play? A sunny hot high false No B sunny hot high true No C overcast hot high false Yes D rain mild high false Yes E rain cool normal false Yes F rain cool normal true No G overcast cool normal true Yes H sunny mild high false No I sunny cool normal false Yes J rain mild normal false Yes K sunny mild normal true Yes L overcast mild high true Yes M overcast hot normal false Yes N rain mild high true No http: //www. it. iitb. ac. in/~sunita ID 38
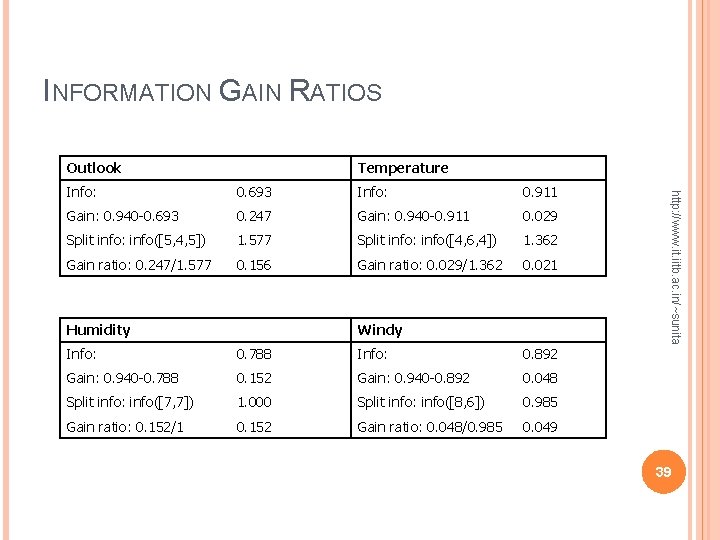
INFORMATION GAIN RATIOS Outlook Temperature 0. 693 Info: 0. 911 Gain: 0. 940 -0. 693 0. 247 Gain: 0. 940 -0. 911 0. 029 Split info: info([5, 4, 5]) 1. 577 Split info: info([4, 6, 4]) 1. 362 Gain ratio: 0. 247/1. 577 0. 156 Gain ratio: 0. 029/1. 362 0. 021 Humidity Windy Info: 0. 788 Info: 0. 892 Gain: 0. 940 -0. 788 0. 152 Gain: 0. 940 -0. 892 0. 048 Split info: info([7, 7]) 1. 000 Split info: info([8, 6]) 0. 985 Gain ratio: 0. 152/1 0. 152 Gain ratio: 0. 048/0. 985 0. 049 http: //www. it. iitb. ac. in/~sunita Info: 39
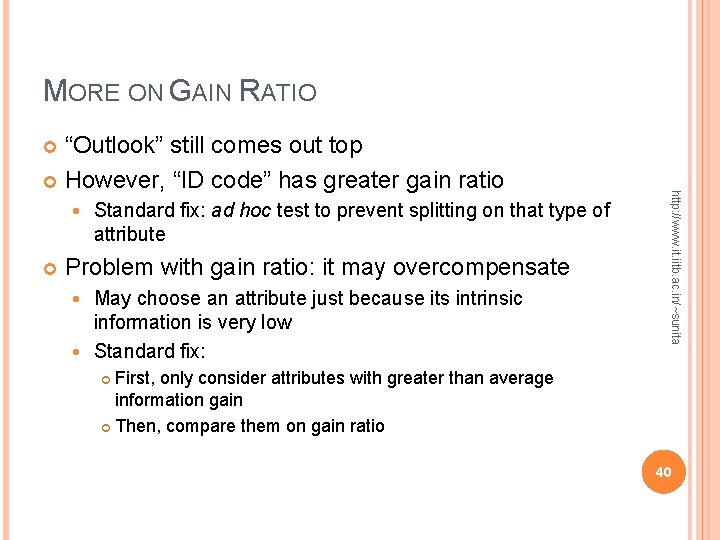
MORE ON GAIN RATIO “Outlook” still comes out top However, “ID code” has greater gain ratio Standard fix: ad hoc test to prevent splitting on that type of attribute Problem with gain ratio: it may overcompensate May choose an attribute just because its intrinsic information is very low Standard fix: http: //www. it. iitb. ac. in/~sunita First, only consider attributes with greater than average information gain Then, compare them on gain ratio 40
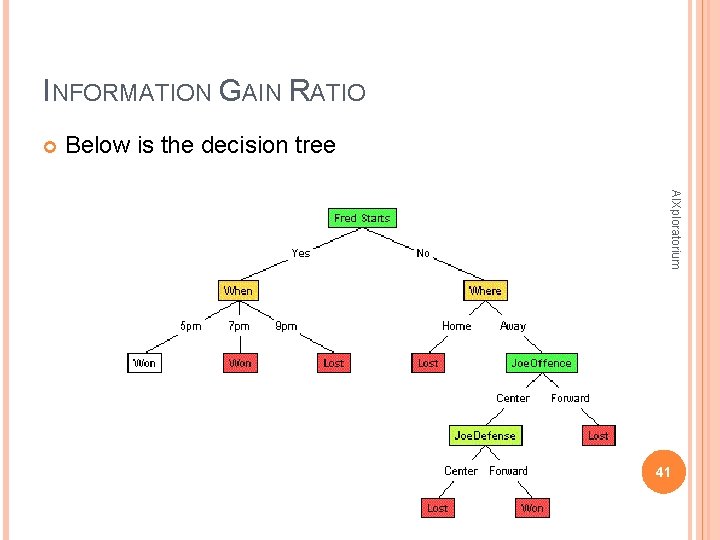
INFORMATION GAIN RATIO Below is the decision tree AIXploratorium 41
TEST DATA Joe Offense Joe Defense Opp C Outcome Away Center Forward Tall 9 pm No ? ? AIXploratorium Where When Fred Starts 42
SPLITTING ALGORITHMS Random Information Gain Ratio GINI Index DBMS Data Mining Solutions Supplement 43
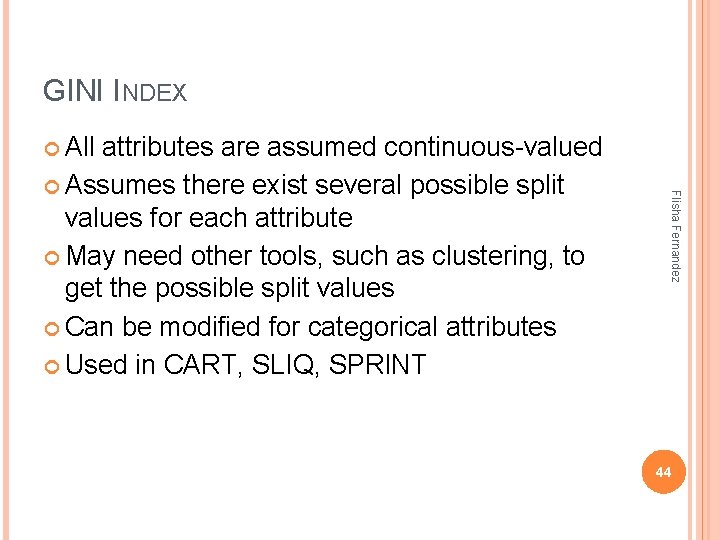
GINI INDEX All Flisha Fernandez attributes are assumed continuous-valued Assumes there exist several possible split values for each attribute May need other tools, such as clustering, to get the possible split values Can be modified for categorical attributes Used in CART, SLIQ, SPRINT 44
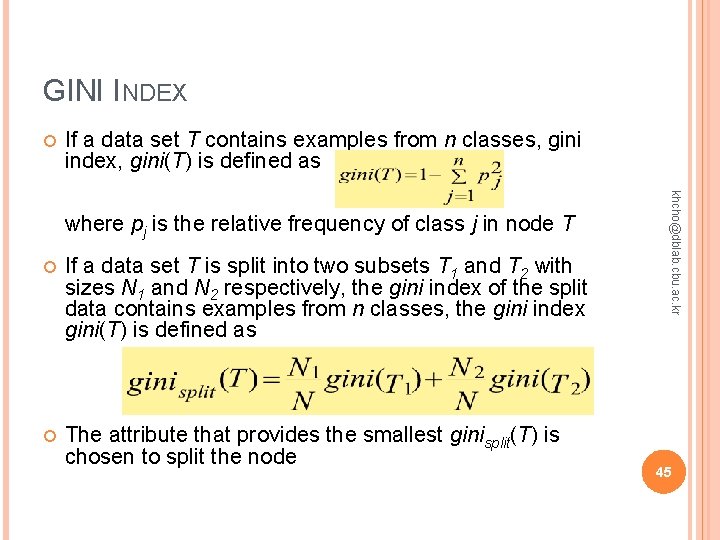
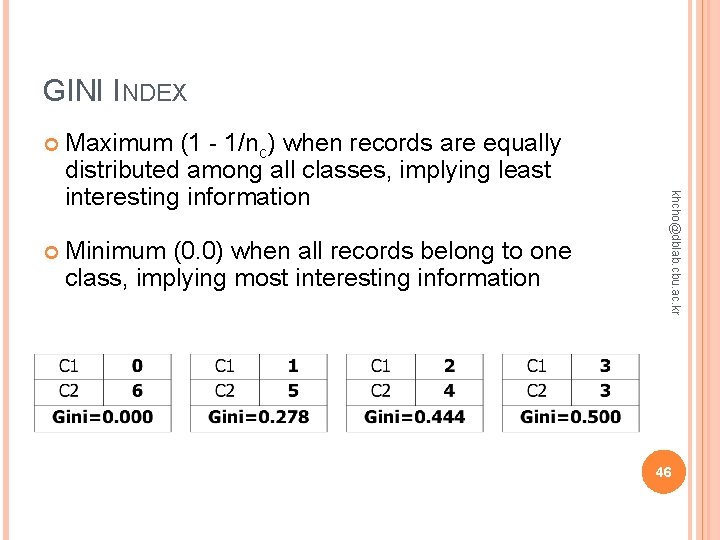
GINI INDEX If a data set T contains examples from n classes, gini index, gini(T) is defined as If a data set T is split into two subsets T 1 and T 2 with sizes N 1 and N 2 respectively, the gini index of the split data contains examples from n classes, the gini index gini(T) is defined as The attribute that provides the smallest ginisplit(T) is chosen to split the node khcho@dblab. cbu. ac. kr where pj is the relative frequency of class j in node T 45
GINI INDEX Maximum (1 - 1/nc) when records are equally distributed among all classes, implying least interesting information Minimum (0. 0) when all records belong to one class, implying most interesting information khcho@dblab. cbu. ac. kr 46
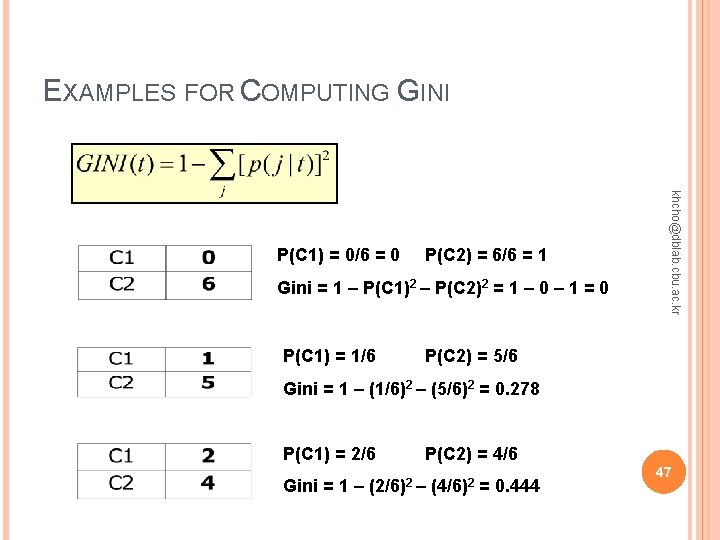
EXAMPLES FOR COMPUTING GINI P(C 2) = 6/6 = 1 Gini = 1 – P(C 1)2 – P(C 2)2 = 1 – 0 – 1 = 0 P(C 1) = 1/6 khcho@dblab. cbu. ac. kr P(C 1) = 0/6 = 0 P(C 2) = 5/6 Gini = 1 – (1/6)2 – (5/6)2 = 0. 278 P(C 1) = 2/6 Gini = 1 – P(C 2) = 4/6 (2/6)2 – (4/6)2 = 0. 444 47
STOPPING RULES Pure nodes Maximum tree depth, or maximum number of nodes in a tree Because of overfitting problems Minimum number of elements in a node considered for splitting, or its near equivalent Minimum number of elements that must be in a new node A threshold for the purity measure can be imposed such that if a node has a purity value higher than the threshold, no partitioning will be attempted regardless of the number of observations DBMS Data Mining Solutions Supplement / AI Depot 48
OVERFITTING The generated tree may overfit the training data Too many branches, some may reflect anomalies due to noise or outliers Result is in poor accuracy for unseen samples Two approaches to avoid overfitting Prepruning: Halt tree construction early—do not split a node if this would result in the goodness measure falling below a threshold Flisha Fernandez Difficult to choose an appropriate threshold Postpruning: Remove branches from a “fully grown” tree—get a sequence of progressively pruned trees Use a set of data different from the training data to decide which is the “best pruned tree” 49
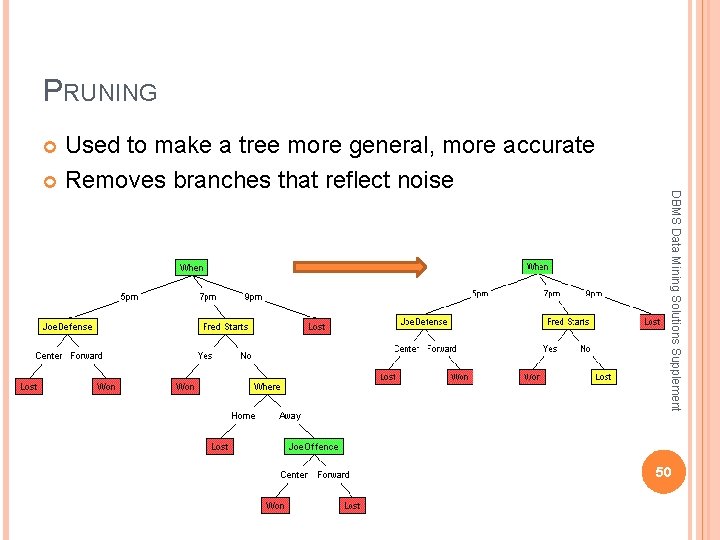
PRUNING Used to make a tree more general, more accurate Removes branches that reflect noise DBMS Data Mining Solutions Supplement 50
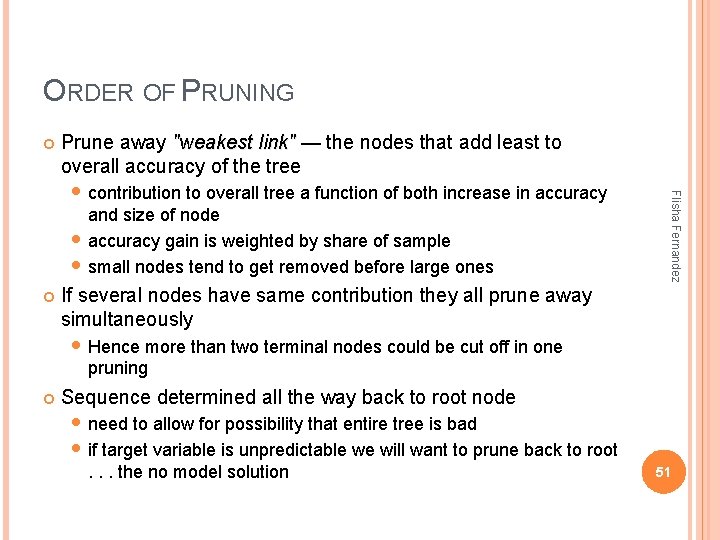
ORDER OF PRUNING Prune away "weakest link" — the nodes that add least to overall accuracy of the tree and size of node accuracy gain is weighted by share of sample small nodes tend to get removed before large ones Flisha Fernandez contribution to overall tree a function of both increase in accuracy If several nodes have same contribution they all prune away simultaneously Hence more than two terminal nodes could be cut off in one pruning Sequence determined all the way back to root node need to allow for possibility that entire tree is bad if target variable is unpredictable we will want to prune back to root. . . the no model solution 51
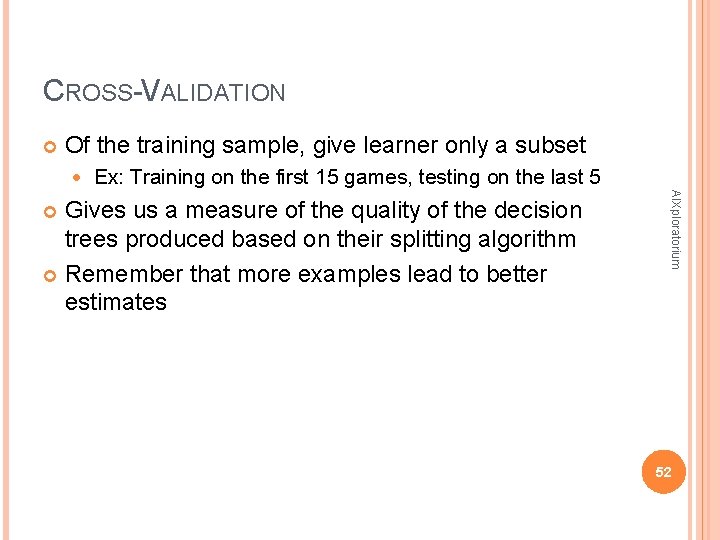
CROSS-VALIDATION Of the training sample, give learner only a subset Ex: Training on the first 15 games, testing on the last 5 AIXploratorium Gives us a measure of the quality of the decision trees produced based on their splitting algorithm Remember that more examples lead to better estimates 52
Flisha Fernandez ALGORITHMS 53
DECISION TREE METHODS ID 3 and C 4. 5 Algorithms Classification and Regression Trees (CART) Chi Square Automatic Interaction Detection (CHAID) Segments a dataset using 2 -way splits anderson. ucla. edu Developed by Ross Quinlan Segments a dataset using chi square tests to create multi-way splits And many others 54
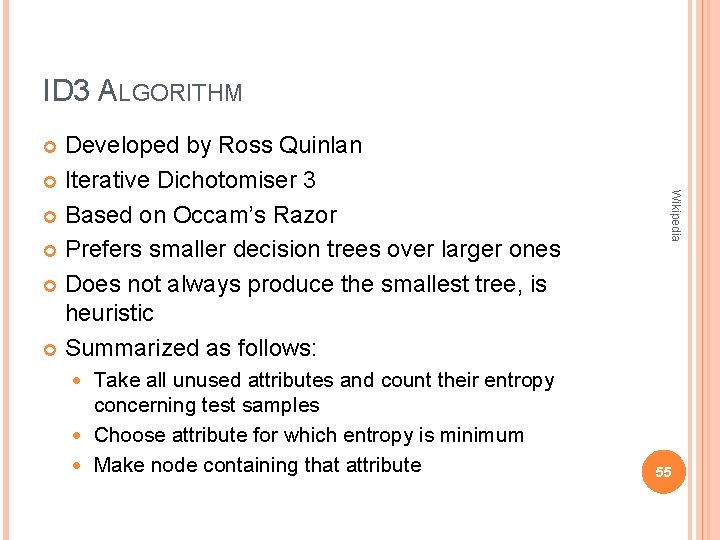
ID 3 ALGORITHM Developed by Ross Quinlan Iterative Dichotomiser 3 Based on Occam’s Razor Prefers smaller decision trees over larger ones Does not always produce the smallest tree, is heuristic Summarized as follows: Wikipedia Take all unused attributes and count their entropy concerning test samples Choose attribute for which entropy is minimum Make node containing that attribute 55
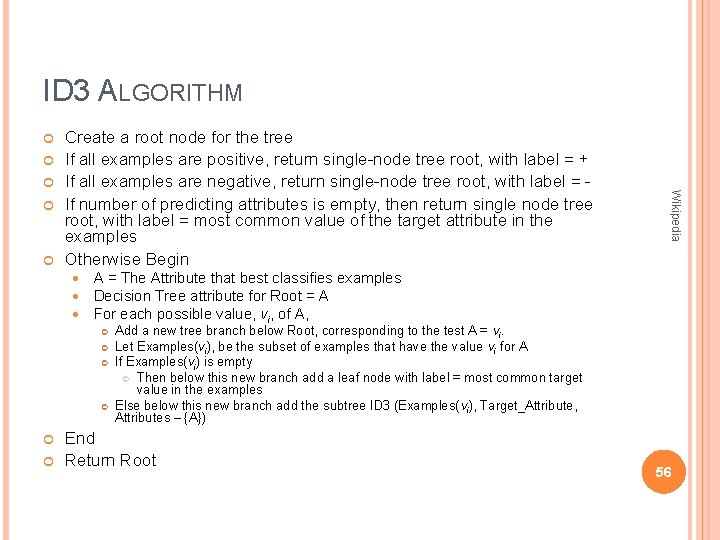
ID 3 ALGORITHM A = The Attribute that best classifies examples Decision Tree attribute for Root = A For each possible value, vi, of A, Wikipedia Create a root node for the tree If all examples are positive, return single-node tree root, with label = + If all examples are negative, return single-node tree root, with label = If number of predicting attributes is empty, then return single node tree root, with label = most common value of the target attribute in the examples Otherwise Begin Add a new tree branch below Root, corresponding to the test A = vi. Let Examples(vi), be the subset of examples that have the value vi for A If Examples(vi) is empty Then below this new branch add a leaf node with label = most common target value in the examples Else below this new branch add the subtree ID 3 (Examples(vi), Target_Attribute, Attributes – {A}) End Return Root 56
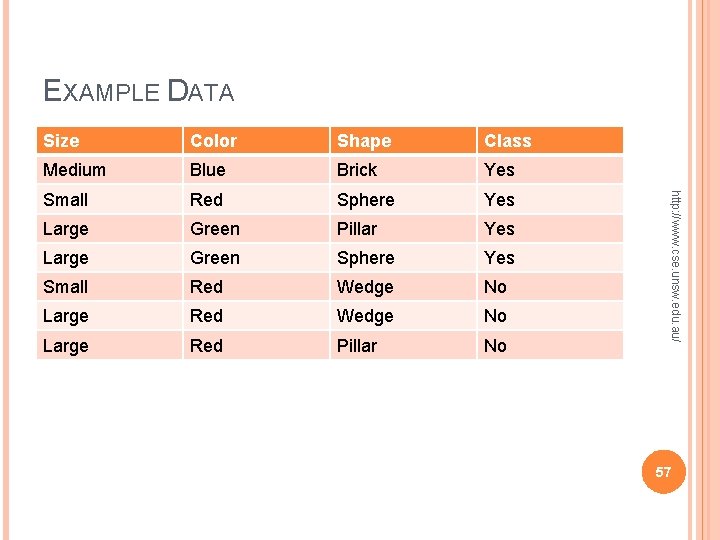
EXAMPLE DATA Color Shape Class Medium Blue Brick Yes Small Red Sphere Yes Large Green Pillar Yes Large Green Sphere Yes Small Red Wedge No Large Red Pillar No http: //www. cse. unsw. edu. au/ Size 57
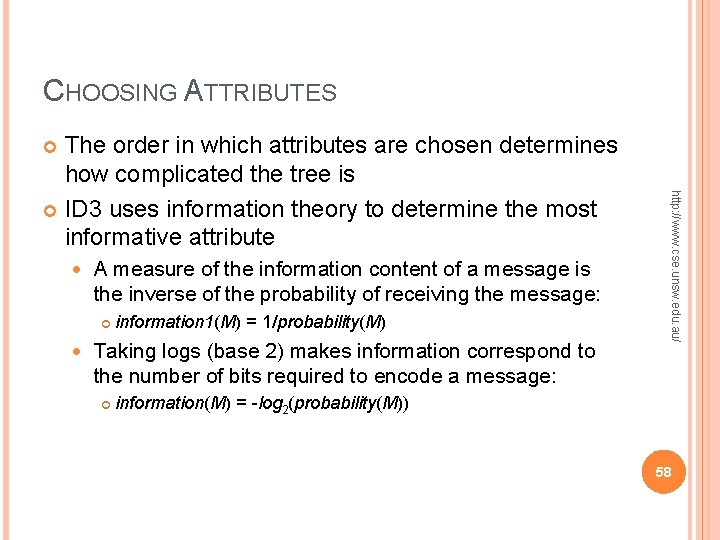
CHOOSING ATTRIBUTES The order in which attributes are chosen determines how complicated the tree is ID 3 uses information theory to determine the most informative attribute A measure of the information content of a message is the inverse of the probability of receiving the message: information 1(M) = 1/probability(M) Taking logs (base 2) makes information correspond to the number of bits required to encode a message: http: //www. cse. unsw. edu. au/ information(M) = -log 2(probability(M)) 58
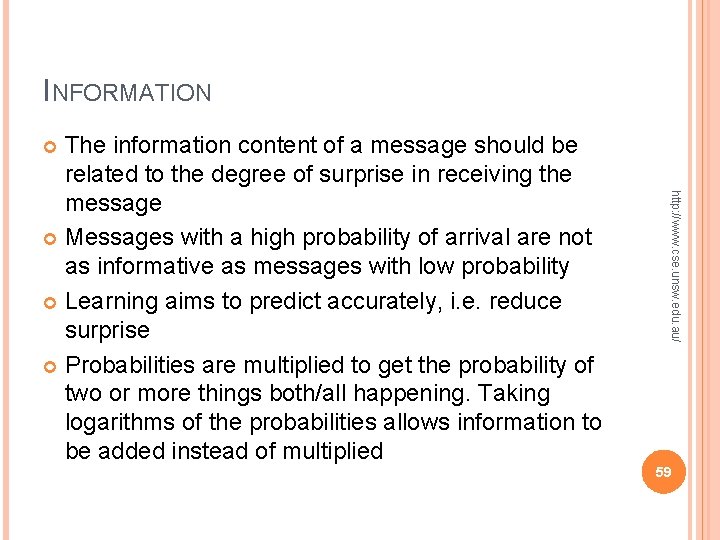
INFORMATION The information content of a message should be related to the degree of surprise in receiving the message Messages with a high probability of arrival are not as informative as messages with low probability Learning aims to predict accurately, i. e. reduce surprise Probabilities are multiplied to get the probability of two or more things both/all happening. Taking logarithms of the probabilities allows information to be added instead of multiplied http: //www. cse. unsw. edu. au/ 59
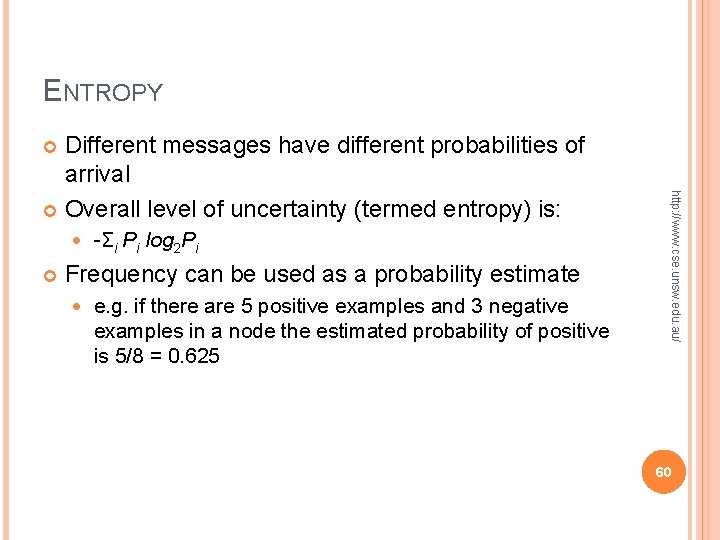
ENTROPY Different messages have different probabilities of arrival Overall level of uncertainty (termed entropy) is: -Σi Pi log 2 Pi Frequency can be used as a probability estimate e. g. if there are 5 positive examples and 3 negative examples in a node the estimated probability of positive is 5/8 = 0. 625 http: //www. cse. unsw. edu. au/ 60
LEARNING Learning tries to reduce the information content of the inputs by mapping them to fewer outputs Hence we try to minimize entropy http: //www. cse. unsw. edu. au/ 61
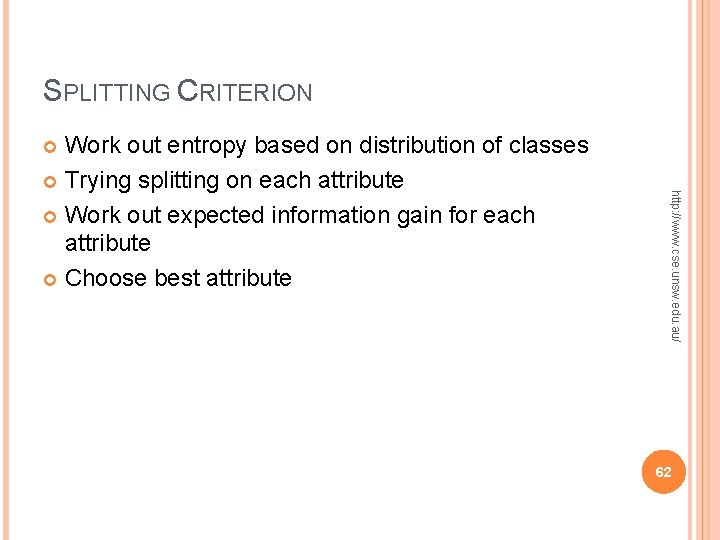
SPLITTING CRITERION Work out entropy based on distribution of classes Trying splitting on each attribute Work out expected information gain for each attribute Choose best attribute http: //www. cse. unsw. edu. au/ 62
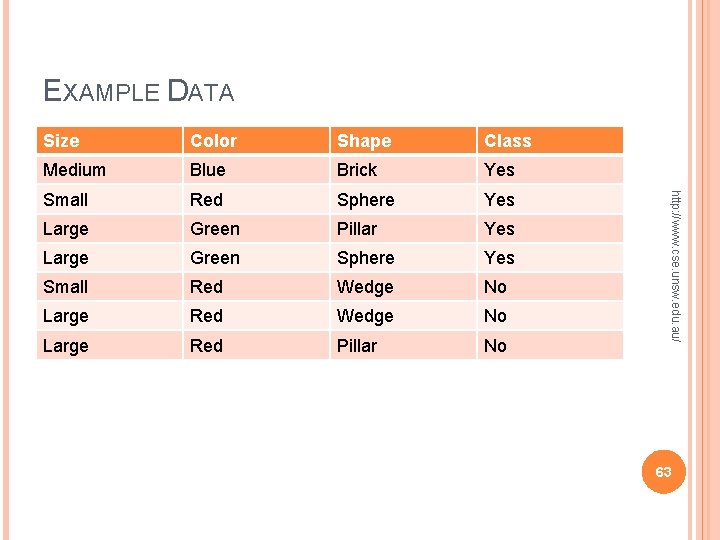
EXAMPLE DATA Color Shape Class Medium Blue Brick Yes Small Red Sphere Yes Large Green Pillar Yes Large Green Sphere Yes Small Red Wedge No Large Red Pillar No http: //www. cse. unsw. edu. au/ Size 63
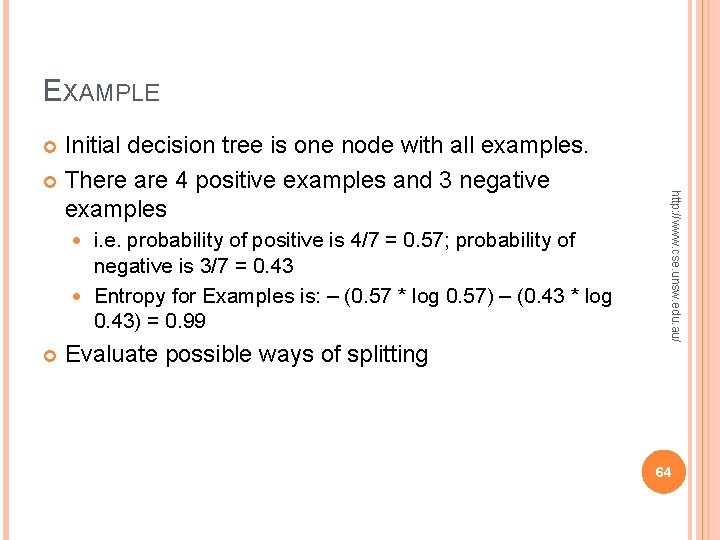
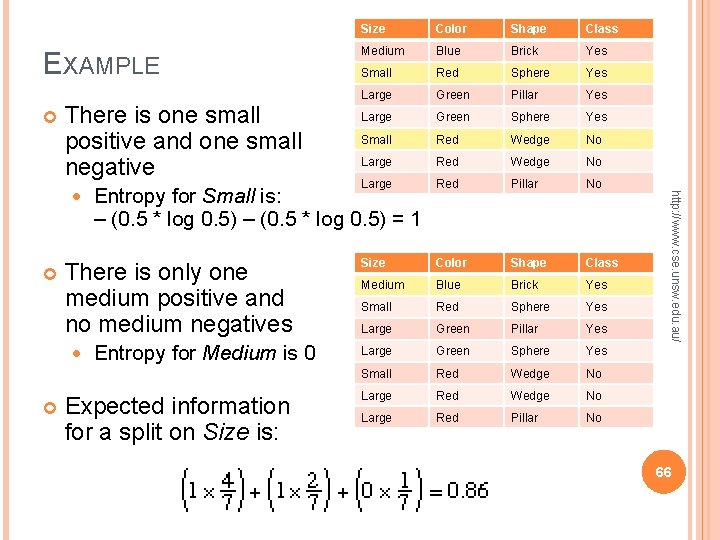
EXAMPLE Initial decision tree is one node with all examples. There are 4 positive examples and 3 negative examples Evaluate possible ways of splitting http: //www. cse. unsw. edu. au/ i. e. probability of positive is 4/7 = 0. 57; probability of negative is 3/7 = 0. 43 Entropy for Examples is: – (0. 57 * log 0. 57) – (0. 43 * log 0. 43) = 0. 99 64
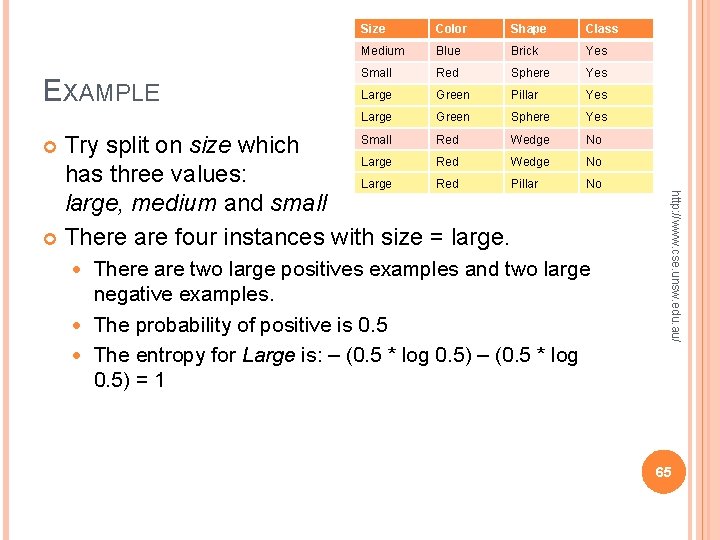
EXAMPLE Size Color Shape Class Medium Blue Brick Yes Small Red Sphere Yes Large Green Pillar Yes Large Green Sphere Yes No No No There are two large positives examples and two large negative examples. The probability of positive is 0. 5 The entropy for Large is: – (0. 5 * log 0. 5) = 1 http: //www. cse. unsw. edu. au/ Small Red Wedge Try split on size which Large Red Wedge has three values: Large Red Pillar large, medium and small There are four instances with size = large. 65
EXAMPLE There is one small positive and one small negative Shape Class Medium Blue Brick Yes Small Red Sphere Yes Large Green Pillar Yes Large Green Sphere Yes Small Red Wedge No Large Red Pillar No Size Color Shape Class Medium Blue Brick Yes Small Red Sphere Yes Large Green Pillar Yes Large Green Sphere Yes Small Red Wedge No Large Red Pillar No Entropy for Small is: – (0. 5 * log 0. 5) = 1 There is only one medium positive and no medium negatives Color Entropy for Medium is 0 Expected information for a split on Size is: http: //www. cse. unsw. edu. au/ Size 66
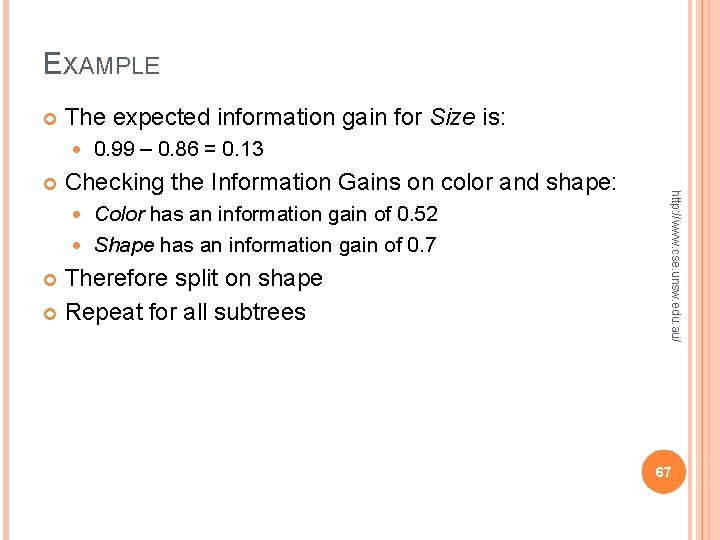
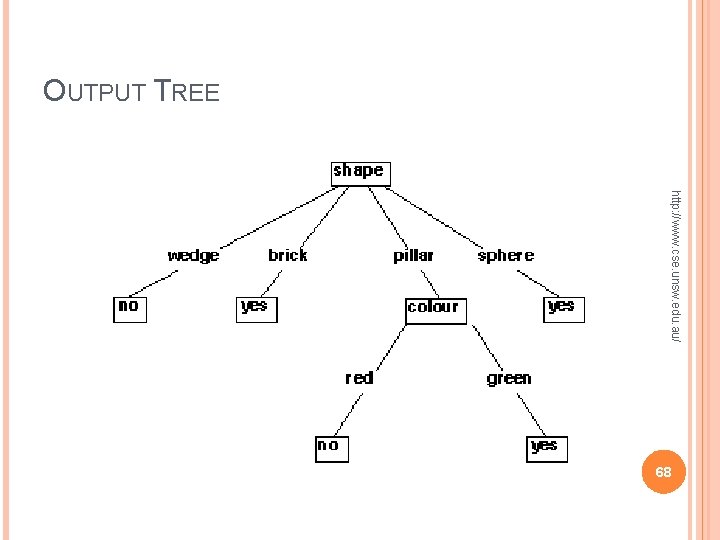
EXAMPLE The expected information gain for Size is: Checking the Information Gains on color and shape: Color has an information gain of 0. 52 Shape has an information gain of 0. 7 Therefore split on shape Repeat for all subtrees http: //www. cse. unsw. edu. au/ 0. 99 – 0. 86 = 0. 13 67
OUTPUT TREE http: //www. cse. unsw. edu. au/ 68
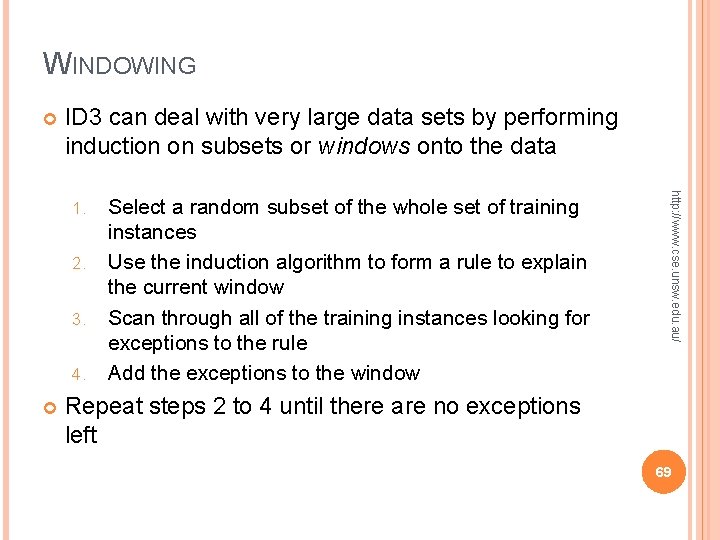
WINDOWING ID 3 can deal with very large data sets by performing induction on subsets or windows onto the data 2. 3. 4. Select a random subset of the whole set of training instances Use the induction algorithm to form a rule to explain the current window Scan through all of the training instances looking for exceptions to the rule Add the exceptions to the window http: //www. cse. unsw. edu. au/ 1. Repeat steps 2 to 4 until there are no exceptions left 69
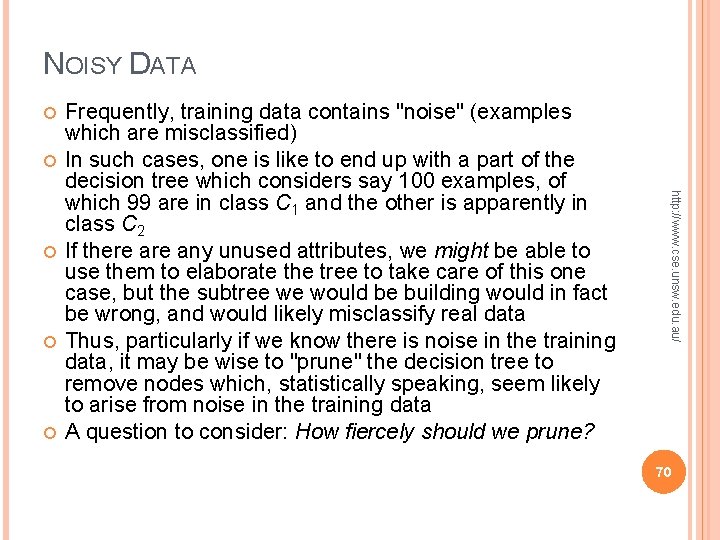
NOISY DATA http: //www. cse. unsw. edu. au/ Frequently, training data contains "noise" (examples which are misclassified) In such cases, one is like to end up with a part of the decision tree which considers say 100 examples, of which 99 are in class C 1 and the other is apparently in class C 2 If there any unused attributes, we might be able to use them to elaborate the tree to take care of this one case, but the subtree we would be building would in fact be wrong, and would likely misclassify real data Thus, particularly if we know there is noise in the training data, it may be wise to "prune" the decision tree to remove nodes which, statistically speaking, seem likely to arise from noise in the training data A question to consider: How fiercely should we prune? 70
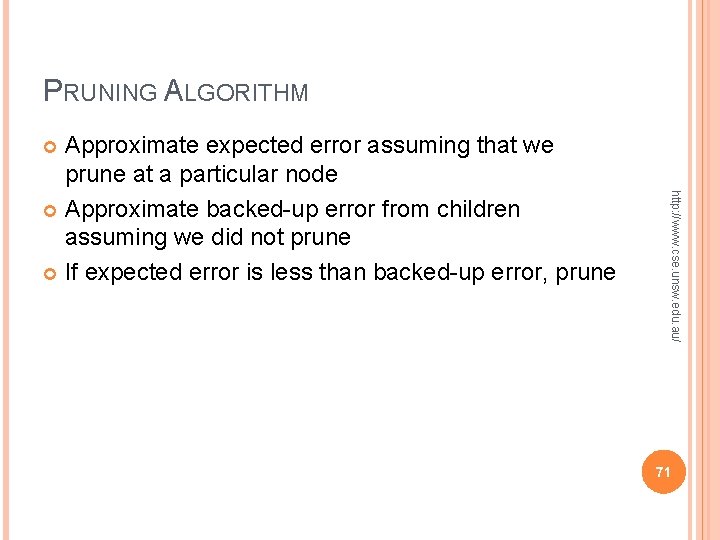
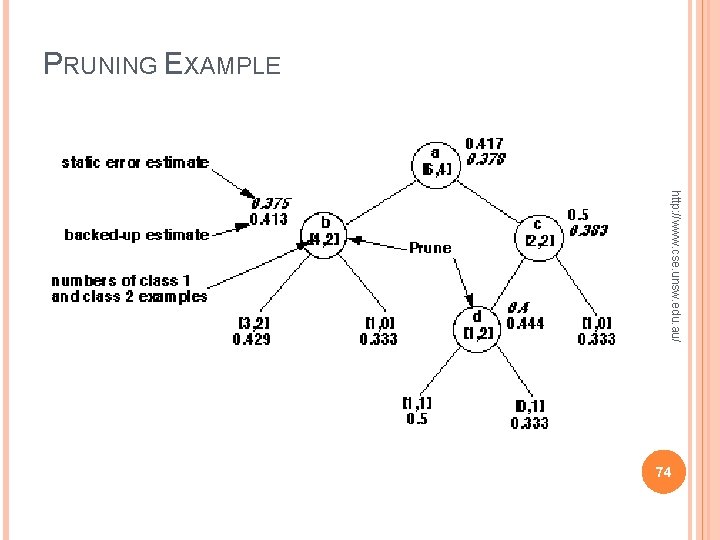
PRUNING ALGORITHM Approximate expected error assuming that we prune at a particular node Approximate backed-up error from children assuming we did not prune If expected error is less than backed-up error, prune http: //www. cse. unsw. edu. au/ 71
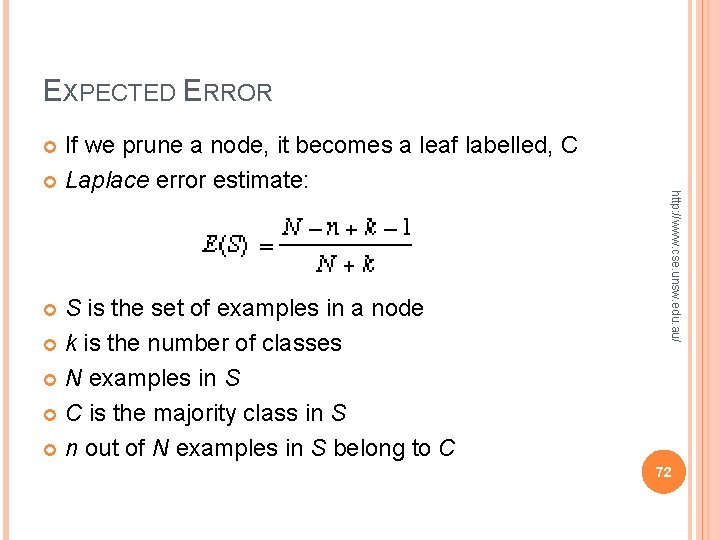
EXPECTED ERROR If we prune a node, it becomes a leaf labelled, C Laplace error estimate: http: //www. cse. unsw. edu. au/ S is the set of examples in a node k is the number of classes N examples in S C is the majority class in S n out of N examples in S belong to C 72
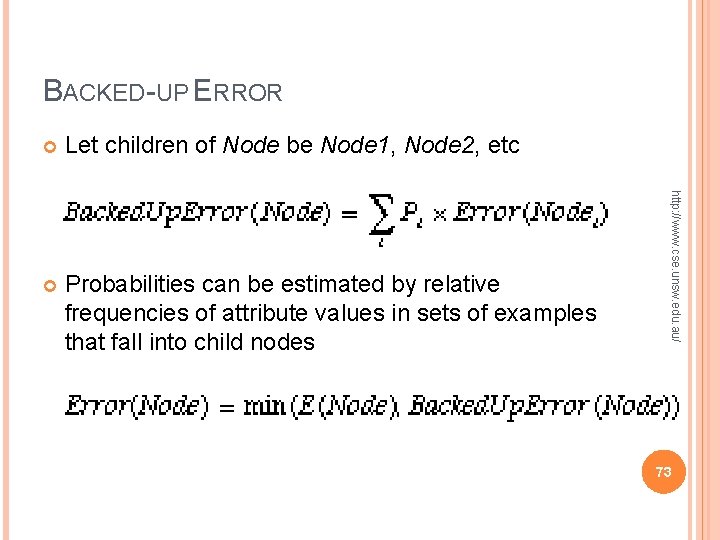
BACKED-UP ERROR Let children of Node be Node 1, Node 2, etc Probabilities can be estimated by relative frequencies of attribute values in sets of examples that fall into child nodes http: //www. cse. unsw. edu. au/ 73
PRUNING EXAMPLE http: //www. cse. unsw. edu. au/ 74
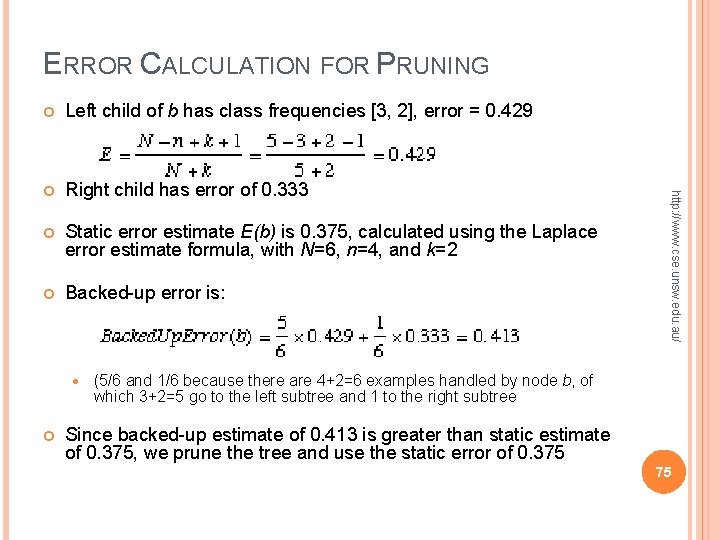
ERROR CALCULATION FOR PRUNING Left child of b has class frequencies [3, 2], error = 0. 429 Right child has error of 0. 333 Static error estimate E(b) is 0. 375, calculated using the Laplace error estimate formula, with N=6, n=4, and k=2 Backed-up error is: http: //www. cse. unsw. edu. au/ (5/6 and 1/6 because there are 4+2=6 examples handled by node b, of which 3+2=5 go to the left subtree and 1 to the right subtree Since backed-up estimate of 0. 413 is greater than static estimate of 0. 375, we prune the tree and use the static error of 0. 375 75
C 4. 5 ALGORITHM An extension of the C 4. 5 algorithm Statistical classifier Uses concept of Information Entropy Wikpedia 76
C 4. 5 REFINEMENTS OVER ID 3 Splitting criterion is Information Gain Ratio Post-pruning after induction of trees, e. g. based on test sets, in order to increase accuracy Allows for attributes that have a whole range of discrete or continuous values Handles training data with missing attribute values by replacing them with the most common or the most probable value informatics. sussex. ac. uk 77