Digital Image Processing Module 1 DIGITAL IMAGE FUNDAMENTALS


")


 but can")


 Simultaneous contrast. All small squares have exactly")


 A Intensity B Position In area A,")


, green (G)")


 • Hue, H, specifies the dominant pure")

 •")

: – The amount of source")
 –")
: – 0. 01: black")

 is called:")


")


 of the same object can be generated")


 A column vector is an m × 1")

 The inner product (also called")


- Slides: 78
Digital Image Processing Module 1 DIGITAL IMAGE FUNDAMENTALS Prepared by K. Indragandhi, AP(Sr. Gr. )/ECE
References 1. Rafael C. Gonzalez and Richard E. Woods, “Digital Image Processing”, Pearson Education, Inc. , Second Edition, 2004. 2. Anil K. Jain, “Fundamentals of Digital Image Processing”, Prentice Hall of India, 2002. 3. William K. Pratt, “Digital Image Processing”, 2 nd Edition, Wiley & Sons, Inc. , 1991.
• What is an Image? Picture, photograph Visual data Usually two or three dimensional What is a digital image? An image which is “discretized, ”, i. e. , defined on a discrete grid Two-dimensional collection of light values (or gray values)
Basic Terminology What is a digital image? • A representation of the original image by a discrete set of data points • Each of these data points is called a picture element, commonly referred to as a “pixel”
Digital Image Generation Generating a digital image • Place a regular 2 D grid over an image and read the colour value • at the intersections of the grid => set of data points for that image
What is digital image processing? Digital image processing is the study of representation and manipulation of pictorial information by a computer. Improve pictorial information for better clarity (human interpretation) Automatic machine processing of scene data (interpretation by a machine/non-human, storage, transmission) What is image interpetation? Assign meaning to an ensemble of recognized objects
Digital Image Digital image = a multidimensional array of numbers (such as intensity image) or vectors (such as color image) Each component in the image called pixel associates with the pixel value (a single number in the case of intensity images or a vector in the case of color images).
Important steps in a typical image processing system Step 1: Image acquisition Capturing visual data by an image sensor Step 2: Discretization / digitalization; Quantization ; Compression Convert data into discrete form; compress for efficient storage/transmission Step 3: Image enhancement and restoration Improving image quality (low contrast, blur noise) Step 4: Image segmentation Partition image into objects or constituent parts
Chapter 1: Introduction
Chapter 1: Introduction
ü Image enhancement and restoration both involve techniques to make a better image ü Image compression involves development of techniques to make smaller files, while still retaining high quality images
ELEMENTS OF VISUAL PERCEPTION
ELEMENTS OF VISUAL PERCEPTION Human Visual Perception
The Human Eye • Diameter: 20 mm • 3 membranes enclose the eye – Cornea & sclera – Choroid – Retina
The Choroid • The choroid contains blood vessels for eye nutrition and is heavily pigmented to reduce extraneous light entrance and backscatter. • It is divided into the ciliary body and the iris diaphragm, which controls the amount of light that enters the pupil (2 mm ~ 8 mm).
The Lens • The lens is made up of fibrous cells and is suspended by fibers that attach it to the ciliary body. • It is slightly yellow and absorbs approx. 8% of the visible light spectrum. • The lens contains 60 -70% water, 6% of fat.
The Retina • The retina lines the entire posterior portion. • Discrete light receptors are distributed over the surface of the retina: – cones (6 -7 million per eye) and – rods (75 -150 million per eye)
Cones • Cones are located in the fovea and are sensitive to color. • Each one is connected to its own nerve end. • Cone vision is called photopic (or bright-light vision or day vision). • There are three types of cones: Red, Green, and Blue
Rods ü Rods are giving a general, overall picture of the field of view ü They see only brightness (not color) and are not involved in color vision. • Several rods are connected to a single nerve and are sensitive to low levels of illumination (scotopic or dim-light vision or night vision).
MESOPIC VISION • Intermediate region of illumination – between dim and bright light • Both rods and cones are active
Receptor Distribution • The distribution of receptors is radially symmetric about the fovea. • Cones are most dense in the center of the fovea while rods increase in density from the center out to approximately 20% off axis and then decrease.
Cones & Rods
The Fovea • The fovea is circular (1. 5 mm in diameter) but can be assumed to be a square sensor array (1. 5 mm x 1. 5 mm). • The density of cones: 150, 000 elements/mm 2 ~ 337, 000 for the fovea. • A CCD imaging chip of medium resolution needs 5 mm x 5 mm for this number of elements
BLIND SPOT • Blind spot is the region of emergence of the optic nerve from the eye • Place on the retina where optic nerve connects, and which consists of no light sensors
Image Formation in the Eye • The eye lens (if compared to an optical lens) is flexible. • It gets controlled by the fibers of the ciliary body and to focus on distant objects it gets flatter (and vice versa).
Image Formation in the Eye • Distance between the center of the lens and the retina (focal length): – varies from 17 mm to 14 mm (refractive power of lens goes from minimum to maximum). • Objects farther than 3 m use minimum refractive lens powers (and vice versa).
Image Formation in the Eye • Example: – Calculation of retinal image of an object
Image Formation in the Eye
Image Formation in the Eye • Perception takes place by the relative excitation of light receptors. • These receptors transform radiant energy into electrical impulses that are ultimately decoded by the brain.
LUMINANCE OR INTENSITY • Emitting or reflecting light from the object • The luminance of an object is independent of the luminance of the surrounding objects
BRIGHTNESS • Brightness is the perceived luminance • Depends on the luminance of the surround • Two objects with different surroundings could have identical luminance but different brightness
CONTRAST • Contrast is the difference in visual properties that makes an object (or its representation in an image) distinguishable from other objects and the background • Contrast is determined by the difference in the color and brightness of the light reflected or emitted by an object and other objects within the same field of view.
Brightness Adaptation of Human Eye (cont. ) Simultaneous contrast. All small squares have exactly the same intensity but they appear progressively darker as background becomes lighter.
HUE • The hue of a color refers to its “redness”, “greenness” and so on. • A hue refers to the gradation of color within the optical spectrum, or visible spectrum, of light. • "Hue" may also refer to a particular color within this spectrum, as defined by its dominant wavelength, • or the central tendency of its combined wavelengths. For example, a light wave with a central tendency within 565 -590 nm will be yellow.
SATURATION • Saturation refers to the intensity of a specific hue. • In art or when working with colors, saturation is the amount of color a certain color has. For example, black and white have no saturation and bright red has 100% saturation
MACH BAND EFFECT • The spatial interaction from an object and its surroundings creates a phenomenon called mach band effect. • The visual system tends to undershoot or overshoot around the boundary of regions of different intensities
Brightness Adaptation of Human Eye (cont. ) A Intensity B Position In area A, brightness perceived is darker while in area B is brighter. This phenomenon is called Mach Band Effect.
MACH BAND EFFECT
• Although the intensity of the stripes is constant, we actually perceive a brightness pattern that is strongly scalloped, especially near the boundaries • These scalloped bands are called mach bands
RGB Model • An additive colour model, based on three components: red(R), green (G) and Blue (B). • 8 bits are usually used for each colour (=> 24 bits total) • These can be stored (in memory) as 3 separate colour planes. . • . . . or in an ‘interlaced form’, with each pixel represented with 3 bytes (24 bits) sequentially.
But!!!!! Not all colours can be represented by the RGB system However It is probably good enough to fool the human vision system
The RGB Cube B Blue Cyan Magenta Green Red R Yellow G
The HSI Model (an alternative to RGB) • Hue, H, specifies the dominant pure colour perceived by the observer (e. g. red, yellow, blue) [i. e. a representation of the frequency/wavelength] • Saturation, S, specifies the degree to which a pure colour has been diluted by white light to produce observed colour. • Intensity, I, is related to the perceived brightness of the colour. N. B. Decoupling (separating) intensity from colour is very useful in image manipulation and analysis as increased/decreased lighting in a scene (more or less) only effect this parameter.
The HSI Cone Intensity White Hue Green Yellow Cyan Red Saturation Blue Magenta Black
A Simple Image Model • Image: a 2 -D light-intensity function f(x, y) • The value of f at (x, y) the intensity (brightness) of the image at that point • 0 < f(x, y) <
Digital Image Acquisition
A Simple Image Model • Nature of f(x, y): – The amount of source light incident on the scene being viewed – The amount of light reflected by the objects in the scene
A Simple Image Model • Illumination & reflectance components: – Illumination: i(x, y) – Reflectance: r(x, y) – f(x, y) = i(x, y) r(x, y) – 0 < i(x, y) < and 0 < r(x, y) < 1 (from total absorption to total reflectance)
A Simple Image Model • Sample values of r(x, y): – 0. 01: black velvet – 0. 93: snow • Sample values of i(x, y): – 9000 foot-candles: sunny day – 1000 foot-candles: cloudy day – 0. 01 foot-candles: full moon
Create an image To create a digital image, we need to convert the continuously sensed data into digital form. This involves: Sampling: Digitizing the coordinate values (resolution) Depends on density of sensor in an array Limited by optical resolution Quantization (bits/pixel) • Digitizing the amplitude values Pixel: short for picture element
Sampling & Quantization • The spatial and amplitude digitization of f(x, y) is called: – image sampling when it refers to spatial coordinates (x, y) and – gray-level quantization when it refers to the amplitude.
Digital Image
Sampling and Quantization
A Digital Image
Sampling & Quantization Digital Image Elements (Pixels)
Sampling & Quantization • The digitization process requires decisions about: – values for N, M (where N x M: the image array) and – the number of discrete gray levels allowed for each pixel.
Sampling & Quantization • Usually, in DIP these quantities are integer powers of two: N=2 n M=2 m and G=2 k number of gray levels • Another assumption is that the discrete levels are equally spaced between 0 and L-1 in the gray scale.
Examples
Examples
Examples
Examples
Sampling & Quantization • If b is the number of bits required to store a digitized image then: – b = N x M x k (if M=N, then b=N 2 k)
Storage
Sampling & Quantization • How many samples and gray levels are required for a good approximation? – Resolution (the degree of discernible detail) of an image depends on sample number and gray level number. – i. e. the more these parameters are increased, the closer the digitized array approximates the original image.
Sampling & Quantization • How many samples and gray levels are required for a good approximation? (cont. ) – But: storage & processing requirements increase rapidly as a function of N, M, and k
Sampling & Quantization • Different versions (images) of the same object can be generated through: – Varying N, M numbers – Varying k (number of bits) – Varying both
Sampling & Quantization • Conclusions: – Quality of images increases as N & k increase – Sometimes, for fixed N, the quality improved by decreasing k (increased contrast) – For images with large amounts of detail, few gray levels are needed
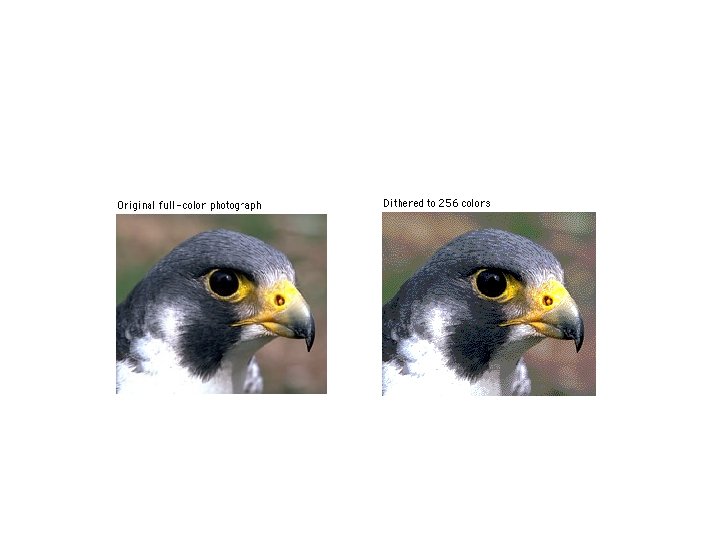
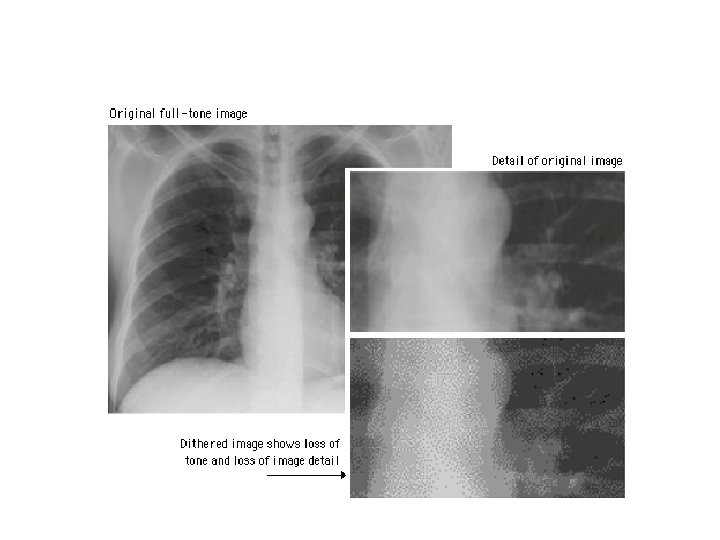
Dithering • Full-color photographs may contain an almost infinite range of color values • Dithering is the attempt by a computer program to approximate a color from a mixture of other colors when the required color is not available • Dithering is the most common means of reducing the color range of images down to the 256 (or fewer) colors seen in 8 -bit GIF images
• Most images are dithered in a diffusion or randomized pattern to diminish the harsh transition from one color to another • But dithering also reduces the overall sharpness of an image, and it often introduces a noticeable grainy pattern in the image • This loss of image detail is especially apparent when fullcolor photos are dithered down to the 216 -color browser -safe palette.
TWO DIMENSIONAL MATHEMATICAL PRELIMINARIES
Review: Matrices and Vectors Definitions (Con’t) A column vector is an m × 1 matrix: A row vector is a 1 × n matrix: A column vector can be expressed as a row vector by using the transpose: 73
Review: Matrices and Vectors Some Basic Matrix Operations • The sum of two matrices A and B (of equal dimension), denoted A + B, is the matrix with elements aij + bij. • The difference of two matrices, A B, has elements aij bij. • The product, AB, of m×n matrix A and p×q matrix B, is an m×q matrix C whose (i, j)-th element is formed by multiplying the entries across the ith row of A times the entries down the jth column of B; that is, 74
Review: Matrices and Vectors Some Basic Matrix Operations (Con’t) The inner product (also called dot product) of two vectors is defined as Note that the inner product is a scalar. 75
TOEPLITZ MATRIX, CIRCULANT MATRIX • It has a constant elements along the main diagonal and the sub diagonals • Circulant matrix – each of its rows (or columns) is a circular shift of the previous row(or column) 76
ORTHOGONAL AND UNITARY MATRICES • An orthogonal matrix is such that its inverse is equal to its transpose A-1 = AT • A Matrix is called unitary if its inverse is equal to its conjugate transpose A-1 = A*T 77
BLOCK MATRIX • Any matrix whose elements are matrices themselves is called a block matrix. 78