Data Mining An Overview David Madigan dmadiganrci rutgers


: “if hypothesis H implies hypothesis H', then")


 Parameters: Score: Search: steepest descent; search for structure?")


 • Gaussian kernel density")


 • Covariate")


- Slides: 79
Data Mining: An Overview David Madigan dmadigan@rci. rutgers. edu http: //stat. rutgers. edu/~madigan
Overview • Brief Introduction to Data Mining • Data Mining Algorithms • Specific Examples – Algorithms: Disease Clusters – Algorithms: Model-Based Clustering – Algorithms: Frequent Items and Association Rules • Future Directions, etc.
Of “Laws”, Monsters, and Giants… • Moore’s law: processing “capacity” doubles every 18 months : CPU, cache, memory • It’s more aggressive cousin: – Disk storage “capacity” doubles every 9 months What do the two “laws” combined produce? A rapidly growing gap between our ability to generate data, and our ability
What is Data Mining? Finding interesting structure in data • Structure: refers to statistical patterns, predictive models, hidden relationships • Examples of tasks addressed by Data Mining – Predictive Modeling (classification, regression) – Segmentation (Data Clustering ) – Summarization – Visualization
Ronny Kohavi, ICML 1998
Ronny Kohavi, ICML 1998
Ronny Kohavi, ICML 1998
Stories: Online Retailing
Chapter 4: Data Analysis and Uncertainty • Elementary statistical concepts: random variables, distributions, densities, independence, point and interval estimation, bias & variance, MLE • Model (global, represent prominent structures) vs. Pattern (local, idiosyncratic deviations): • Frequentist vs. Bayesian • Sampling methods
Bayesian Estimation e. g. beta-binomial model: Predictive distribution:
Issues to do with p-values • Using threshold’s of 0. 05 or 0. 01 regardless of sample size • Multiple testing (e. g. Friedman (1983) selecting highly significant regressors from noise) • Subtle interpretation Jeffreys (1980): “I have always considered the arguments for the use of P absurd. They amount to saying that a hypothesis that may or may not be true is rejected because a greater departure from the trial value was improbable; that is, that is has not predicted something that has not happened. ”
p-value as measure of evidence Schervish (1996): “if hypothesis H implies hypothesis H', then there should be at least as much support for H' as for H. ” - not satisfied by p-values Grimmet and Ridenhour (1996): “one might expect an outlying data point to lend support to the alternative hypothesis in, for instance, a one-way analysis of variance. ” - the value of the outlying data point that minimizes the significance level can lie within the range of the data
Chapter 5: Data Mining Algorithms “A data mining algorithm is a well-defined procedure that takes data as input and produces output in the form of models or patterns” “well-defined”: can be encoded in software “algorithm”: must terminate after some finite number of steps
Data Mining Algorithms “A data mining algorithm is a well-defined procedure that takes data as input and produces output in the form of models or patterns” Hand, Mannila, and Smyth “well-defined”: can be encoded in software “algorithm”: must terminate after some finite number of steps
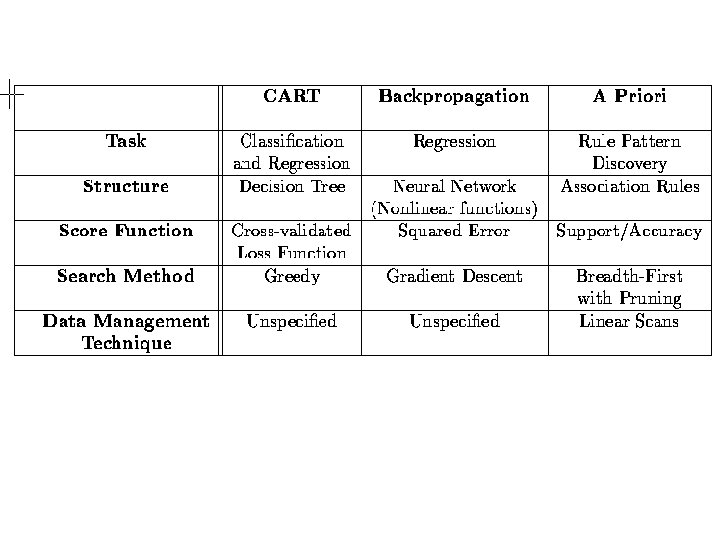
Algorithm Components 1. The task the algorithm is used to address (e. g. classification, clustering, etc. ) 2. The structure of the model or pattern we are fitting to the data (e. g. a linear regression model) 3. The score function used to judge the quality of the fitted models or patterns (e. g. accuracy, BIC, etc. ) 4. The search or optimization method used to search over parameters and/or structures (e. g. steepest descent, MCMC, etc. ) 5. The data management technique used for storing, indexing, and retrieving data (critical when data too large to reside in memory)
Backpropagation data mining algorithm x 1 x 2 h 1 x 3 h 2 y x 4 4 2 • vector of p input values multiplied by p d 1 weight matrix • resulting d 1 values individually transformed by non-linear 1 function • resulting d 1 values multiplied by d 1 d 2 weight matrix
Backpropagation (cont. ) Parameters: Score: Search: steepest descent; search for structure?
Models and Patterns Models Prediction • Linear regression • Piecewise linear Probability Distributions Structured Data
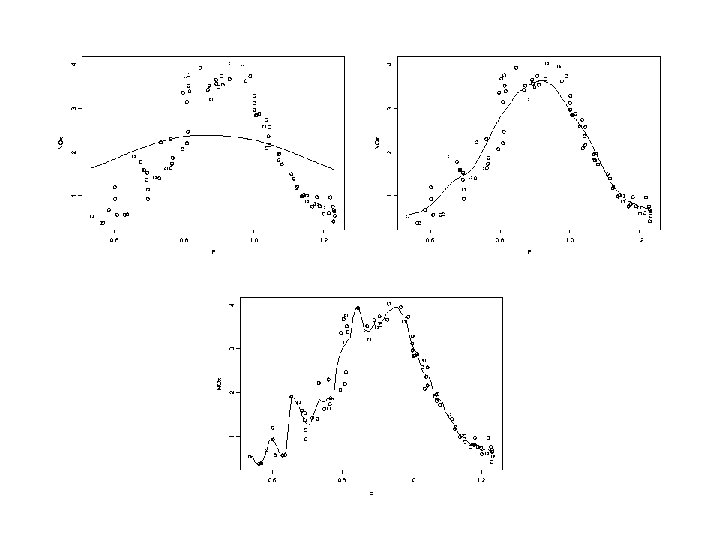
Models Prediction • Linear regression • Piecewise linear • Nonparamatric regression Probability Distributions Structured Data
Models Prediction • Linear regression • Piecewise linear • Nonparametric regression • Classification Probability Distributions Structured Data logistic regression naïve bayes/TAN/bayesian networks NN support vector machines Trees etc.
Models Prediction • Linear regression • Piecewise linear • Nonparametric regression • Classification Probability Distributions • Parametric models • Mixtures of parametric models • Graphical Markov models (categorical, continuous, mixed) Structured Data
Models Prediction • Linear regression • Piecewise linear • Nonparametric regression • Classification Probability Distributions • Parametric models • Mixtures of parametric models • Graphical Markov models (categorical, continuous, mixed) Structured Data • Time series • Markov models • Mixture Transition Distribution models • Hidden Markov models • Spatial models
Markov Models First-order: e. g. : g linear standard first-order auto-regressive model y 1 y 2 y 3 y. T
First-Order HMM/Kalman Filter y 1 y 2 y 3 y. T x 1 x 2 x 3 x. T Note: to compute p(y 1, …, y. T) need to sum/integrate over all possible state sequences. . .
Bias-Variance Tradeoff High Bias - Low Variance Score function should embody the compromise Low Bias - High Variance “overfitting” - modeling the random component
The Curse of Dimensionality X ~ MVNp (0 , I) • Gaussian kernel density estimation • Bandwidth chosen to minimize MSE at the mean • Suppose want: Dimension 1 2 3 6 10 # data points 4 19 67 2, 790 842, 000
Patterns Local Global • Clustering via partitioning • Outlier detection • Hierarchical Clustering • Changepoint detection • Mixture Models • Bump hunting • Scan statistics • Association rules
Scan Statistics via Permutation Tests xx x x xxxxx x x xxxxx The curve represents a road Each “x” marks an accident Red “x” denotes an injury accident Black “x” means no injury Is there a stretch of road where there is an unusually large fraction of injury accidents? xxx x x
Scan with Fixed Window • If we know the length of the “stretch of road” that we seek, e. g. , we could slide this window long the road and find the most “unusual” window location xx x x xxxxx x x xx x x
How Unusual is a Window? • Let p. W and p¬W denote the true probability of being red inside and outside the window respectively. Let (x. W , n. W) and (x¬W , n¬W) denote the corresponding counts • Use the GLRT for comparing H 0: p. W = p¬W versus H 1: p. W ≠ p¬W • lambda measures how unusual a window is -2 log l here has an asymptotic chi-square distribution with 1 df
Permutation Test • Since we look at the smallest l over all window locations, need to find the distribution of smallest-l under the null hypothesis that there are no clusters • Look at the distribution of smallest-l over say 999 random relabellings of the colors of the x’s xx x xxx … x x xx xx x x xx x smallest-l 0. 376 0. 233 0. 412 0. 222 • Look at the position of observed smallest-l in this distribution to get the scan statistic p-value (e. g. , if observed smallest-l is 5 th smallest, p-value is 0. 005)
Variable Length Window • No need to use fixed-length window. Examine all possible windows up to say half the length of the entire road O O = fatal accident = non-fatal accident
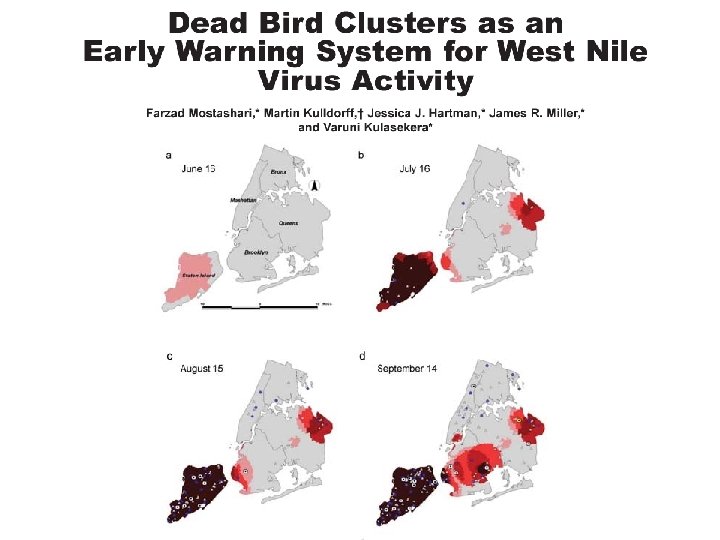
Spatial Scan Statistics • Spatial scan statistic uses, e. g. , circles instead of line segments
Spatial-Temporal Scan Statistics • Spatial-temporal scan statistic use cylinders where the height of the cylinder represents a time window
Other Issues • Poisson model also common (instead of the bernoulli model) • Covariate adjustment • Andrew Moore’s group at CMU: efficient algorithms for scan statistics
Software: Sa. TScan + others http: //www. satscan. org http: //www. phrl. org http: //www. terraseer. com
Association Rules: Support and Confidence Customer buys both Customer buys beer Customer buys diaper • Find all the rules Y Z with minimum confidence and support – support, s, probability that a transaction contains {Y & Z} – confidence, c, conditional probability that a transaction having {Y & Z} also contains Z Let minimum support 50%, and minimum confidence 50%, we have – A C (50%, 66. 6%) – C A (50%, 100%)
Mining Association Rules—An Example Min. support 50% Min. confidence 50% For rule A C: support = support({A &C}) = 50% confidence = support({A &C})/support({A}) = 66. 6% The Apriori principle: Any subset of a frequent itemset must be frequent
Mining Frequent Itemsets: the Key Step • Find the frequent itemsets: the sets of items that have minimum support – A subset of a frequent itemset must also be a frequent itemset • i. e. , if {AB} is a frequent itemset, both {A} and {B} should be a frequent itemset – Iteratively find frequent itemsets with cardinality from 1 to k (k-itemset) • Use the frequent itemsets to generate association rules.
The Apriori Algorithm • Join Step: Ck is generated by joining Lk-1 with itself • Prune Step: Any (k-1)-itemset that is not frequent cannot be a subset of a frequent k-itemset • Pseudo-code: Ck: Candidate itemset of size k Lk : frequent itemset of size k L 1 = {frequent items}; for (k = 1; Lk != ; k++) do begin Ck+1 = candidates generated from Lk; for each transaction t in database do increment the count of all candidates in Ck+1 that are contained in t Lk+1 = candidates in Ck+1 with min_support end return k Lk;
The Apriori Algorithm — Example Database D L 1 C 1 Scan D C 2 Scan D L 2 C 3 Scan D L 3
Association Rule Mining: A Road Map • Boolean vs. quantitative associations (Based on the types of values handled) buys(x, “SQLServer”) ^ buys(x, “DMBook”) ® buys(x, “DBMiner”) [0. 2%, 60%] – age(x, “ 30. . 39”) ^ income(x, “ 42. . 48 K”) ® buys(x, “PC”) [1%, 75%] – Single dimension vs. multiple dimensional associations (see ex. Above) • Single level vs. multiple-level analysis • – • What brands of beers are associated with what brands of diapers? Various extensions (thousands!)
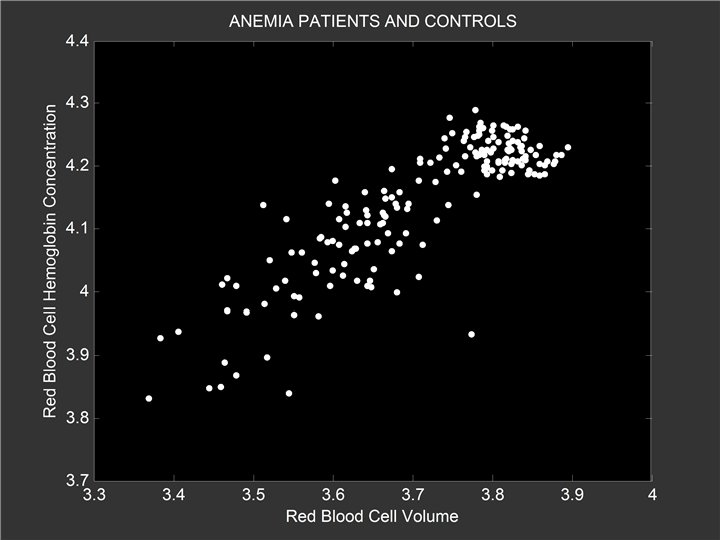
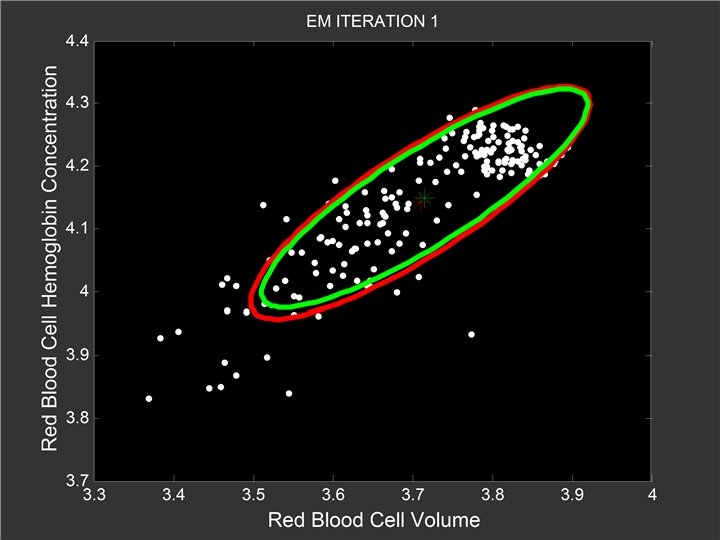
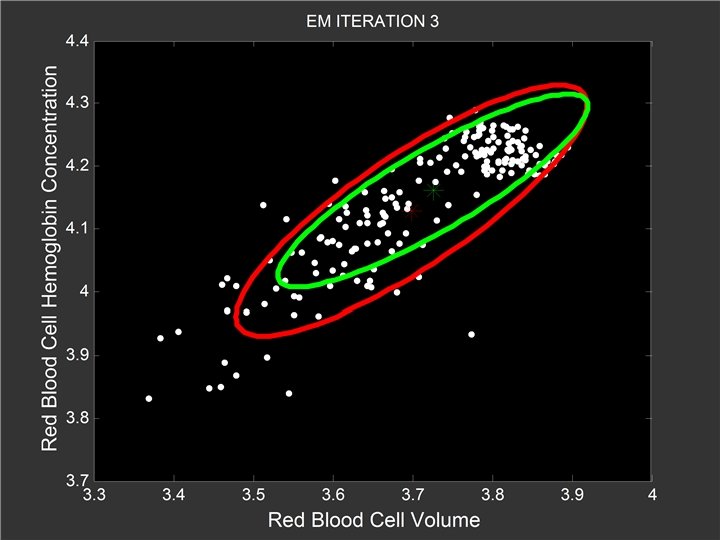
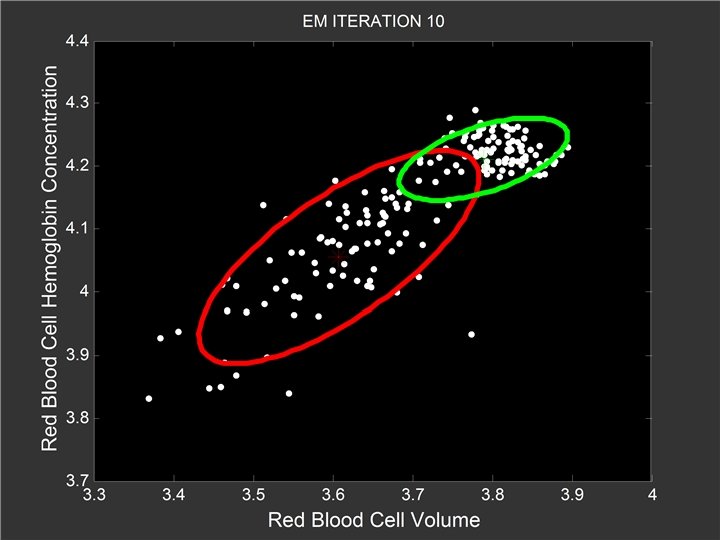
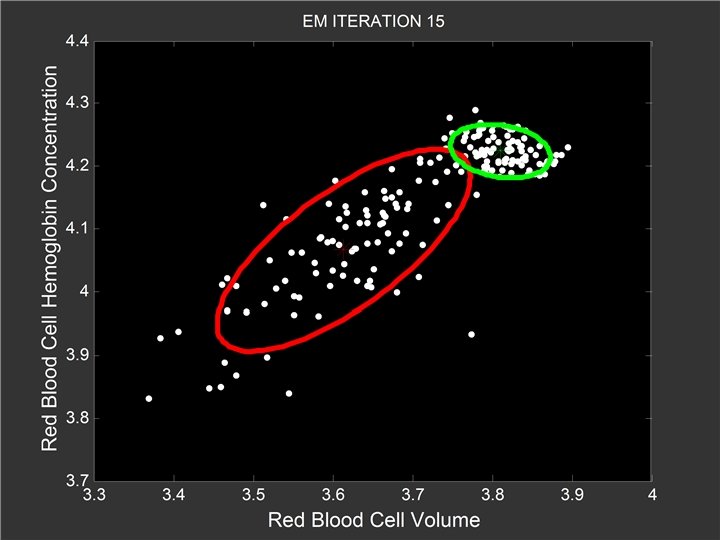
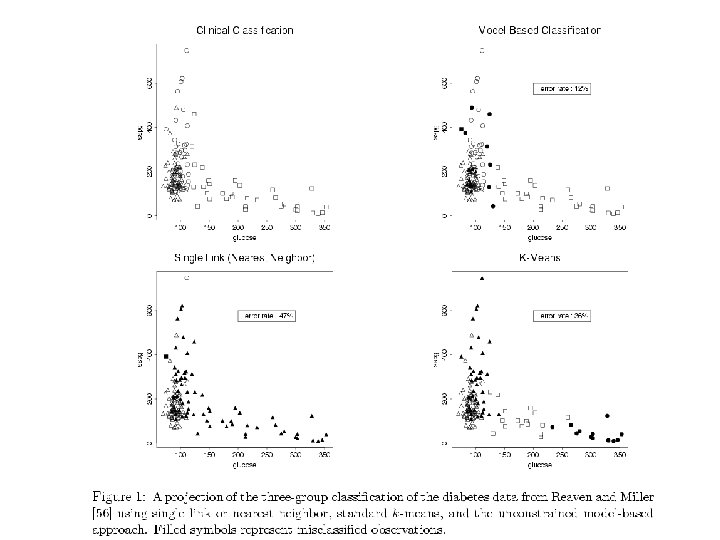
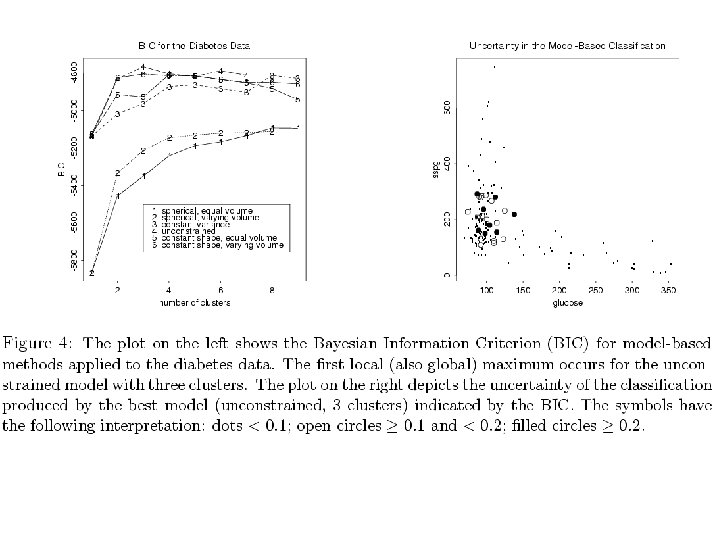
Model-based Clustering Padhraic Smyth, UCI
Mixtures of {Sequences, Curves, …} Generative Model - select a component ck for individual i - generate data according to p(Di | ck) - p(Di | ck) can be very general - e. g. , sets of sequences, spatial patterns, etc [Note: given p(Di | ck), we can define an EM algorithm]
Example: Mixtures of SFSMs Simple model for traversal on a Web site (equivalent to first-order Markov with end-state) Generative model for large sets of Web users - different behaviors <=> mixture of SFSMs EM algorithm is quite simple: weighted counts
Web. Canvas: Cadez, Heckerman, et al, KDD 2000
Discussion • What is data mining? Hard to pin down – who cares? • Textbook statistical ideas with a new focus on algorithms • Lots of new ideas too
Privacy and Data Mining Ronny Kohavi, ICML 1998
Analyzing Hospital Discharge Data David Madigan Rutgers University
Comparing Outcomes Across Providers • Florence Nightingale wrote in 1863: “In attempting to arrive at the truth, I have applied everywhere for information, but in scarcely an instance have I been able to obtain hospital records fit for any purposes of comparison…I am fain to sum up with an urgent appeal for adopting some uniform system of publishing the statistical records of hospitals. ”
Data • Data of various kinds are now available; e. g. data concerning all medicare/medicaid hospital admissions in standard format UB-92; covers >95% of all admissions nationally • Considerable interest in using these data to compare providers (hospitals, physician groups, physicians, etc. ) • In Pennsylvannia, large corporations such as Westinghouse and Hershey Foods are a motivating force and use the data to select providers.
SYSID DCSTATUS PPXDOW CANCER 1 YEAR LOS SPX 1 DOW CANCER 2 QUARTER DCHOUR SPX 2 DOW MDCHC 4 PAF DCDOW SPX 3 DOW MQSEV HREGION ECODE SPX 4 DOW MQNRSP MAID PDX SPX 5 DOW PROFCHG PTSEX SDX 1 REFID TOTALCHG ETHNIC SDX 2 ATTID NONCVCHG RACE SDX 3 OPERID ROOMCHG PSEUDOID SDX 4 PAYTYPE 1 ANCLRCHG AGE SDX 5 PAYTYPE 2 DRUGCHG AGECAT SDX 6 PAYTYPE 3 EQUIPCHG PRIVZIP SDX 7 ESTPAYER SPECLCHG MKTSHARE SDX 8 NAIC MISCCHG COUNTY PPX OCCUR 1 APRMDC STATE SPX 1 OCCUR 2 APRDRG ADTYPE SPX 2 BILLTYPE APRSOI ADSOURCE SPX 3 DRGHOSP APRROM ADHOUR SPX 4 PCMU MQGCLUST ADMDX SPX 5 DRGHC 4 MQGCELL ADDOW Pennsylvannia Healthcare Cost Containment Council. 2000 -1, n=800, 000
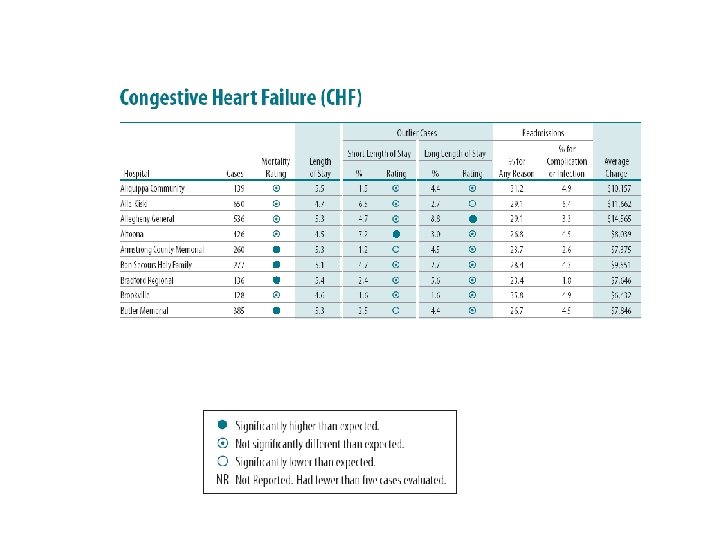
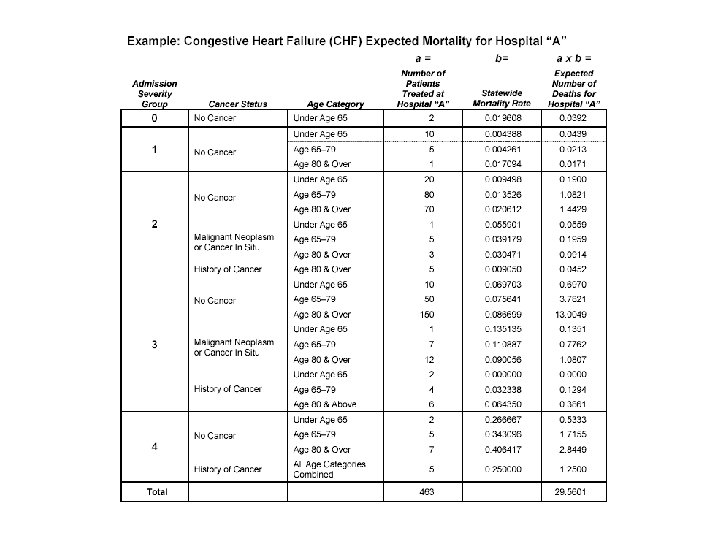
Risk Adjustment • Discharge data like these allow for comparisons of, e. g. , mortality rates for CABG procedure across hospitals. • Some hospitals accept riskier patients than others; a fair comparison must account for such differences. • PHC 4 (and many other organizations) use “indirect standardization” • http: //www. phc 4. org
Hospital Responses
p-value computation n=463; e=29. 56; p-value = suppose actual number of deaths=40 p-value < 0. 05
Concerns • Ad-hoc groupings of strata • Adequate risk adjustment for outcomes other than mortality? Sensitivity analysis? Hopeless? • Statistical testing versus estimation • Simpson’s paradox
Risk Cat. N Low A High 800 200 Rate 1% 8% Actual Number 8 16 Expected Number 8 (1%) 10 (5%) SMR = 24/18 = 1. 33; p-value = 0. 07 Low B High 200 800 1% 8% SMR = 66/42 = 1. 57; 2 64 p-value = 0. 0002 2 (1%) 40 (5%)
Hierarchical Model • Patients -> physicians -> hospitals • Build a model using data at each level and estimate quantities of interest
Bayesian Hierarchical Model MCMC via Win. BUGS
Goldstein and Spiegelhalter, 1996
Discussion • Markov chain Monte Carlo + compute power enable hierarchical modeling • Software is a significant barrier to the widespread application of better methodology • Are these data useful for the study of disease?