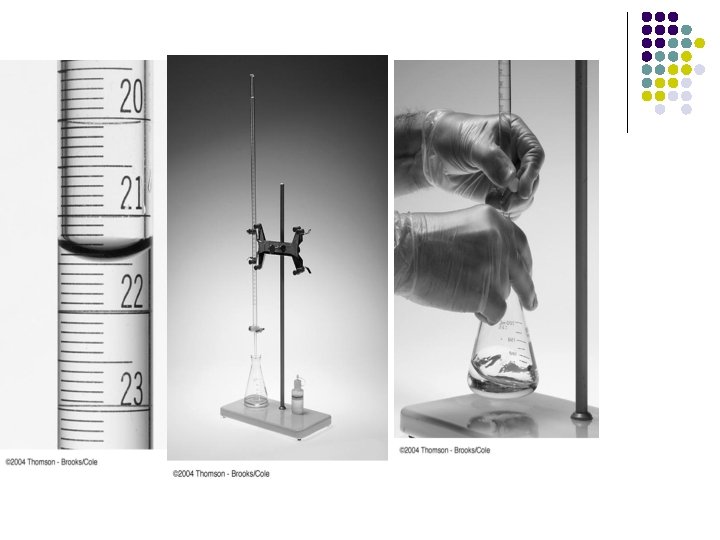
Chapter 13 Titrations Methods Precipitation Titrimetry Introduction Definition


 Differs from its volumetric counterpart in that")


 (14 -2) ; p. H (acid color )=-log(10 Ka)=PKa+1 p.")

")


- Slides: 43
Chapter 13 Titrations Methods; Precipitation Titrimetry
Introduction Definition: 1. Titrimetry: measuring the quantity of a reagent of known conc required to react with a measured quantity of sample of an unknown con. (1) Volumetric Titrimetry p. 33 involves measuring the volume of a solution of known concentration that is needed to react essentially completely with the analyte. (2). Gravimetric Titrimetry differ only in that the mass of the reagent is measured instead of its volume. ( 3). Coulometric Titrimetry: The reagent is a constant direct electrical current of known magnitude that consumes the analyte;the time required (and thus the total charge)to complete the electrochemical reaction is measured.
13 A Some General Aspects of Volumetric Titrimetry 1. Standard solution 2. It is a reagent of Known concentration that is used to carry out a titrimetric analysis. 3. 2. Equivalence point 4. It is the point in a titration when the amount of added standard reagent is exactly equivalent to the amount of analyte. 5. 3. Back titration 6. is a process in which the excess of a standard solution used to consume an analyte is determined by titration with a second standard solution. 7. 4. End point 8. It is the point in a titration at which an observable physical change signals the equivalence point. 9. 5. Titration error:Et=Vep-Veq 10. Vep:actual volume of reagent ; Veq:is theoretical volume to reach the equivalence point. 11. 6. Indicator: It is often added to the analyte solution to produce an
13 A-2 Primary Standards 1. 2. 3. 4. 5. 6. High purity (established methods for confirming purity should be available) Atmospheric stability Absence of hydrate water so that the composition of the solid does not change with variations in relative humidity Ready availability at modest cost Reasonable solubility in the titration medium Reasonably large molar mass so that the relative error associated with weighing the standards minimized
13 B Standard Solutions 1. 2. 3. 4. Be sufficiently stable so that it is only necessary to determine its concentration once React rapidly with the analyte so that the time required between additions of reagent is minimized React completely with the analyte so that satisfactory end points are realized Undergo a selective reaction with the analyte that can be described by a balanced equation
13 B Establishing the Concentration of Standard Solutions Two basic methods are used to establish the concentration of such solutions. 1. direct method: carefully weighed quantity of a primary standard is dissolved in a suitable solvent and diluted to a known volume in a volume flask. 2. Standardization: in which the titrant to be standardized is used to titrate (1) a weighed quantity of a primary standard. (2) a weighed quantity of a secondary standard (3) a measured volume of another standard solution A tirtant that is standardized against a secondary standard or against another standard solution is sometimes referred to as a secondary standard solution 3. Secondary standard solution whose concentration is determined from the stoichiometry of its reaction with a primary standard quality.
13 C Volumetric Calculations Standard solutions used in titrimetry, 1. Molarity c :the number of moles of reagent contained in one liter of solution 2. normality CN :the number of equivalents of reagent in the same volume. 13 C-1 Some useful algebraic Relationships n. A :is the amount of A m. A:is the mass of A MA:is the molar mass of A Or n. A=V ×CA
13 C-2 Calculating the Molarity of Standard Solutions Example 13 -1:Describe the preparation of 2. 000 L of 0. 0500 M Ag. NO 3 (169. 87 g /mol)from the primary standard-grade solid. Sol:amount Ag. NO 3 =V(L)×CAg. NO 3 = 2. 000 L× mass Ag. NO 3 = 0. 1000 mol Ag. NO 3×
13 C-3 Treating Titration Data We describe two types of volumetric calculations. 1. The first involves computing the molarity of solution that have been standardized against either a primary standard or another standard solution. 2. The second involves calculating the amount of analyte in a sample from titration data.
Calculating Molarities from standardization Data Ex 13 -4 A 50. 00 m. L portion of HCl solution required 29. 71 ml of 0. 01963 M Ba(OH)2 to reach an end point with bromocresol green indicator. Calculate the molarity of the HCl.
Calculating the quantity of Analyte from Titration Data Example 13 -6
EX 13 -7 A 100. 0 ml sample of brackish water was made ammoniacal , and the sulfide it contained was titrated with 16. 47 ml of 0. 02310 M Ag. NO 3. The analytical reaction is 2 Ag++S 2 -→Ag 2 S(s)
13 D Gravimetric Titrimetry Gravimetric titrimetry(weight titrimetry) Differs from its volumetric counterpart in that the mass of titrant is measured rather than the volume. weight molarity= Cw(A) =
13 D-2 Advantages of weight Titrations 1. Calibration of glassware and tedious cleaning to ensure proper drainage an completely eliminated. 2. Temperature corrections are unnecessary because weight molarity does not change with temperature , in contrast to volume molarity. 3. Weight measurements can be made with considerably greater precision and accuracy than can volume measurements. 4. Weight titrations are more easily automated than are volumetric titrations.
13 E Titration Curves in Titrimetric Methods An end point is an observable physical change that occurs near the equivalence point. The two most widely used end points involve : 1. Change in color due to the reagent. 2. Change in potential of an electrode that responds to the concentration of the reagent or the analyte.
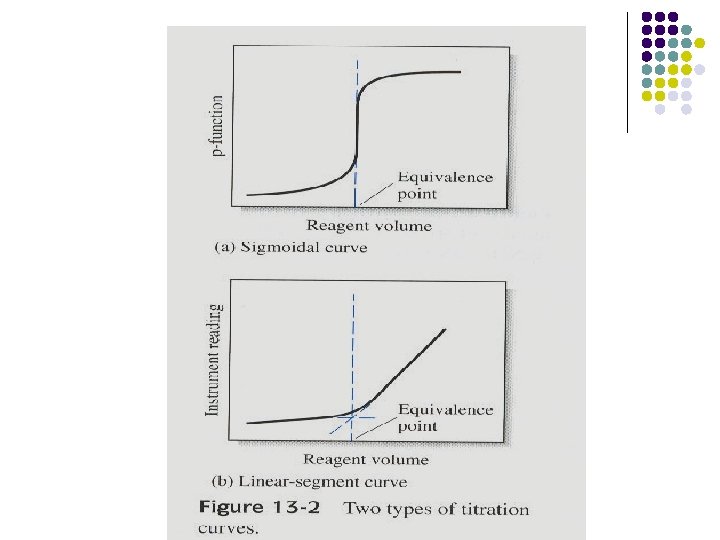
13 E-1 Types of Titration Curves are plots of a concentration-related variables as a function of reagent volume. Two types of titration curves: 1. Sigmoidal curve: p-function of analyte (or sometimes the reagent) is plotted as a function of reagent volume. 2. Linear segment curve: measurement are made on both sides of but well away from the equivalence point. (advantageous for reaction that are complete only in the presence of a considerable excess of the reagent or analyte)
13 E-2 Concentration Changes during Titration The equivalence point in a titration is characterized by major change in the relative concentrations of reagent and analyte. At the beginning of the titration described in Table 13 -1, about 41 m. L of reagent bring about a 10 -fold decrease in the concentration of A; only 0. 001 m. L is required to cause this same change at the equivalence point.
Figure 13 -3 Titration curve for the ration of 50. 00 m. L of 0. 1000 M Ag. NO 3 with 0. 1000 M KSCN.
13 F precipitation Titrimetry Precipitation titrimetry, which is based on reactions that yield ionic compounds of limited solubility , It is one of the oldest analytical techniques. Titrimetric methods based on silver nitrate are sometimes called argentometric methods.
13 F-1 Precipitation Titration Curves involving silver ion The most common method of determining the halide ion concentration of aqueous solution is titration with a standard solution of silver nitrate. To construct titration curve three type of calculation are required, each of which corresponds to a distinct stage in the reaction:(1)preequivalence, (2) equivalence, and (3)postequivalence.
Ex 13 -10:Perform calculations needed tjo generate a titration curve for 50. 0 m. L of 0. 0500 MNa. Cl with 0. 100 M Ag. NO 3(for Ag. Cl, Ksp= 1. 82× 10 -10) (1) Preequivalence –point data
The effect of Concentration on Titration curves Figur 13 -4 Titration curve for A 50. 00 m. L of 0. 0500 M Na. Cl with 0. 100 M Ag. No 3, and B 50. 00 m. L of 0. 00500 M Na. Cl with 0. 0100 M Ag. No 3. Table 13 -2
The effect of Reaction Completeness on Titration Curves Figure 13 -5 Effect of reaction completeness on precipitation curves. For each curve , 50. 00 m. L of a 0. 0500 M solution of the anion was titrated with 0. 1000 M Ag. NO 3. Note that smaller values of Ksp give much sharper breaks at the end point
13 F-2 Titration. Curves for Mixtures of Anion
13 F-2 Titration. Curves for Mixtures of Anion l l. Figure 13 -6 Titration curves for 50. 00 m. L of a solution 0. 0800 M in Cl- and 0. 0500 M in I- or Br-
13 F-3 Indicators for Argentometric Titrations 1. Three types of end points are encountered in titrations with silver nitrate(1)chemical (2)potentiometric. (3) amperometric. 2. The end point produced by a chemical indicator consists of a color change or occasionally , The requirements for an indicator for a precipitation titration are that (1)the color change should occur over a limited range in p- fruction of the reagent or the analyte. (2)the color change should take place within the steep portiion of the titration curve for the analyte.
1. Chromate ion ; The Mohr Method Sodium chromate can serve as an indicator for the argentometric determination of chloride, bromide , and cyanide ions by reacting with silver ion to from a brick-red silver chromate precipitate in the equivalence –point region. 2. Adsorption Indicators: The Fajans Method is an organic compound that tends to be adsorbed onto the surface of the solid in a precipitation titration. the adsorption occurs near the equivalence point and results not only in a color change but also in a transfer of color from the solution to the solid. (Fluorescein is a typical adsorption indicator that is useful for the titration of chloride ion with silver nitrate. ) 3. Iron(Ⅲ)Ion : The volhard Method The Volhard mithod , silver ions are titrated with a standard solution of thiocyanate ion Ag++SCN- → Ag. SCN(s) Fe 3++ SCN- → Fe. SCN 2+ The titration must be carried out in acidic solution to prevent precipitation of iron as the hydrated oxide. Ag++Cl- → Ag. Cl(s)
13 F-4 Applications of Standard Silver Nitrate solutions Table 13 -3 lists some typical applications of precipitation titrations in which silver nitrate is the standard solution.
The End
CHAPTER 14 Principles of Neutralization Titrations: Determining Acids, Bases, and the p. H of Buffer Solutions
14 A WHAT SOLUTIONS AND NDICATORS For Acid/ Base Titrations l l Standard Solutions Acid/Base Indicators Acid color Base color Acid color
Acid/Base Indicators (14 -1) (14 -2) ; p. H (acid color )=-log(10 Ka)=PKa+1 p. H (basic color )=-log(10 Ka)=PKa-1 Indicator p. H= p. Ka ± 1
What Variables Influence the Behavior of Indicators? l Temperature l Ionic Strength l Organic Solvents l Colloidal Particles p.
Fig 14 -2 Indicator color as a function of p. H (Pka=5. 0)
14 B CALCULATING p. H IN TITRATIONS OF STRONG ACIDS AND STRONG BASES
14 B-1 Titrating a Strong Acid with a Strong Base l Each calculation corresponds to a distinct stage in the titration (1)Preequivalence (2)Equivalence (3)Postequivalence
14 B-1 Titrating a Strong Acid with a Strong Base Ex. 14 -1, p. 373
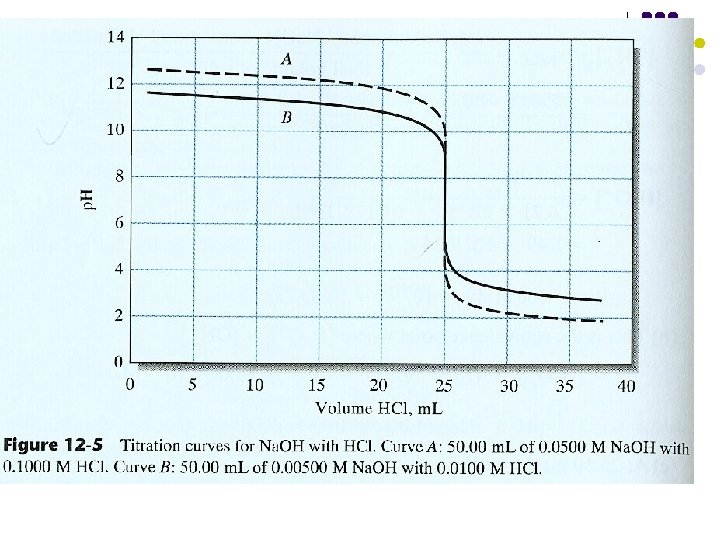
14 B-2 Titrating a Strong Base with a Strong Acid Lower conc. The change is less