The Stratiform and Convective Components of Surface Precipitation


surface rain gauge data 雨量紀錄門檻: 0. 1")


=10 m/s V(particals’ fall speed)=1 m/s")
式的q是probability distribution function(PDF),隨滯留時間τ及 取樣時間尺度δ改變 STEP: 1) Select a random τ<τmax =Δt")
")
】Total precipitation Thin line【Ps(R)】Stratiform component Bars【P’(R)】Convective")

與 頻率F(frequency)關係圖 由Pt(t)分成convective與 stratiform兩部份,再經過 fourier轉換後,所得到的累 積能譜圖")

- Slides: 23
The Stratiform and Convective Components of Surface Precipitation Andre Tremblay, 2004: The stratiform and convective components of surface precipitation. Journal of the atmospheric sciences. , 62, 15131528
對流降水與 層狀降水 出處~Robert A. Houze Jr. , 1997: Stratiform Precipitation in Regions of Convection: A Meteorological Paradox?
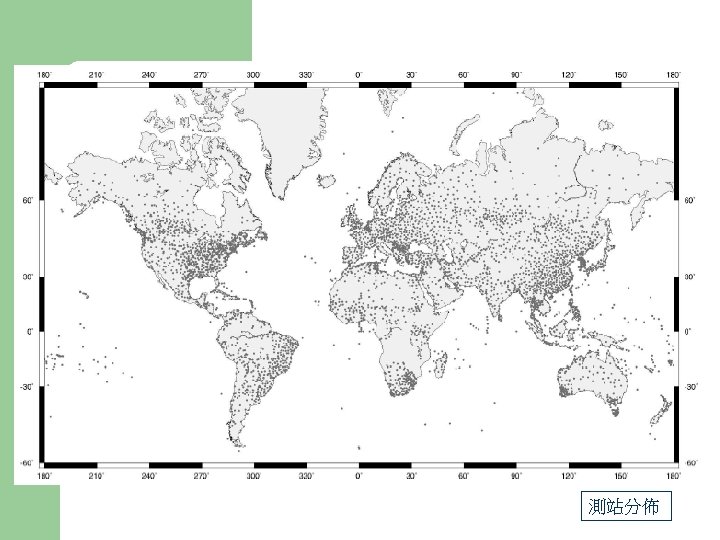
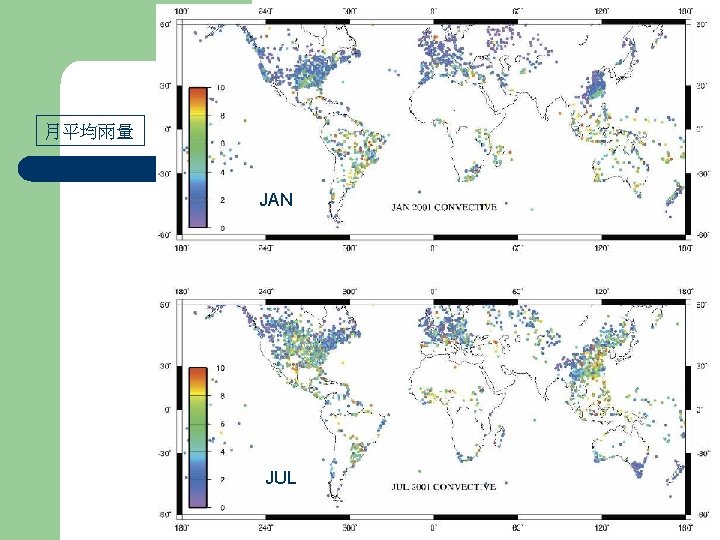
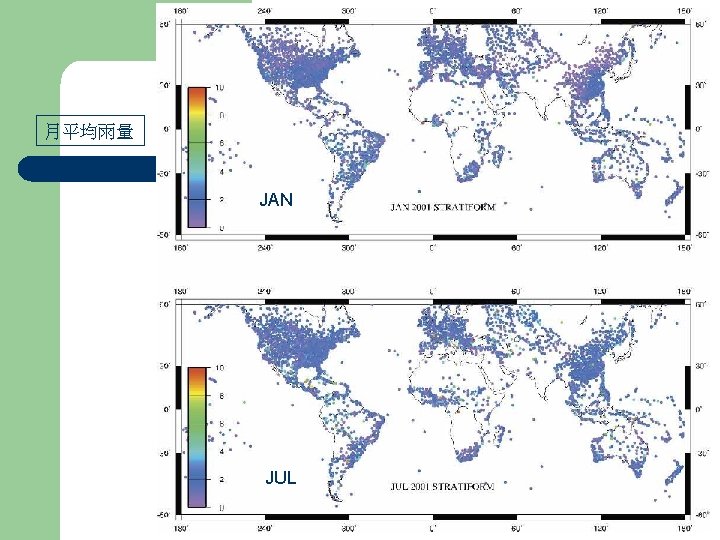
降雨資料分析 l l 來源: 2001 -WMO(World Meteorological Organization)surface rain gauge data 雨量紀錄門檻: 0. 1 mm(per 6 hour) 全球約3500個測站,每 6小時一筆資料 資料形式以R為單位(相當於precipitation intensity)
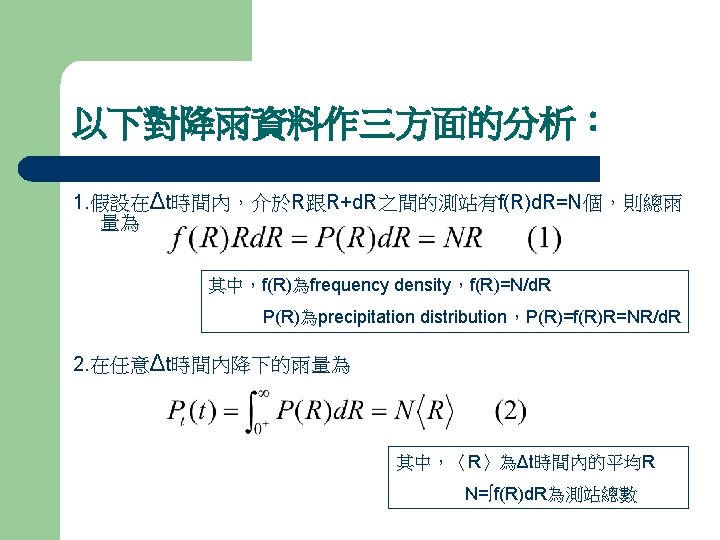
3. precipitation distribution在T時間內的time average為 也就是說,在T時間內的總雨量為
JAN 2 3 1
JUL
不同T時間內的 指數回歸式: Stratiform component Convective component
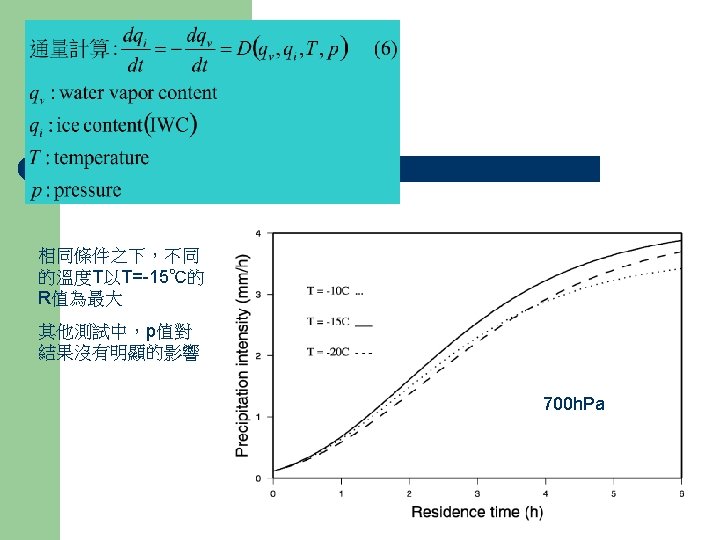
Stratiform precipitation model 基本假設: x-z plane U(horizontal air velocity)=10 m/s V(particals’ fall speed)=1 m/s Δt=6 h w(updraft intensity)<V
Monte Carlo simulation (7)式的q是probability distribution function(PDF),隨滯留時間τ及 取樣時間尺度δ改變 STEP: 1) Select a random τ<τmax =Δt distributed according to (7) 2) Calculate R(τ) from (6) 3) Repeat these steps N times 4) Obtain P(R) from (1)
Different IPSD l IPSD(ice particle size distribution)
Partition algorithm Hour 480 of July 2001 Thick line【P(R)】Total precipitation Thin line【Ps(R)】Stratiform component Bars【P’(R)】Convective component Dashed line【Rc】 Rc=20
Rc頻率分布 Rc:critical precipitation rate 2001年的Rc以 8 mm/6 h 的出現頻率為最高, 而之前提到的480 h. July-2001 case其Rc為 20 mm/6 h,因此這個 case可視為convective precipitation 2001
Cumulative power spectra CP(cumulative power)與 頻率F(frequency)關係圖 由Pt(t)分成convective與 stratiform兩部份,再經過 fourier轉換後,所得到的累 積能譜圖