Vernal Pool Workshop MiniLectures Northeast National Wildlife Refuge


")

 • Threats facing")
 Habitat Management Plan (HMP): ROCs &")


")


 In pairs or small groups, discuss the following: • Have")


 Decision-Maker (A) Management")


 Fundamental objectives What you ultimately value, regardless of")
 Objectives (what you want) Ballast water")


 • Objective can be directly measured")


 Type of attribute (natural,")


 Starting condition Past land use and management Action: burn,")


 Habitat Management Plan (HMP): ROCs &")

 Visualize the worst outcomes (red)")


 Objective Direction Attribute Worst Best")
 Objective Direction Attribute Worst Best")
 Objective Direction Attribute Worst Best")


 • Data collection (labor,")

")

 Comprehensive Conservation Plan (CCP) Habitat")
 • Threats facing")

- Slides: 97
Vernal Pool Workshop Mini-Lectures Northeast National Wildlife Refuge System Division of Natural Resources and Conservation Planning Inventory and Monitoring Initiative February 5 -7, 2019, Regional Office, Hadley, MA
Welcome & Goals
Introductions and Housekeeping • Name, Affiliation • What are your hopes and dreams? • Safety/Exits • Group dinner tonight? • Google drive = “Vernal Pool - SDM Workshop 2019” • Group presentations Thursday - open? • Meeting ground rules
Why are we here? • Conservation Crisis • • USGS NEARMI long-term monitoring (10+years) Declines of vernal pool amphibians across NE NWRs are not “protected” Protection policies may not be sufficient Few actions being taken on the ground Rare vernal pool communities Unknown impacts on at-risk species (turtles) • Strategic Habitat Conservation Planning • • • Resources of Concern (ROCc) Habitat Management Plans (HMPs) Emerging threats (climate, disease) New biologists/staff Inventory and Monitoring (IMPs) • long-term monitoring vs. • targeted monitoring to inform mgt
Workshop Goals • Increase understanding of vernal pool ecology and management concerns on NWRs • Understand how to use decision processes (SDM/Road. Map) to build foundational elements for HMPs and IMPs • HMP: ROCs, Objectives, Strategies • IMP: Inventory, Monitoring, Research • Increase communication and collaboration among partners to solve vernal pool management problems
What does success look like? • Important vernal pool characteristics (metrics) • Threats facing vernal pool communities • Potential actions and their effects • Effects of current (non-vernal pool focused) mgt • The role of each refuge in the larger landscape • A strategic plan for vernal pool conservation • Management objectives for each refuge • A framework for decision-making • A framework for monitoring
Overview of structured decision-making Comprehensive Conservation Plan (CCP) Habitat Management Plan (HMP): ROCs & SMART Objectives HMP Strategies Inventory and Monitoring Plan (IMP)
Keeney 2004
Why is your problem “hard”? = select the right decision tool Problem Type Example Multiple Objective trade-offs are hard, can’t have it all Portfolio too many options, intractable combinations Information Needs too many unknowns to begin thinking about the problem, lots of “i don’t knows” Uncertainty too many “what ifs”, “it depends”, and “maybes” Prediction lots of variation and possible outcomes, a quantitative model is needed Dynamic iterative; timing and order matters
Workshop Agenda Day 1 Day 2 Day 3 0800 -0900 Next Steps 0900 -1030 NWRS Meeting 1030 -1230 PPTs/Lessons Learned
I&M Foundation “Road Map” for Designing Biological Monitoring Reynolds, Knutson, Newman, Silverman, & Thompson. 2016. Phase 1: Frame the Problem Objectives (CCP/HMP) Conceptual Model Actions & Strategies (HMP) Phase 2: Design Monitoring Decide on Approach (IMP) Attributes & covariates Write Protocol: Sampling Design Data Management Data Analysis & Reporting Phase 3: Implementation Collect Data Analyze Data Update Predictions
Workshop Format For each Pr. OACT step: • Learn concept (15 -30 min Lecture) • Apply to each refuge (1 -hr Breakout Teams) • Share insights (15 -30 min Group Discussion) • Repeat Breakout Teams (1 for each refuge): 1. Refuge Experts (1 -2 per team) 2. Ecological Experts (2 -3 per team) 3. SDM/Facilitators (1 per team)
Breakout Teams Canaan Valley NWR Refuge: Dawn & Kristin Expert: Jeff, Adrianne & Courtney SDM Facilitator: Erin Eastern Mass NWR Complex Refuge: Stephanie Expert: Laura E, Jill & Brittney SDM Facilitator: Becky USGS Trends: SS & WF declines HMP Status: 2017 IMP Status: None USGS Trends (ASB): SS & WF declines HMP Status: None IMP Status: None Umbagog NWR Refuge: Sean Expert: Evan & Nate SDM Facilitator: Troy (Evan) Patuxent Research NWR Refuge: Sandy Expert: NA SDM Facilitator: NA USGS Trends: WF Stable HMP Status: 2010 IMP Status: None USGS Trends: SS & WF declines HMP Status: None IMP Status: 2018 *Folks may need to move among teams to provide expertise
Defining the Problem
What is a Problem Statement? • Agreement on the problem or question is an essential, but often overlooked step. • Well-defined problems include information on scope, decision-makers, constraints, and stakeholders. • Monitoring must address information needs, be relevant for decision makers, and take into account changing budgets and staff. • If I had only one hour to solve a problem, I would spend 40 -min defining what the problem is. ” unknown
Example “Our roads are being flooded and something must be done! We never used to have beaver here, now they’re everywhere! Why can’t the refuge create a bounty on beaver pelts, of $25 or $50 dollars? ” What’s the Problem? • • Too many beavers? Not enough interest in trapping? Refuge management is impeding water? Water on township roads
Pulse Check (5 -min) In pairs or small groups, discuss the following: • Have you encountered a monitoring project where the problem or management objectives were unstated or unclear? • What were the consequences of poorly defining the problem or objectives?
Problem Statement Anatomy • Trigger – What triggered the problem? Why does a decision need to be made? • Action – What is the decision? What action(s) are being considered? (remember: no action is a decision) • Frequency & Timing – When and how often will the decision be made? Are other decisions linked to this one? • Scope and Scale – How large, broad, complicated is the problem/decision? Where is the area of concern? • Constraints – Legal, financial, political. Are these perceived or real constraints? (be creative) • Uncertainty – What degree of uncertainty is present? Does it matter to the decision? Which uncertainties can be ignored?
Problem Statement Template “A wants to do X to achieve Y over time Z in place W considering B and uncertainty in C. ” • A = Decision maker in charge of the decision • X = Action statement that indicates the scope of resources to be allocated • Y = Ultimate goal(s) to be achieved by doing “X” • Z = Temporal extent of the decision (planning horizon) • W = Spatial extent of the decision (refuge, mgt unit) • B = Potential constraints (legal, financial, and political) • C = Critically important uncertainties
Refuge Breakout Goals: Components: ● ● ● ● ● Trigger (T) Decision-Maker (A) Management Goal (Y) Action (X) Frequency & Timing (X) Geographic Scope (W) Temporal Scope (Z) Constraints (B) Key Uncertainty (C) Statement: “Due to T, A wants to do X to achieve Y over time Z in place W considering B and uncertainty in C. ” Why is the problem hard?
Setting Objectives
Where do you want to go?
Why are objectives important? • Objectives are crucial because they drive everything in a habitat management and monitoring program • Objective hierarchies can help further clarify the problem • Well stated objectives can be translated into measurable attributes and inform protocol development
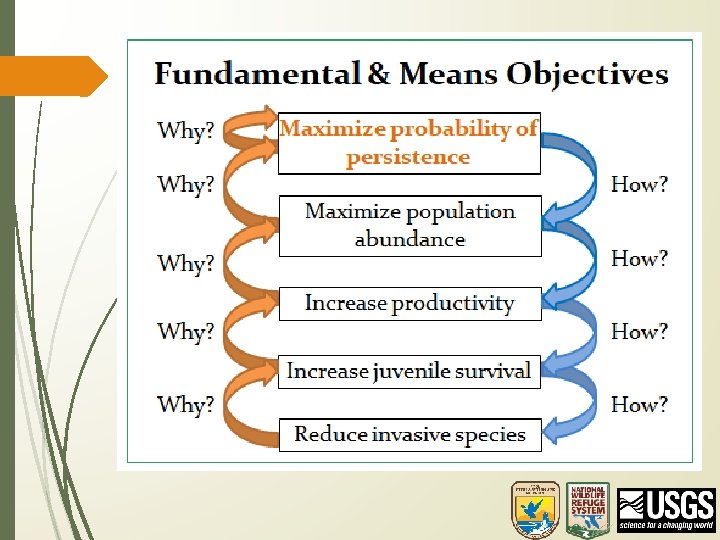
Objective Hierarchy (all go into HMP) Fundamental objectives What you ultimately value, regardless of whether or not you can measure it. Why do you want that? Just because…. How do I achieve this? Means objectives Why is this important? Describes ‘how’ you can achieve the fundamental objective. Can be measured (e. g. population, habitat, abiotic) Attributes One or more characteristic of the system you plan to measure to meet your objective. e. g. species abundance, body How do I condition, native species diversity index, etc. know?
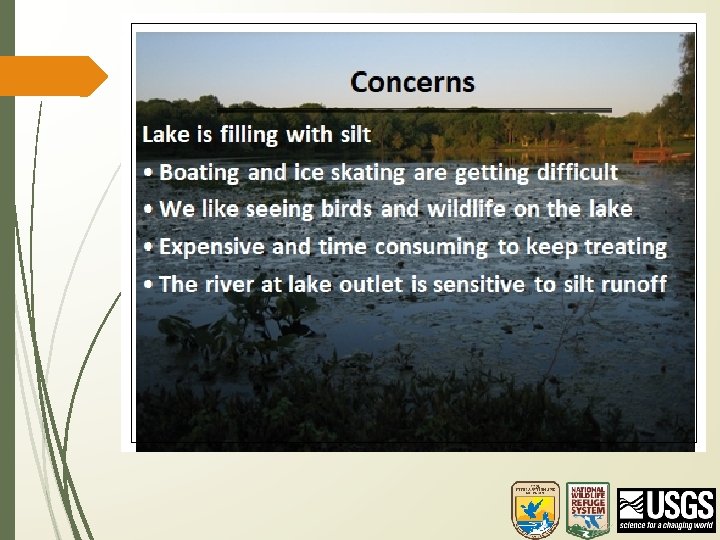
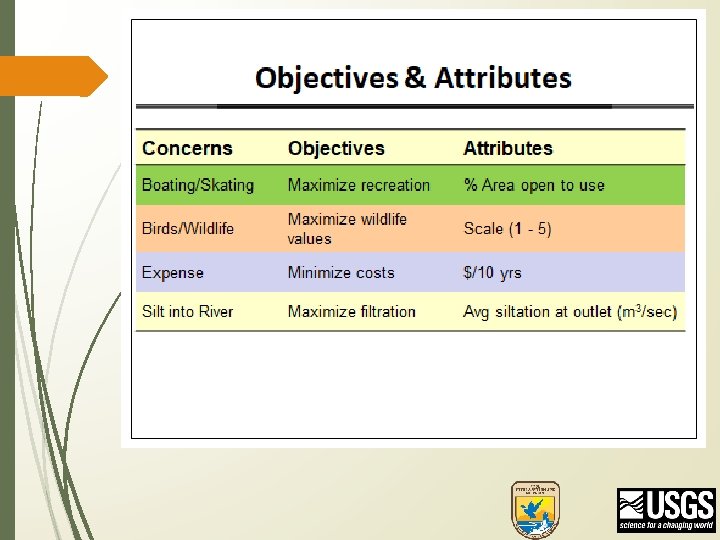
Convert concerns to objectives Concern (what you hear) Objectives (what you want) Ballast water brings in invasive species Minimize establinew invasive species Maximize native species richness We could never afford that Minimize cost Maximize outcomes per $ The public will never support this Maximize public support Maximize habitat quality
Other types of objectives e. g. population persistence e. g. abundance & distribution e. g. refuge support e. g. public awareness
Each objective is described by 1 or more attributes. Attribute: • Content (what you’ll measure) • Preferred direction of the measured content • The aspiration • • • maximize (or minimize) an absolute threshold level a particular level of change (rate of change) Example: Means obj - establish a reproducing plant pop • 3 -year mean flowering stem density (stems/m 2) • Increase (more is better) • Maximize (or Threshold > 100 stems/m 2)
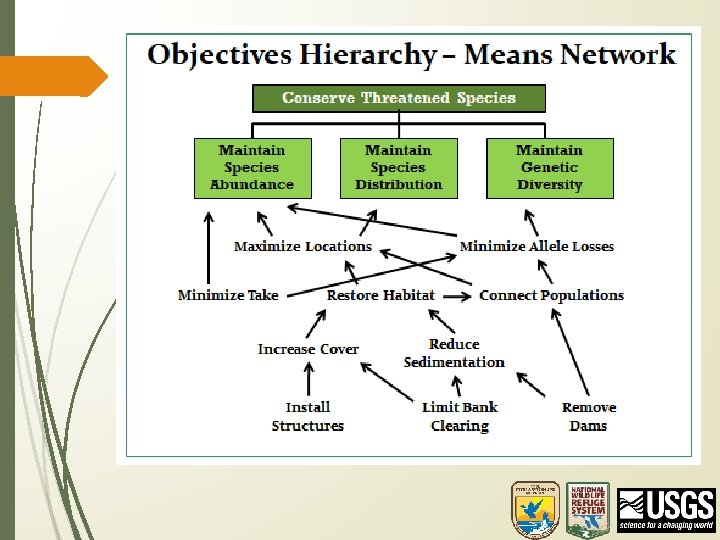
Objective Hierarchy
Example Tear et al. 2005
Example Smith et al. 2015
What makes a good attribute? • Direct – Clearly related to objective of interest • Understandable - Readily understood and easily communicated (by those estimating/ predicting them and by the decision makers using them to make an informed choice) • Operational - Suitable information available; can be predicted from data or experts • Comprehensive - Covers full range of possible consequences (responds to actions)
NWRS’s attributes are. . .
Types of attributes • Natural attributes (most preferred) • Objective can be directly measured • Proxy attributes • Natural attribute that is highly correlated with the objective, but does not directly measure it • Constructed attributes (least preferred) • • • Sliding or relative scale Does not need to be linear Requires interpretation and clear definitions
Practice! What type of attributes are these? Minimize employee sick days → # of sick days Maximize popcorn sales → $ of sales Maintain reproductive success → # of fledglings What type of attributes are these? Minimize Nate’s boredom → # of yawns Maintain genetic diversity → % of natural range preserved Maintain reproductive success → # of acres of nesting habitat
Example: Hines emerald dragonfly
Evaluating Attributes Objective: Salamander Persistence Criteria (e. g. ensure SMARTness) Type of attribute (natural, proxy, constructed) Measurement (abundance, reproduction, occupancy, percent, height, depth, composition) Attribute directly represents objective (1 = yes, 2, 3) Attribute represents a field “standard” (1, 2, 3) Attribute response to management actions (1, 2, 3) Response has no lag or well-understood lag (1, 2, 3) Attribute is insensitive to other factors (or relationship is well understood) (1, 2, 3) High quality measurement (easy to implement) (1, 2, 3) Measurement is cost effective (cheap) (1, 2, 3) Important covariates/drivers are easy to measure (1, 2, 3) Option A Option B Option C proxy constructed # ponds with egg mass counts # ponds with adult frog calls average pool habitat quality index
Fundamental Objective Means Objective Attributes Translating into HMP Objectives Barrier Beach and Dune Habitat on Chincoteague NWR DRAFT Allow natural processes and functioning of at least [## acres (or proportion of available considering acreage changes or beach miles? )] sandy beach and dune habitat on Assateague, Assawoman, Metompkin, and Cedar Islands to sustain habitat quality for federally listed endangered and threatened species (i. e. , seabeach amaranth, piping plover, least tern, red knot, and loggerhead sea turtle) and other species of conservation concern. Sandy beach and dune habitat will have the following attributes: • • Areas of wide (generally no less than/up to # feet? ), open sand, above moon and mean high tide elevations with the continual deposition and erosion of sand due to natural geological processes during the months of April through July. A wrackline consisting of a variety of vegetation (e. g. , seaweeds, eel grass) at the mean high tide line during March through September. Permanent dunes heavily vegetated (percent range? ) with beach grass and forbs with scattered small clumps of beach grass at the tow of the dunes. At least one seabeach amaranth population of at least five plants per linear mile at the north end of Wild Beach for 10 consecutive years will be maintained, with zero losses due to human-caused disturbance or herbivory. At least 131 pairs of nesting piping plovers, with a productivity of more than 1. 2 chicks per pair as averaged over a 10 -year period and with zero mortality during active breeding season due to humancaused disturbance or predator-related causes. All loggerhead sea turtle nests will be protected in situ, with zero mortality of nesting or hatchling sea turtles due to human-caused disturbance or predator-related causes. Areas for migrating and wintering shorebirds (e. g. , red knot, least terns, sanderlings) that are free of humancaused disturbance.
Refuge Breakout Goals Create an objective hierarchy: • Fundamental • Means Identify potential attributes for each objective: • content (measurement - be specific!) • direction (increase, decrease) • aspiration (max, min, threshold) Translate into HMP objective • as needed, but after workshop
Conceptual Model
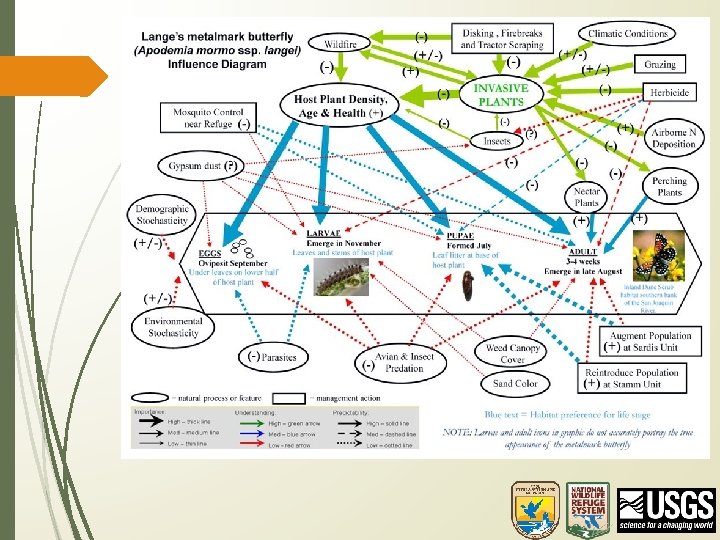
Conceptual Models • What’s a conceptual model? • What’s an influence diagram and how do I construct one? • Why should I bother with pictures and diagrams?
What is a conceptual model? • A visual depiction of a shared understanding of key components of a system and driving factors • Helps make predictions (thus decisions) about how (stressors, management actions, policy) may impact objectives • Provides a foundation for building qualitative and quantitative models • Illustrates where monitoring is expected to improve understanding
So many kinds! Go with your gut. . .
Using Miradi
Salamander and Bsal
“All models are wrong, some are useful. ” - George Box Influence diagrams: A graphical representation of a problem that depicts our current understanding of the drivers and decisions (actions) that influence the outcomes (objectives) of interest.
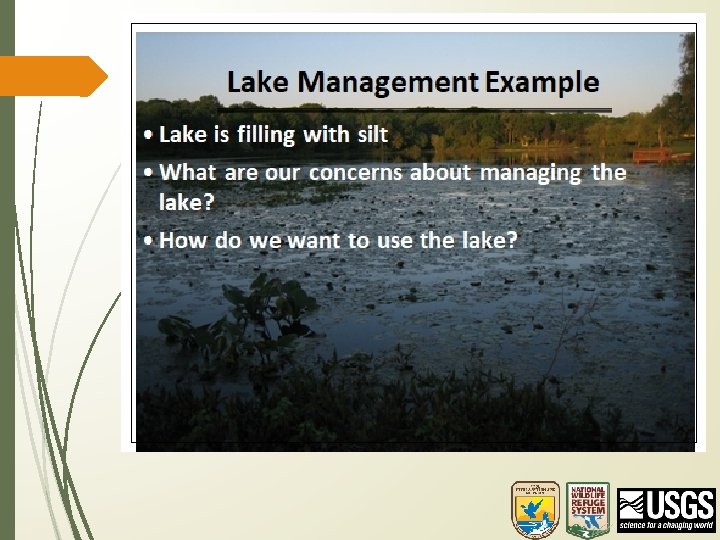
Example Starting condition Past land use and management Action: burn, graze, rest, combo Disturbance (defoliation) frequency and intensity Field size & landscape context Adjacent land uses Weather & Climate Objective: High quality prairie Pollinators Hydrology Soils
Constructing an influence diagram • Pick one objective to focus on • Brainstorm the most important limiting factors • • demographic: recruitment, survival, movement habitat: quality vs. quantity vs. distribution • Identify major threats to each limiting factor • • environmental: climate, abiotic biological: disease, predation chemical: soil, water quality human: roads/trails, poaching, forest mgt • What external drivers are outside our control? • • • climatic land conversion / use emerging diseases
Use different symbols (4 types) Starting condition Past land use and management Action: burn, graze, rest, combo Disturbance (defoliation) frequency and intensity Field size & landscape context Adjacent land uses Weather & Climate Objective: High quality prairie Pollinators Hydrology Soils
Refuge Breakout Goals Create a conceptual model • • Objectives Limiting Factors and Threats External Drivers Symbols: • • • objective = hexagon can influence = rounded box cannot influence = circle Identify uncertain linkages • Bold lines = important linkage, big effect • Dashed lines = uncertain linkage or effect
https: //www. fws. gov/policy/601 fw 3. html
Alternative Actions
Creating management actions • The best thing that can be done is only as good as the best option we come up with! • Creating alternative actions helps us to better understand our objectives • When all options are explored, people are more willing to make difficult choices • Don’t dismiss options too early (due to perceived feasibility, cost, or effectiveness)
Use your conceptual model! Action: burn, graze, rest, combo Starting condition Past land use and management Action: outreach to partners (encourage plantings) Action: sow native perennials Disturbance (defoliation) frequency and intensity Field size & landscape context Adjacent land uses Weather & Climate Objective: High quality prairie Pollinators Hydrology dashed lines = uncertain linkages Soils
Use your conceptual model! bold lines = big influence Whooping crane model for Necedah NWR
Satisfied? Improving your options. . . • Focus on fundamental objectives • Address conflicting objectives • Challenge apparent constraints • Visualize – diagrams • Create portfolios or strategy tables • Revisit objectives • Include “outsider“ views
Creating Portfolios of Actions Decision: Which species to target? Options: A, B, A + B, etc. Portfolio: combinations of distinct species
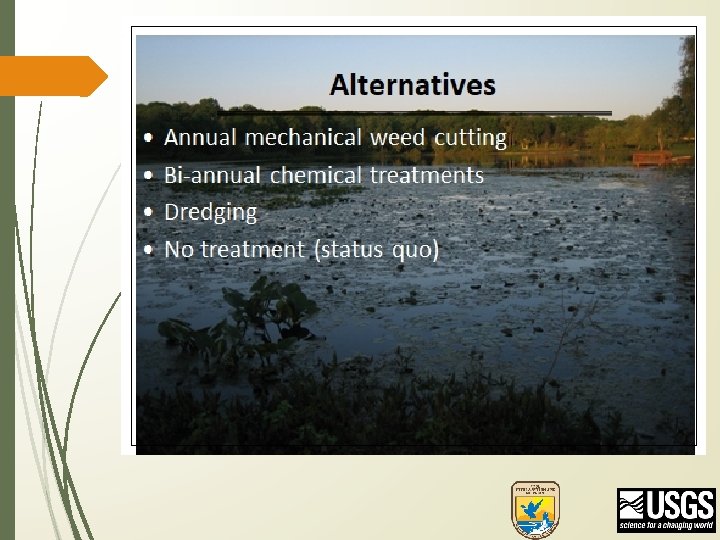
Strategy Table Example • Identify “themes” of actions from your list • Group actions under each theme • Create a “shopping list” to pull from Habitat management actions Predator control actions Enhance population actions Status quo None Ban logging in a critical habitat Reduce predators by 10% Captive Breeding Enhance corridor habitat Reduce predators by 50% Translocate Individuals *Note these could all be listed as strategies in Chapter 4 of the HMP, but you may still need to decide which ones to implement given available resources.
Create a Strategy Table • Pick 1 or more actions to represent a management strategy Habitat management actions Predator control actions Enhance population actions Status quo None Ban logging in a critical habitat Reduce predators by 10% Captive Breeding Enhance corridor habitat Reduce predators by 50% Translocate Individuals • “Maintain Population Strategy”
Create a Strategy Table • Pick 1 or more actions to represent a management strategy Habitat management actions Predator control actions Enhance population actions Status quo None Ban logging in a critical habitat Reduce predators by 10% Captive Breeding Enhance corridor habitat Reduce predators by 50% Translocate Individuals • “Enhance Movement Strategy”
Create a Strategy Table • Pick 1 or more actions to represent a management strategy Habitat management actions Predator control actions Enhance population actions Status quo None Ban logging in a critical habitat Reduce predators by 10% Captive Breeding Enhance corridor habitat Reduce predators by 50% Translocate Individuals • “Increase Population Strategy”
Build distinct options to evaluate Habitat protection action Predator control action Enhance population action Maintain Population Strategy Status quo Harvest None Enhance Movement Strategy Develop linkage corridors Reduce predators by 10% Translocate Increase Population Strategy Ban logging in critical habitat Reduce predators by 50% Captive breeding Strategy
Avoiding “analysis paralysis” • What’s the worst thing that would happen if • • you did nothing (or status quo) for 15 -years? you took action tomorrow? • If you could know 5 factors perfectly (no uncertainty in their influence), which ones would help you decide among actions? • What is the true cost of waiting (how much better would our decision/objective be if we waited to learn about all the factors)?
Refuge Breakout Goals Identify potential actions • Place actions onto your conceptual model • Identify the pathway from each action to objective (this is called a “result chain”) • Develop themes for groups of actions • Create 4 -6 Alternatives/Strategies • • Portfolios Strategy Table
Predicting Consequences
Overview of structured decision-making Comprehensive Conservation Plan (CCP) Habitat Management Plan (HMP): ROCs & SMART Objectives HMP Strategies Inventory and Monitoring Plan (IMP)
Predicting Consequences • Models are used to predict what will happen • Do not need to be complex (just complex enough to meet needs for the decision and no more) • Should be explicit and transparent • Uncertainties are captured • Decision-specific • • • Inputs based on alternative actions Outputs based on objectives Uncertainty based on conceptual model
Visualize the best outcomes (green) Visualize the worst outcomes (red)
Consequence Tables • A lot of information in concise & orderly format • Easy to compare alternatives, objective by objective • Simple communication tool to managers • Initial framework for assessing tradeoffs • Parameterize using expert opinion • Use simple simulations to estimate “mean” expected outcomes (and range) • Use ‘hard data’ to estimate effects in the past (use as baseline for future effects)
Trade-off Analysis
Trade-off Analysis
How do we account for relative importance? (swing weighting) Objective Direction Attribute Worst Best Rank Score Weight Outcom e e Recreation Max % Open 5 50 2 Wildlife Max 1 -5 scale 3 4 -5 1 Cost Min $/10 yrs 50 K 0 K Filtration Min Avg silt 4. 0 0. 5 4 3 • • Imagine the worst outcomes are all true! Which objective would you “swing” from worst to best outcome first? rank = 1 Which would you swing next? rank = 2 Continue until all are ranked
How do we account for relative importance? (swing weighting) Objective Direction Attribute Worst Best Rank Score Weight Outcom e e Recreation Max % Open 5 50 2 50 Wildlife Max 1 -5 scale 3 4 -5 1 100 Cost Min $/10 yrs 50 K 0 K 4 5 3 30 Filtration Min • • Avg silt 4. 0 0. 5 rank 1 = 100 score How much less do you care about swinging “ 2” compared to “ 1”? Half as much? Use full scale from 1 to 100 if possible
How do we account for relative importance? (swing weighting) Objective Direction Attribute Worst Best Rank Score Weight Outcom e e Recreation Max % Open 5 50 2 50 0. 27 Wildlife Max 1 -5 scale 3 4 -5 1 100 0. 54 Cost Min $/10 yrs 50 K 0 K Filtration Min • • • Avg silt 4. 0 0. 5 0. 03 4 5 3 30 185 0. 16 1. 00 sum scores across all objectives (total = 185) calculate weights (score 50 / total 185 = 0. 27) for each multiple outcomes by how much you care about each (weights) = expected happiness/utility
Trade-off Analysis w = 0. 27 w = 0. 54 w = 0. 03 w = 0. 16
How do we make the predictions? • Build a qualitative or quantitative model: • Decision Trees • Occupancy Models • Population Models • Habitat Models • Bayesian Beleif Networks • Sources of information: • theoretical relationships • published literature values • meta-analysis • expert opinion
Predict conceptual model linkages What other types of relationships are missing?
Predict conceptual model linkages uncertainty increases
Bayesian Belief Networks e. g. Wood frog persistence Smalling et al. In Review
Refuge Breakout Goals Draw linkages • Pick 1 objective • Draw the relationship between each node until you reach the action node Develop a consequence table • • Use qualitative (-, 0, +) Use quantitative (numbers) Green = best outcomes Red = worst outcomes Find solution • Swing-weighting
Monitoring Needs
The role of monitoring • What is NOT monitoring? • Inventory, Research, Reconnaissance • What is monitoring? • Understand the system - Status & Trends Monitoring • Decide when to act - Threshold Monitoring • Assess outcome of an action - Effectiveness Monitoring • Assess multiple possible actions, and choose next action - Adaptive Management Monitoring • Choice of monitoring should be catered to address your problem!
Monitoring requires capacity, so choose wisely! • Scientific oversight (scientist) • Data collection (labor, training, travel, supplies) • Data management (data manager) • Data analysis and reporting (statistician) • Administration (manager) • Other – equipment depreciation (vehicles) • When should we do research vs. monitoring vs. inventory?
Why is your problem “hard”? = select the right decision tool Problem Type Example Multiple Objective trade-offs are hard, can’t have it all Portfolio too many options, intractable combinations Information Needs too many unknowns to begin thinking about the problem, lots of “i don’t knows” Uncertainty too many “what ifs”, “it depends”, and “maybes” Prediction lots of variation and possible outcomes, a quantitative model is needed Dynamic iterative; timing and order matters
Qualitative Needs Assessment (e. g. Bsal proactive management in the US)
Wrap Up / Next Steps
What steps need re-visiting? (rank them 1 to 5) Comprehensive Conservation Plan (CCP) Habitat Management Plan (HMP): ROCs & SMART Objectives HMP Strategies Inventory and Monitoring Plan (IMP)
What does success look like? • Important vernal pool characteristics (metrics) • Threats facing vernal pool communities • Potential actions and their effects • Effects of current (non-vernal pool focused) mgt • The role of each refuge in the larger landscape • A strategic plan for vernal pool conservation • Management objectives for each refuge • A framework for decision-making • A framework for monitoring
Next Steps and Timelines Rachel: DNRCP: Refuge Biologists: USGS: