Tanya Morret Using PVAAS for Gifted Learners Learning




- Slides: 81
Tanya Morret Using PVAAS for Gifted Learners
Learning Outcomes • How effectively is our system meeting the needs of our advanced learners? • Are we projected to grow our advanced learners? • How can we use PVAAS to inform the decisions we make regarding Chapter 16?
Background Knowledge • How many have been to a training in past years on PVAAS? • How many have been trained at their IU on PVAAS this year? • How many have had access to PVAAS prior to this school year? • How many have first time access to PVAAS?
What is PVAAS? • Value-added tool that reports growth of cohorts of students and projections for individual students for performance on future PSSAs
Why use PVAAS? • Monitors annual progress of all students • Measures impact of our system • Allows for data based decision making at many levels • Tells you the what, not the why • Inspires questions, provides few answers • Offers opportunities to replicate success/avoid failure
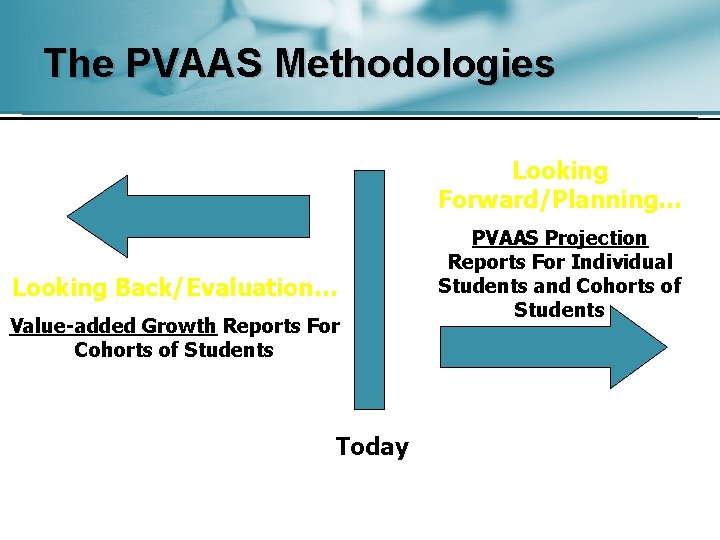
The PVAAS Methodologies Looking Forward/Planning… Looking Back/Evaluation… Value-added Growth Reports For Cohorts of Students Today PVAAS Projection Reports For Individual Students and Cohorts of Students
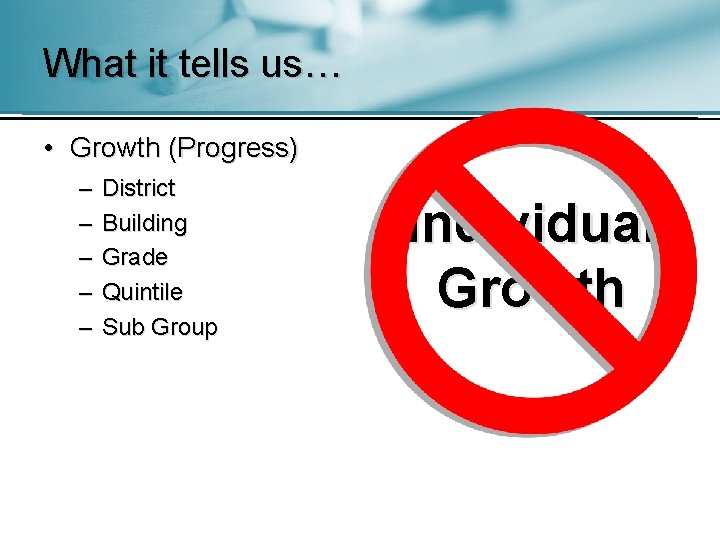
What it tells us… • Growth (Progress) – – – District Building Grade Quintile Sub Group Individual Growth
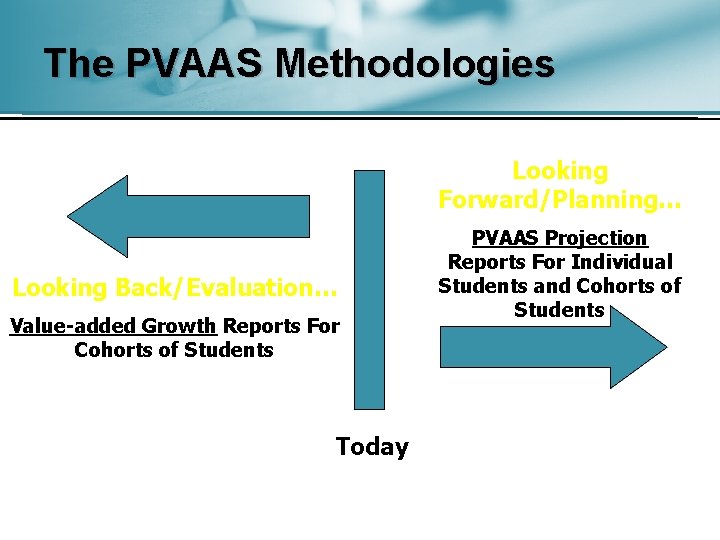
The PVAAS Methodologies Looking Forward/Planning… Looking Back/Evaluation… Value-added Growth Reports For Cohorts of Students Today PVAAS Projection Reports For Individual Students and Cohorts of Students
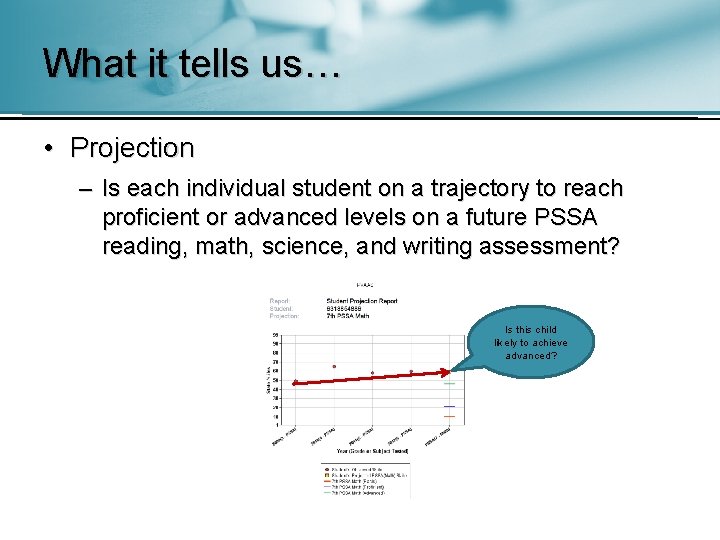
What it tells us… • Projection – Is each individual student on a trajectory to reach proficient or advanced levels on a future PSSA reading, math, science, and writing assessment? Is this child likely to achieve advanced?
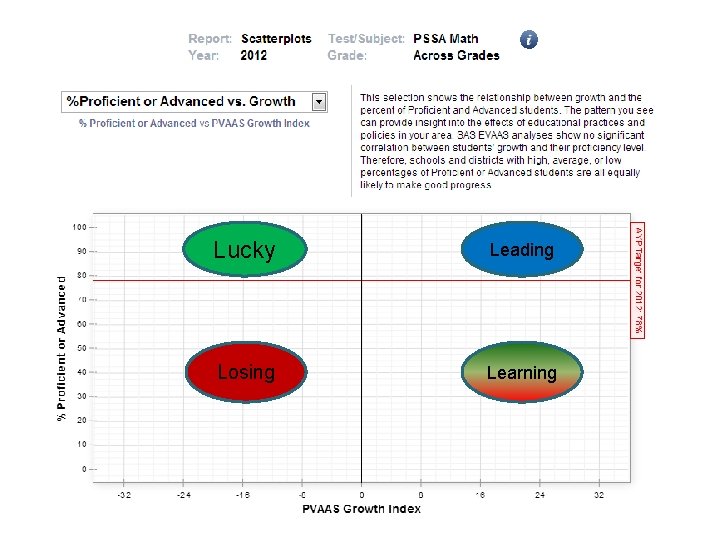
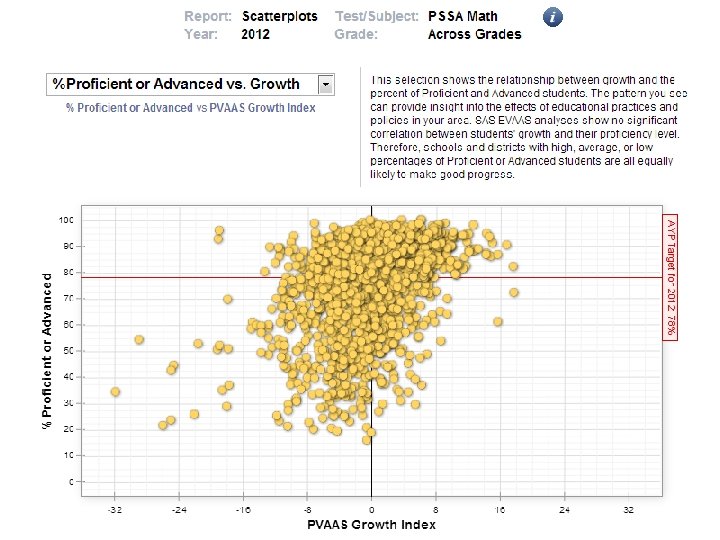
Public Reporting • Scatterplots – District – Building – Grade Bands/ Subjects
Lucky Leading Losing Learning
Secured Access • Growth – – – – District Building Grade Teacher (eventually) Sub-Groups Performance Levels Quintiles Custom Groups
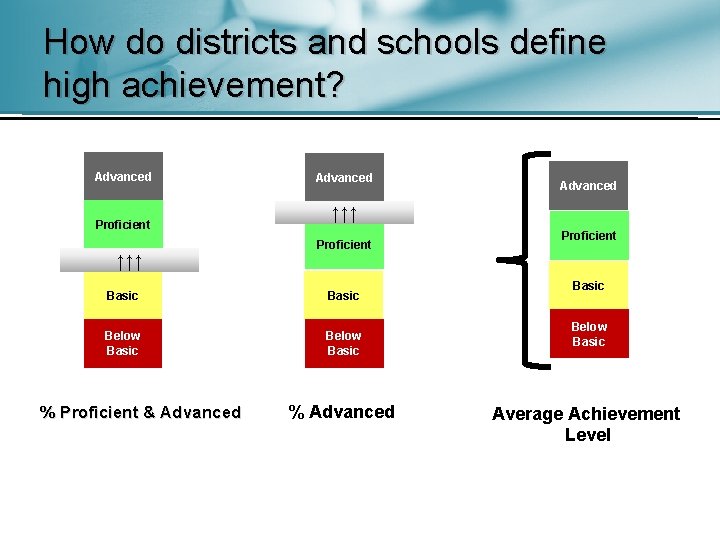
How do districts and schools define high achievement? Advanced Proficient ↑↑↑ Advanced ↑↑↑ Proficient Basic Below Basic % Proficient & Advanced % Advanced Proficient Basic Below Basic Average Achievement Level
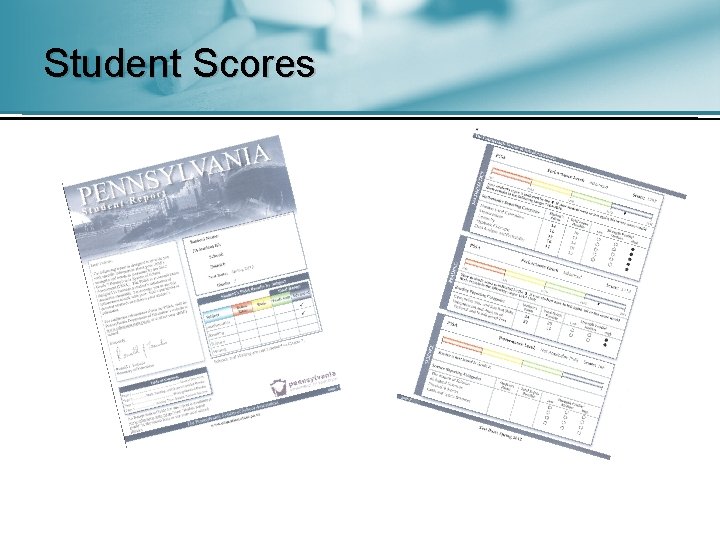
Student Scores
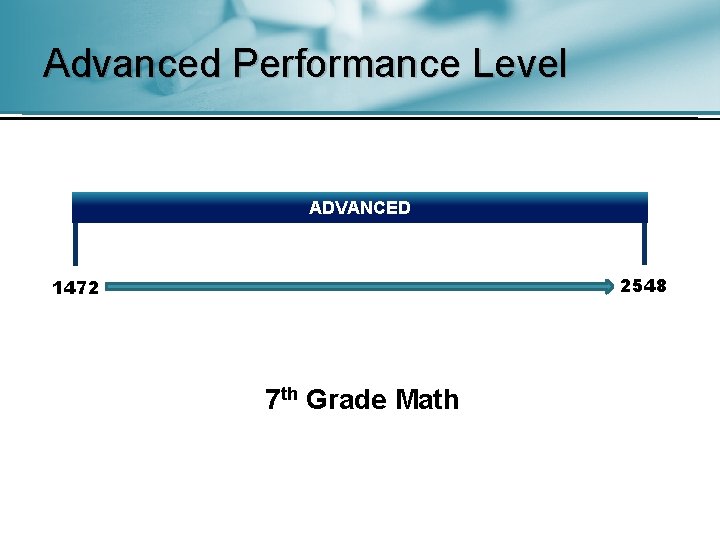
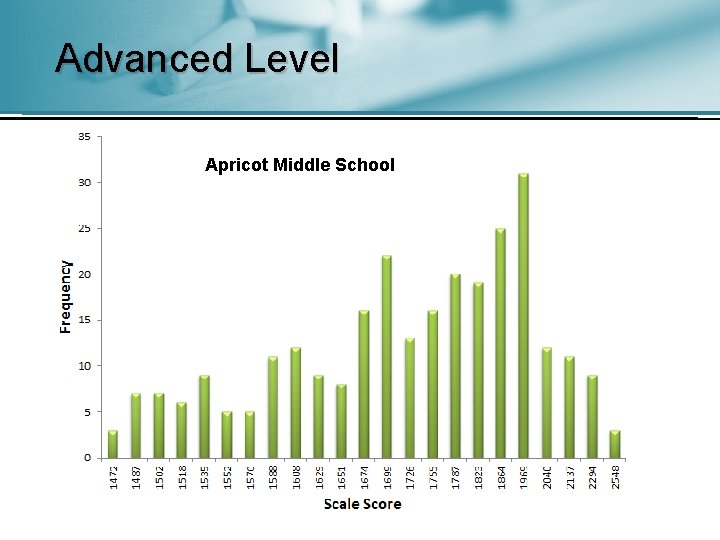
Advanced Performance Level ADVANCED 2548 1472 7 th Grade Math
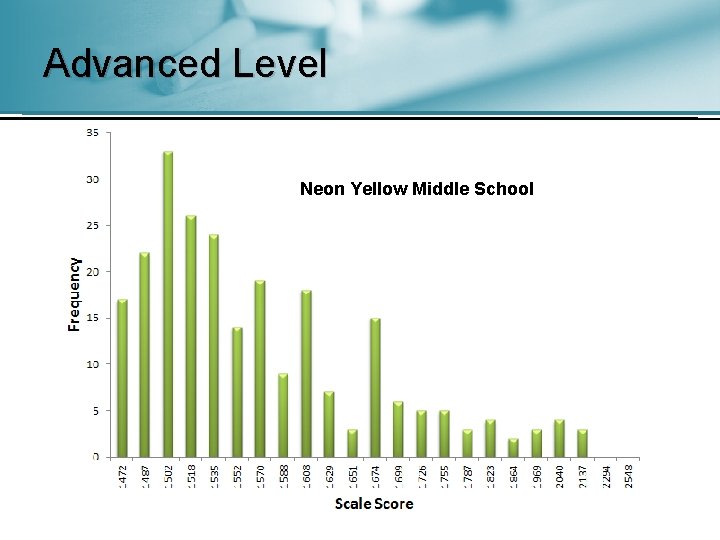
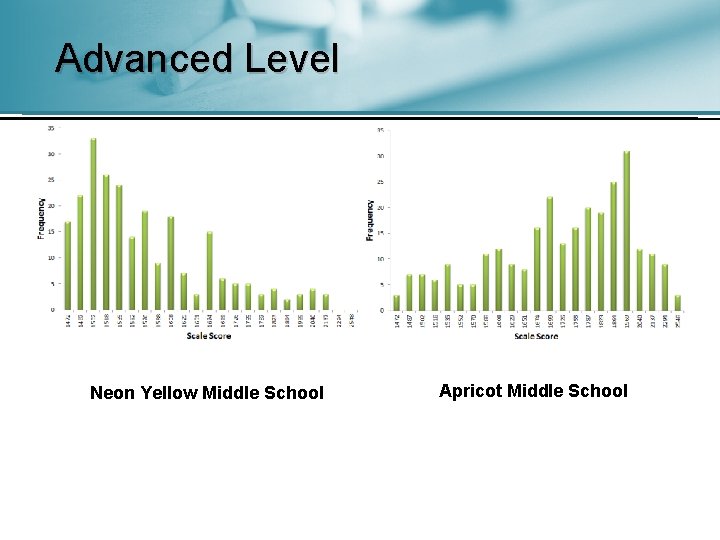
Advanced Level Neon Yellow Middle School
Advanced Level Apricot Middle School
Advanced Level Neon Yellow Middle School Apricot Middle School
How many students score at the top score each year?
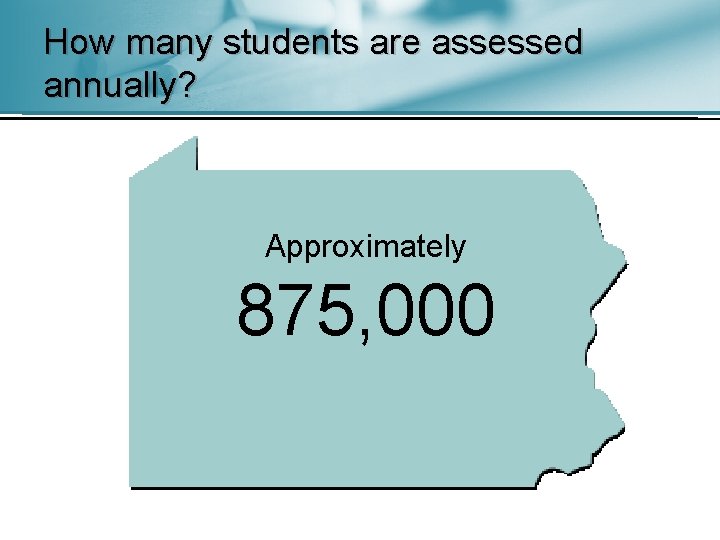
How many students are assessed annually? Approximately 875, 000
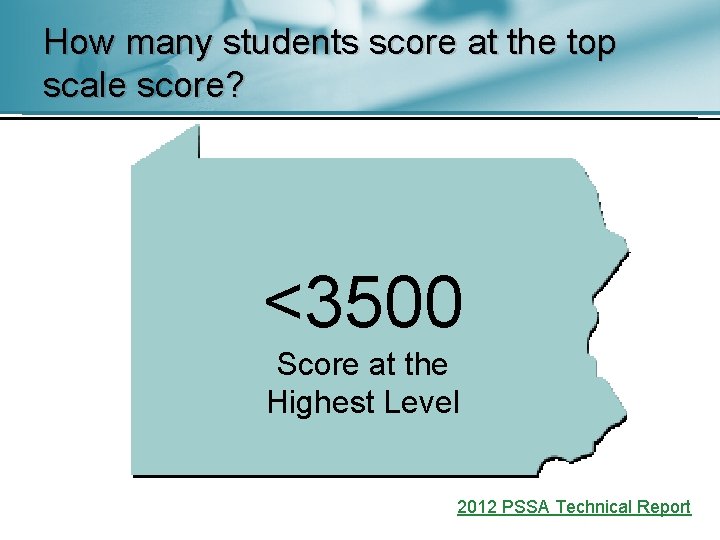
How many students score at the top scale score? <3500 Score at the Highest Level 2012 PSSA Technical Report
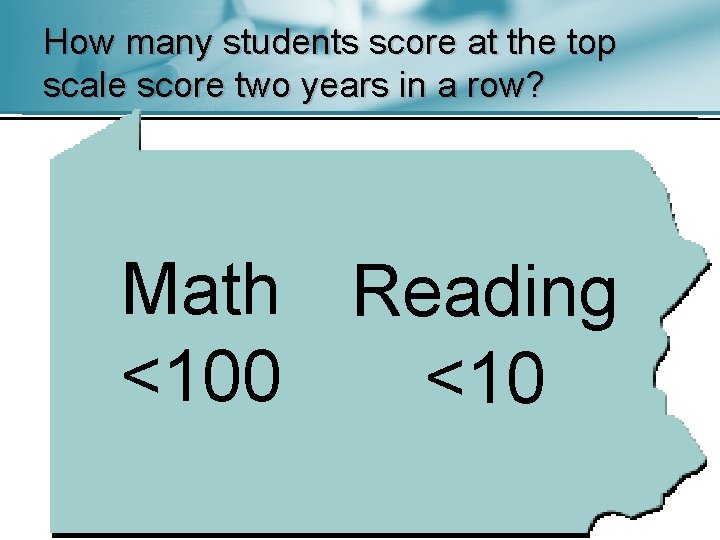
How many students score at the top scale score two years in a row? Math Reading <100 <10
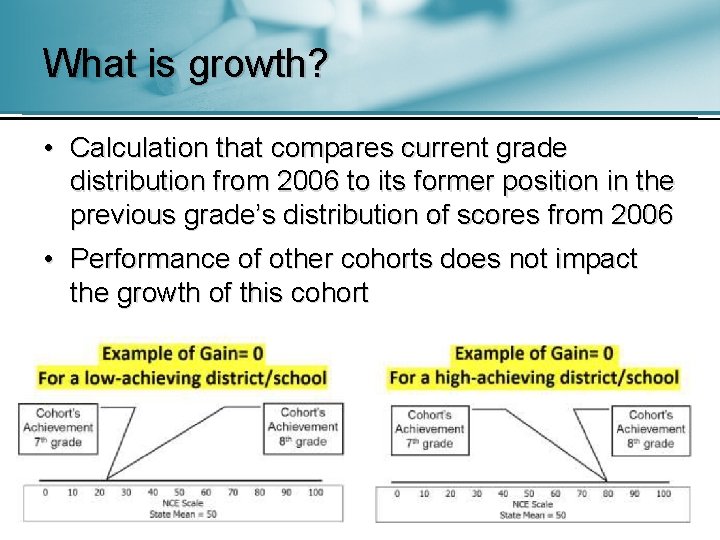
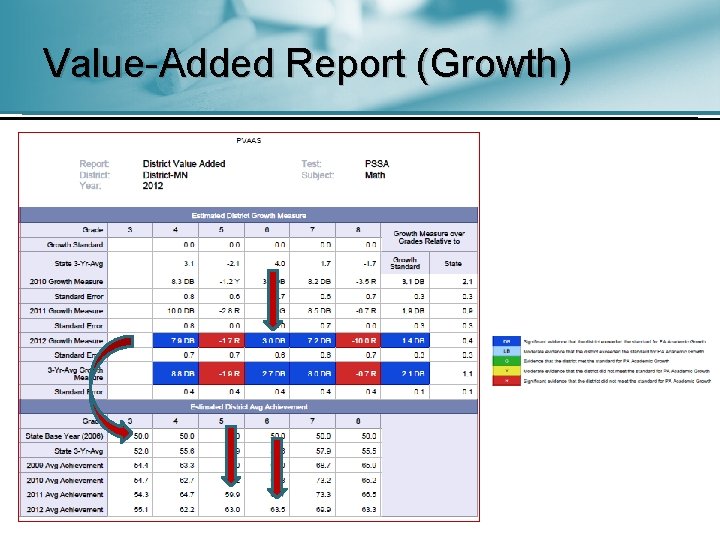
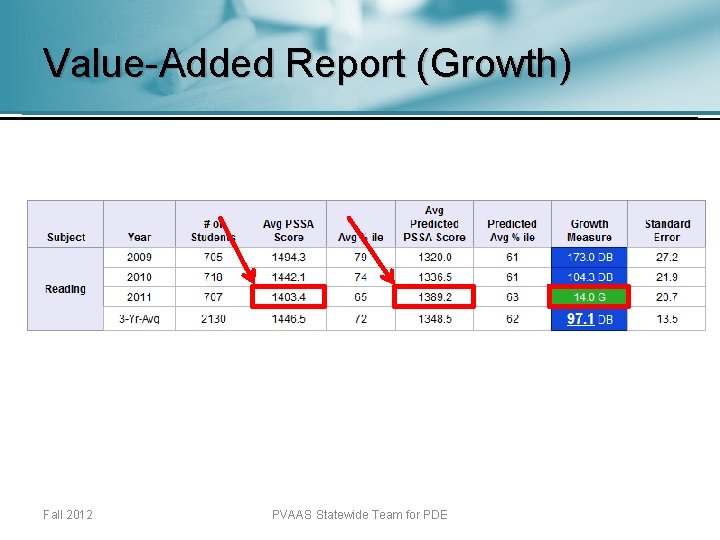
What is growth? • Calculation that compares current grade distribution from 2006 to its former position in the previous grade’s distribution of scores from 2006 • Performance of other cohorts does not impact the growth of this cohort
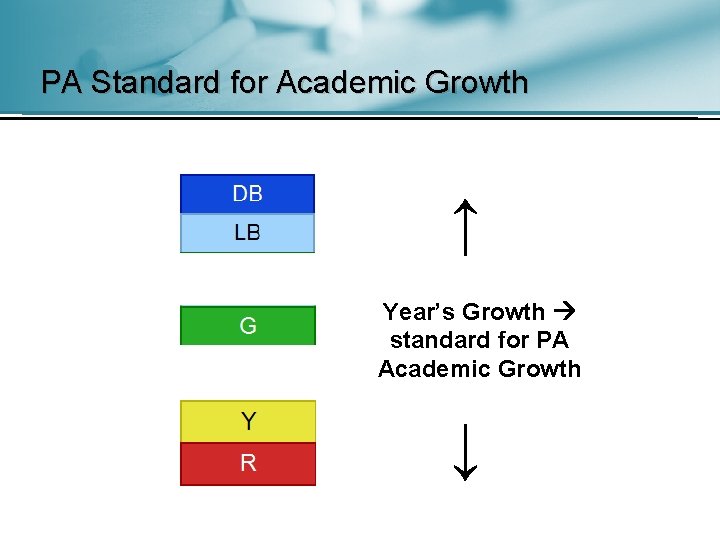
PA Standard for Academic Growth ↑ Year’s Growth standard for PA Academic Growth ↓
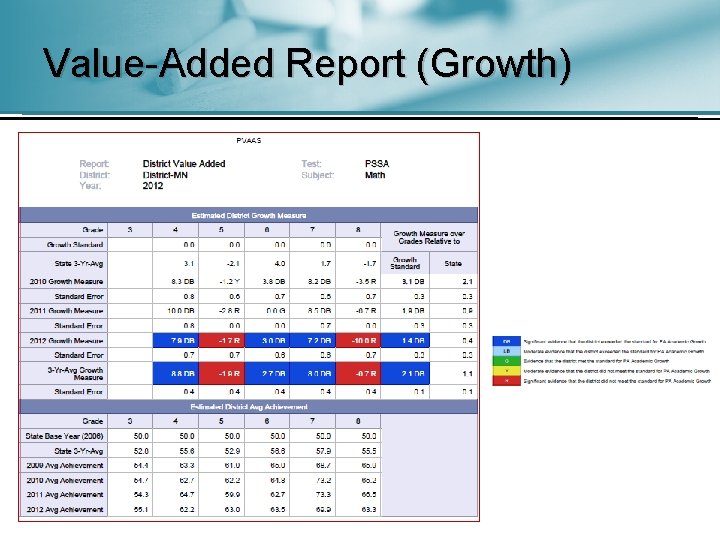
Value-Added Report (Growth)
Value-Added Report (Growth)
Value-Added Report (Growth) Fall 2012 PVAAS Statewide Team for PDE
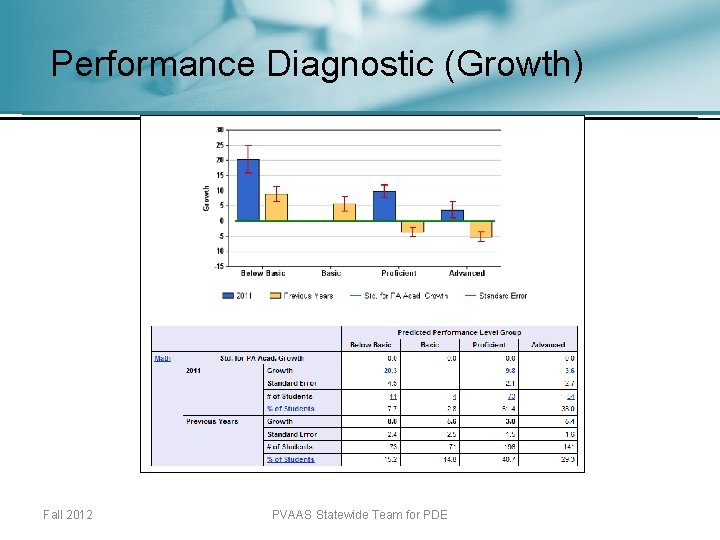
Performance Diagnostic (Growth) Fall 2012 PVAAS Statewide Team for PDE
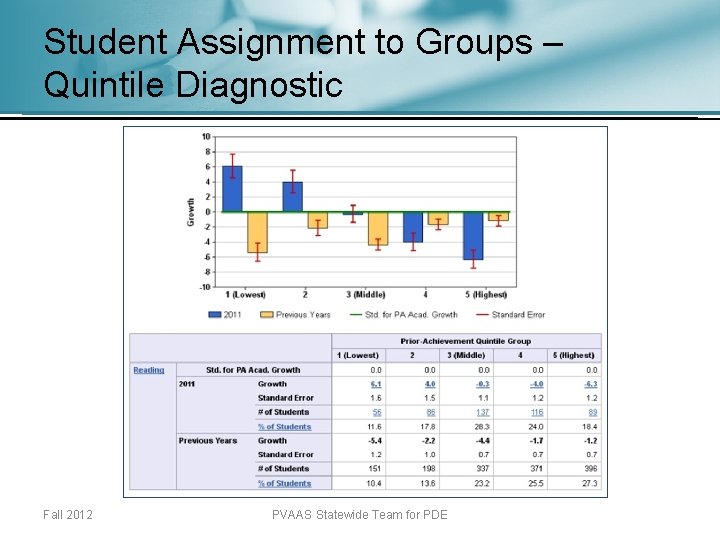
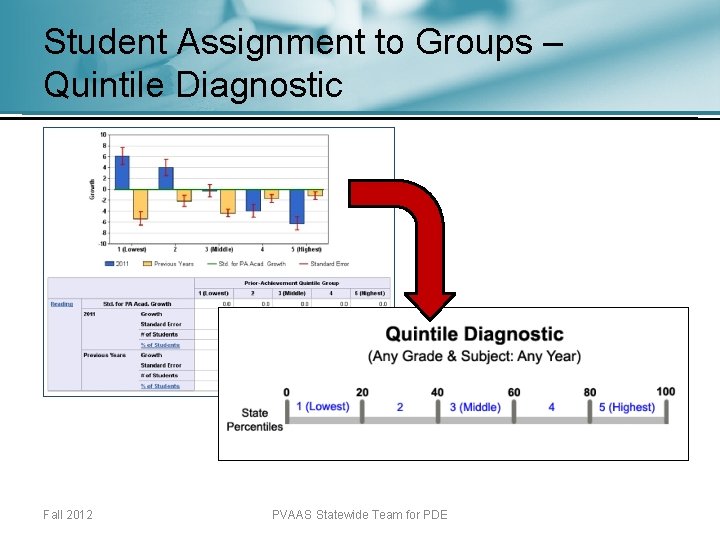
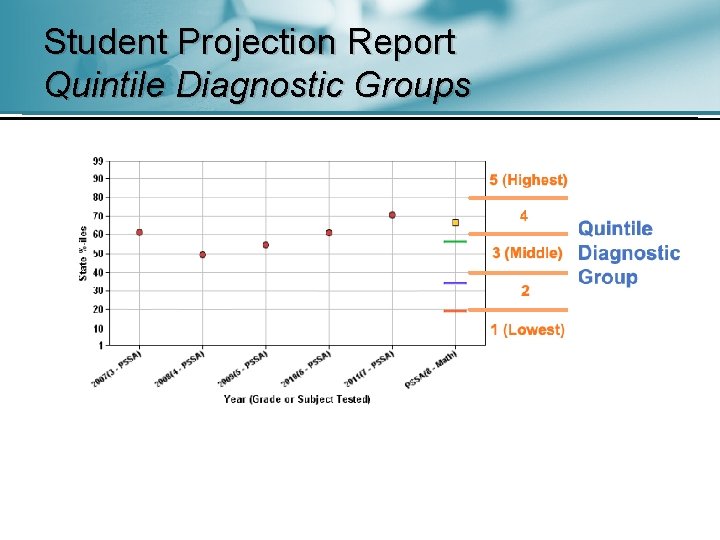
Quintile Diagnostic Report • The state distribution is divided into 5 equal groups (quintile groups) – Students are placed into groups based on where they fall, achievement-wise, in the state distribution of students in the same grade and subject – Where do your gifted students profile? Fall 2012 PVAAS Statewide Team for PDE
Student Assignment to Groups – Quintile Diagnostic Fall 2012 PVAAS Statewide Team for PDE
Student Assignment to Groups – Quintile Diagnostic Fall 2012 PVAAS Statewide Team for PDE
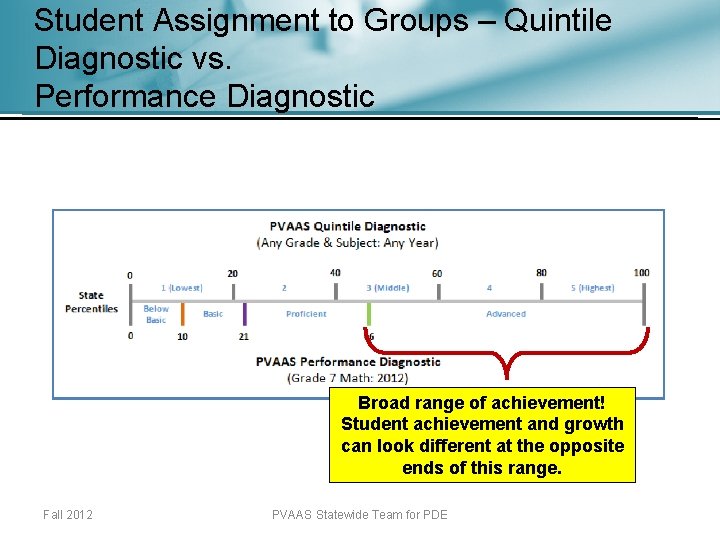
Student Assignment to Groups – Quintile Diagnostic vs. Performance Diagnostic Broad range of achievement! Student achievement and growth can look different at the opposite ends of this range. Fall 2012 PVAAS Statewide Team for PDE
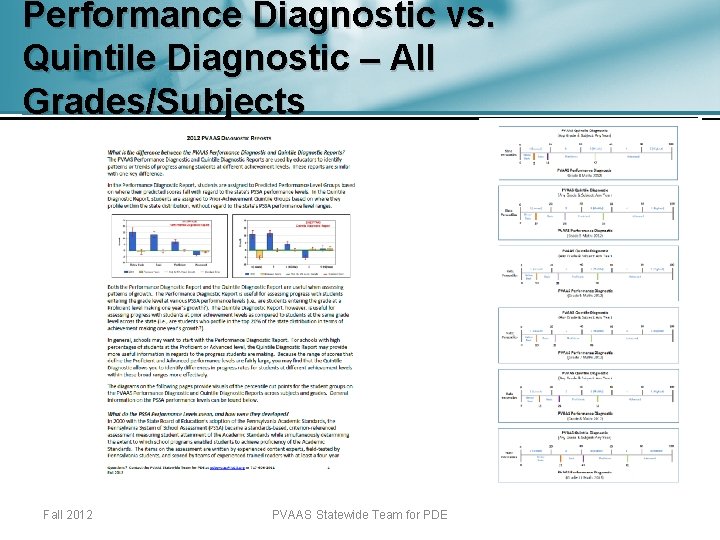
Performance Diagnostic vs. Quintile Diagnostic – All Grades/Subjects Fall 2012 PVAAS Statewide Team for PDE
Using the Performance Diagnostic vs. the Quintile Diagnostic • If you want to view the growth of students in the Advanced range (or at higher achievement levels), use the Quintile Diagnostic. • If you want to view the growth of students at the lower end of the achievement spectrum, use the Performance Diagnostic. Fall 2012 PVAAS Statewide Team for PDE
Turn to a partner • Describe three reports (Value-Added, Performance Diagnostic, Quintile Diagnostic) used to identify growth. – How are they similar? – How are they different?
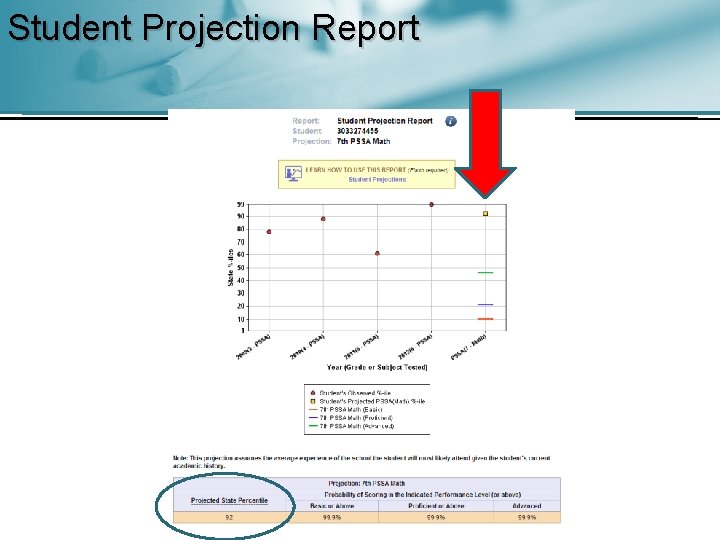
Projection Reports (Looking Ahead) Projected State Percentile – Based on the student’s prior test scores across grades and subjects – Growth measure of the school – Testing history of similar students who have already taken this test
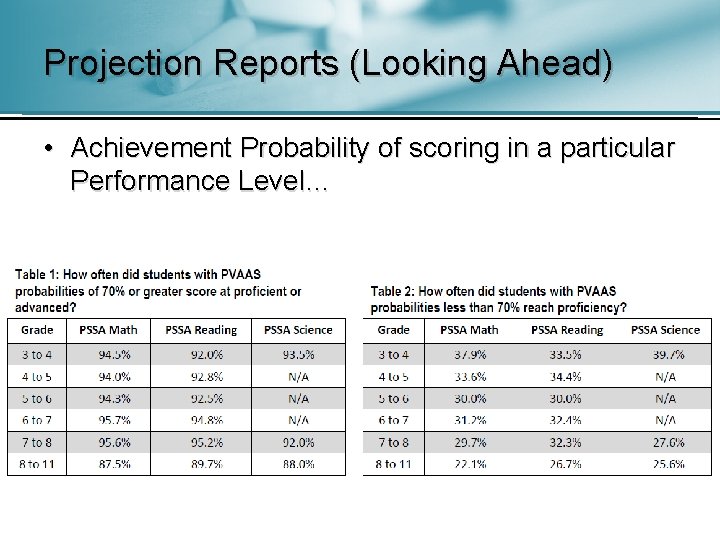
Projection Reports (Looking Ahead) • Achievement Probability of scoring in a particular Performance Level…
PVAAS and Chapter 16 • How can we use the data from PVAAS as one piece of data to inform the decisions we make in screening, identification, and educational placement?
Screening • Use it in your child find process… • In addition to scale scores, benchmark assessments, or common assessments, let’s look at the PVAAS projections
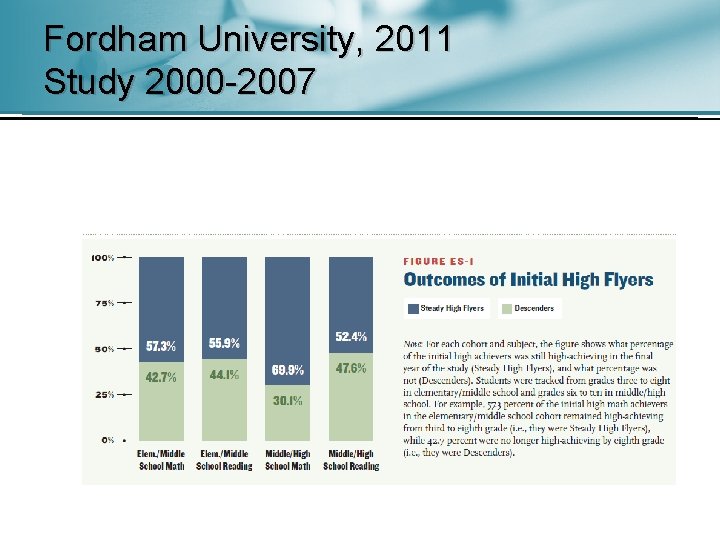
Let’s try an experiment • What percentile would you consider a cut-off point for screening students? • 70 th? 80 th? 90 th? ” • Before you answer, let’s reference the Fordham Report.
Fordham University, 2011 Study 2000 -2007
Student Projection Report Quintile Diagnostic Groups
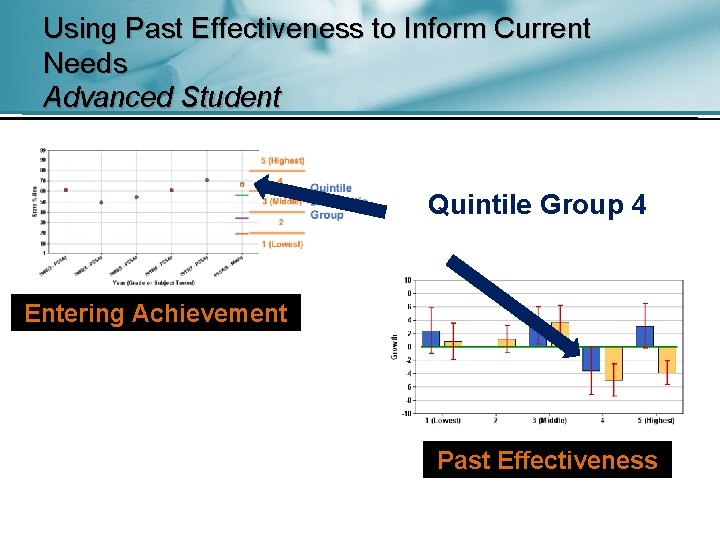
Using Past Effectiveness to Inform Current Needs Advanced Student Quintile Group 4 Entering Achievement Past Effectiveness
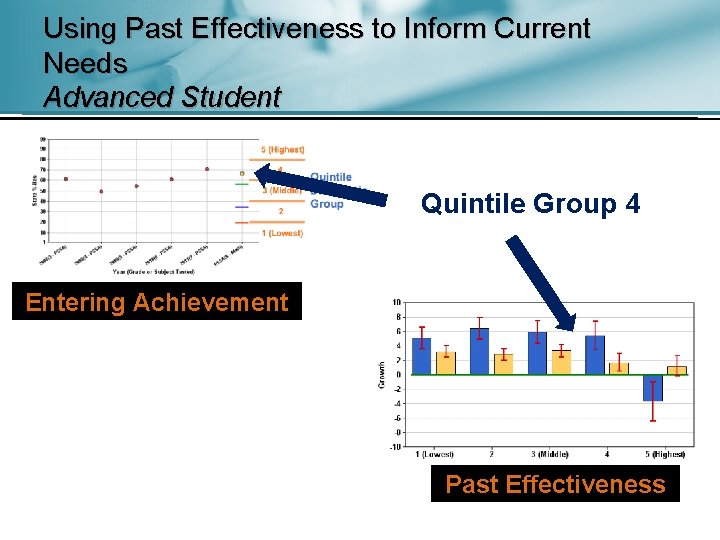
Using Past Effectiveness to Inform Current Needs Advanced Student Quintile Group 4 Entering Achievement Past Effectiveness
GIEP Planning • Could we use this process for GIEP Planning? • How have students who are similar performed with or without specially designed instruction?
How can we do this? • Let’s take a look at a 6 th Grade Gifted Math Student who is currently accelerated in math by one year (Pre. Algebra). http: //www. nccsc. k 12. in. us/index. php/schoolstop/elementarytop/westwoodmoodletop. html
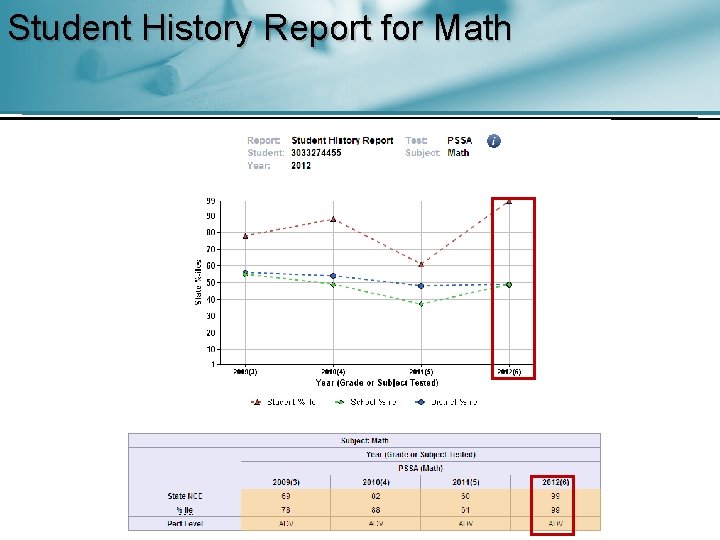
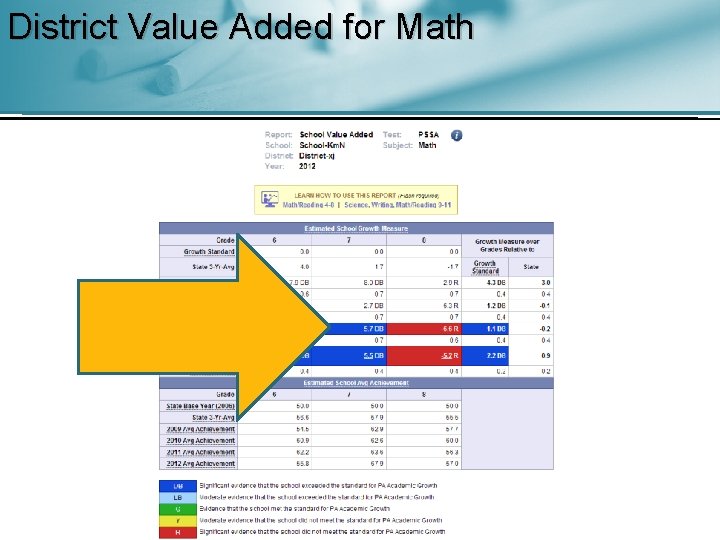
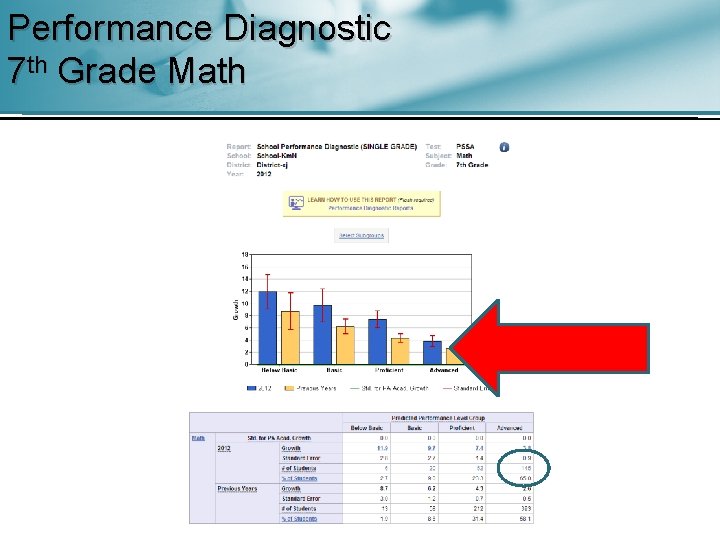
GIEP Planning • Present Levels show current accelerated year was successful. • Classroom Diagnostic tool shows he is working above grade level in most standards – beyond 7 th grade in some cases. • The plan for 7 th grade is to accelerate him one year in math. Will that help him meet the growth standard in math?
Student History Report for Math
District Value Added for Math
Performance Diagnostic 7 th Grade Math
Student Projection Report
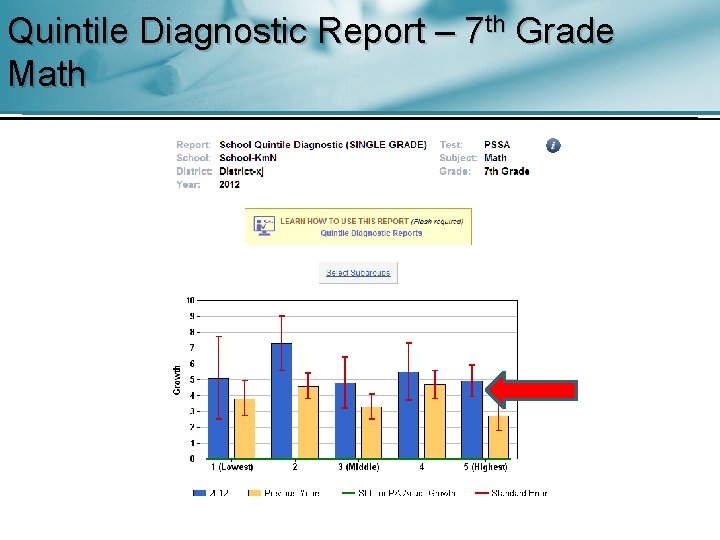
Quintile Diagnostic Report – 7 th Grade Math
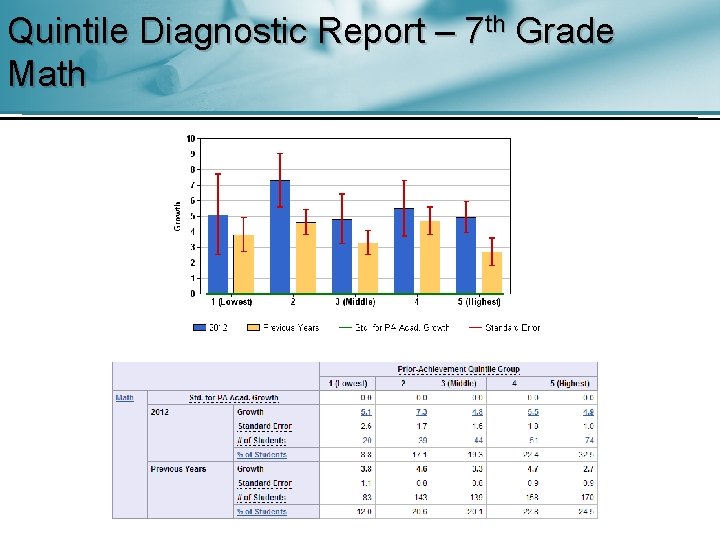
Quintile Diagnostic Report – 7 th Grade Math
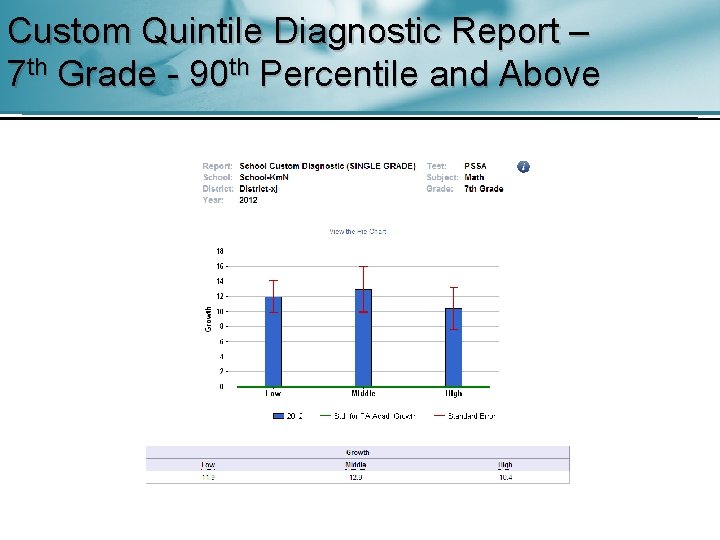
Custom Quintile Diagnostic Report – 7 th Grade - 90 th Percentile and Above
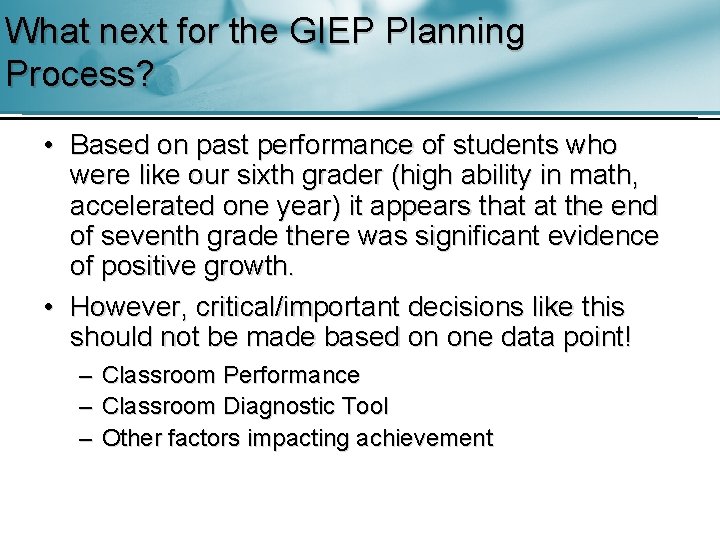
What next for the GIEP Planning Process? • Based on past performance of students who were like our sixth grader (high ability in math, accelerated one year) it appears that at the end of seventh grade there was significant evidence of positive growth. • However, critical/important decisions like this should not be made based on one data point! – Classroom Performance – Classroom Diagnostic Tool – Other factors impacting achievement
Reflection • How will this piece of data inform the decision making process to assure that the plans written for a student are individualized to his/her need? • What concerns/questions might you have about this process?
How can we streamline this process? • Connecting Student Growth/Projections to System Performance § Look at whole sub-group at one time § Determine system potential impact
How can we streamline this process? • Overview of Growth Table § Look at the system as a whole § Determine effectiveness of the system by grade level/subject area for whole groups and all subgroups
Overview of Growth Table: The Process Fall 2012 PVAAS Statewide Team for PDE
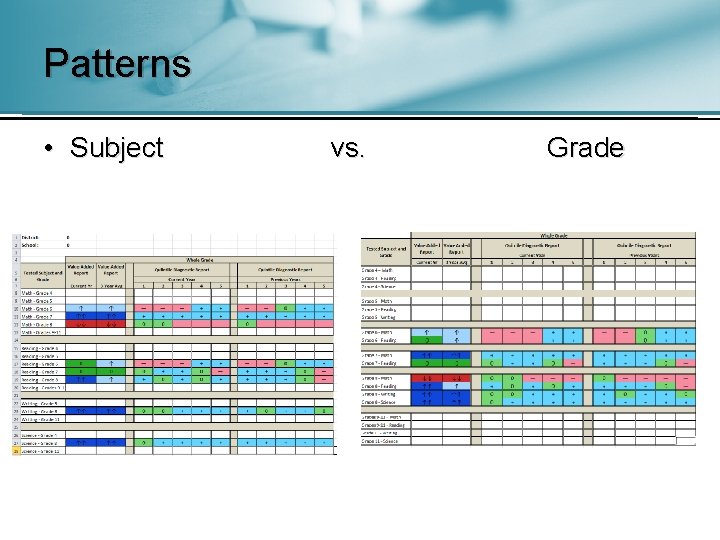
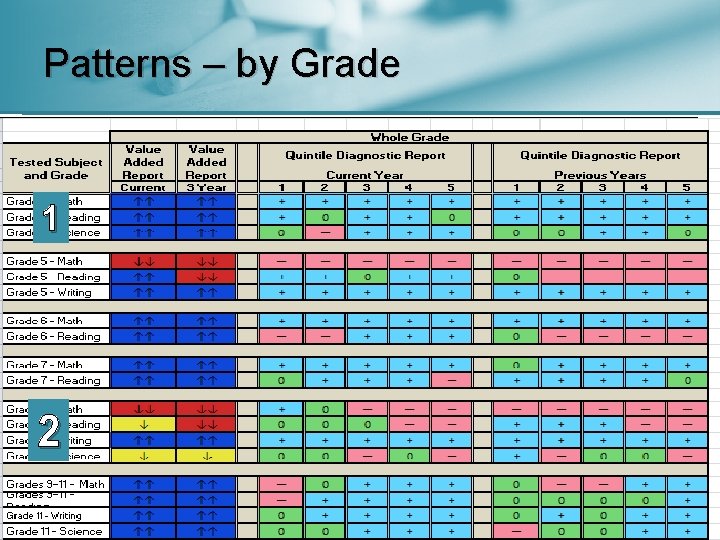
Patterns • Subject vs. Grade
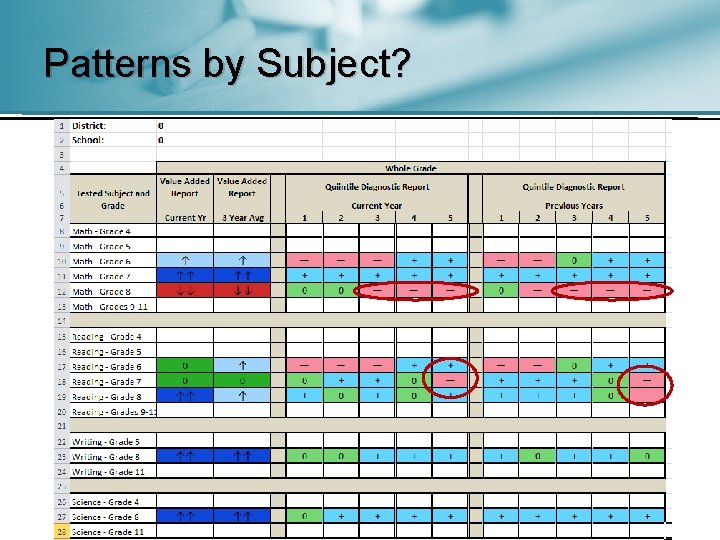
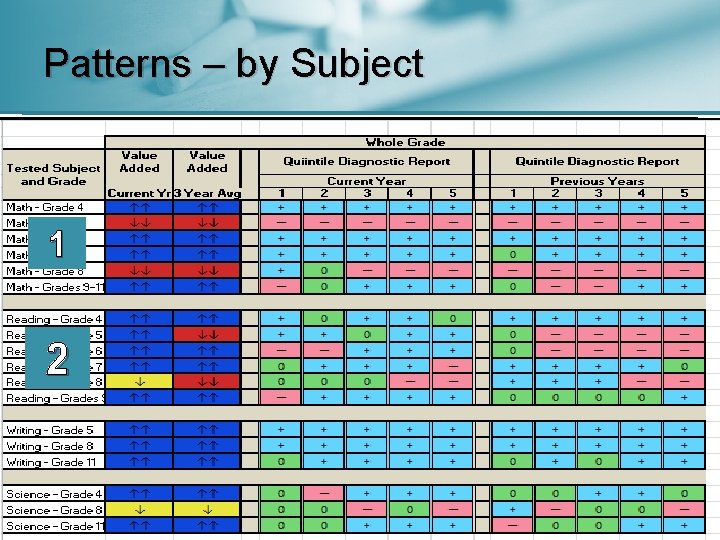
Patterns by Subject?
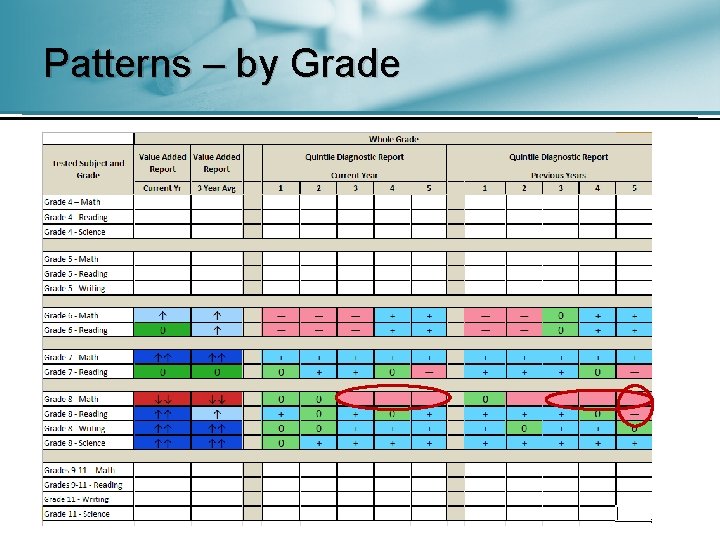
Patterns – by Grade
Step-by-Step Process • Create a data packet using the Data Packet feature in PVAAS • Complete an Overview of Growth Table for your school or district Fall 2012 PVAAS Statewide Team for PDE
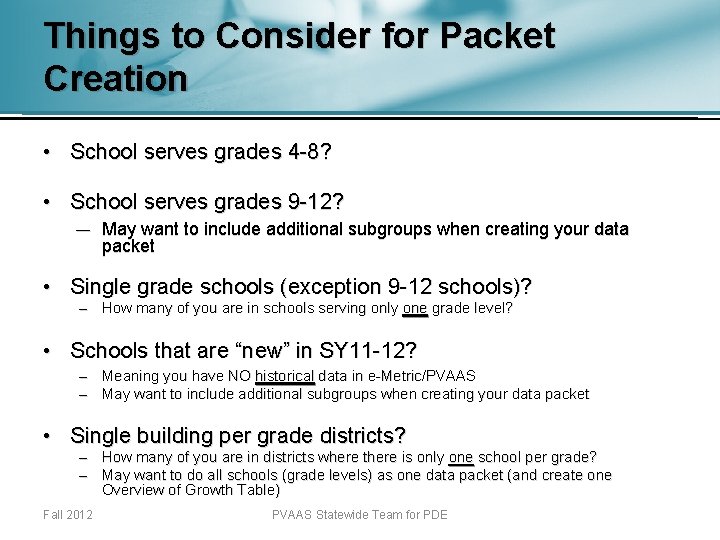
Things to Consider for Packet Creation • School serves grades 4 -8? • School serves grades 9 -12? — May want to include additional subgroups when creating your data packet • Single grade schools (exception 9 -12 schools)? – How many of you are in schools serving only one grade level? • Schools that are “new” in SY 11 -12? – Meaning you have NO historical data in e-Metric/PVAAS – May want to include additional subgroups when creating your data packet • Single building per grade districts? – How many of you are in districts where there is only one school per grade? – May want to do all schools (grade levels) as one data packet (and create one Overview of Growth Table) Fall 2012 PVAAS Statewide Team for PDE
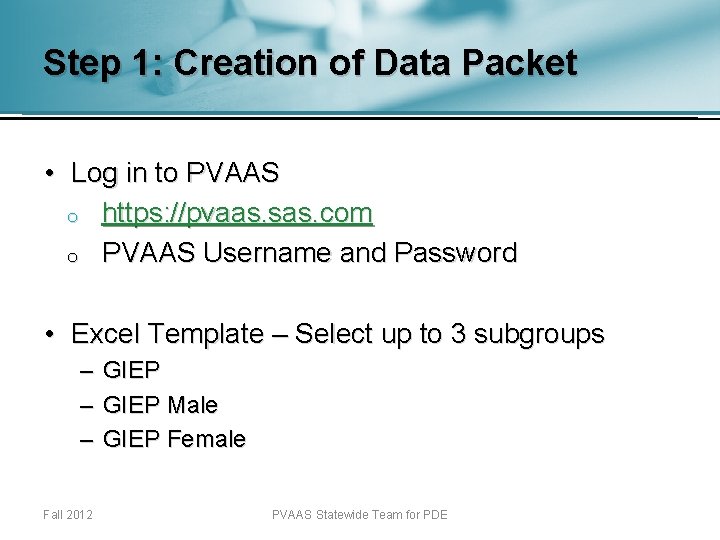
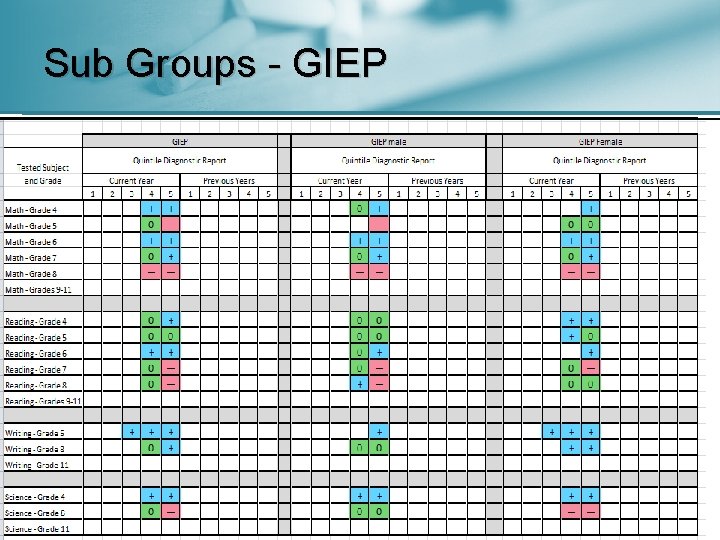
Step 1: Creation of Data Packet • Log in to PVAAS o https: //pvaas. sas. com o PVAAS Username and Password • Excel Template – Select up to 3 subgroups – – – Fall 2012 GIEP Male GIEP Female PVAAS Statewide Team for PDE
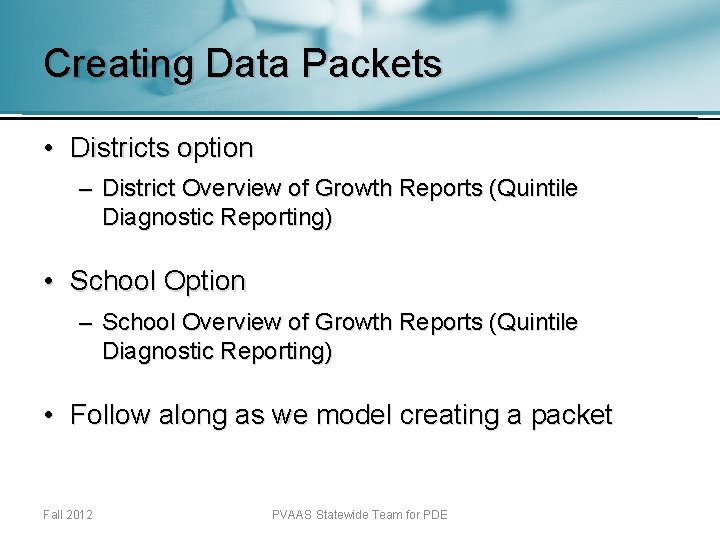
Creating Data Packets • Districts option – District Overview of Growth Reports (Quintile Diagnostic Reporting) • School Option – School Overview of Growth Reports (Quintile Diagnostic Reporting) • Follow along as we model creating a packet Fall 2012 PVAAS Statewide Team for PDE
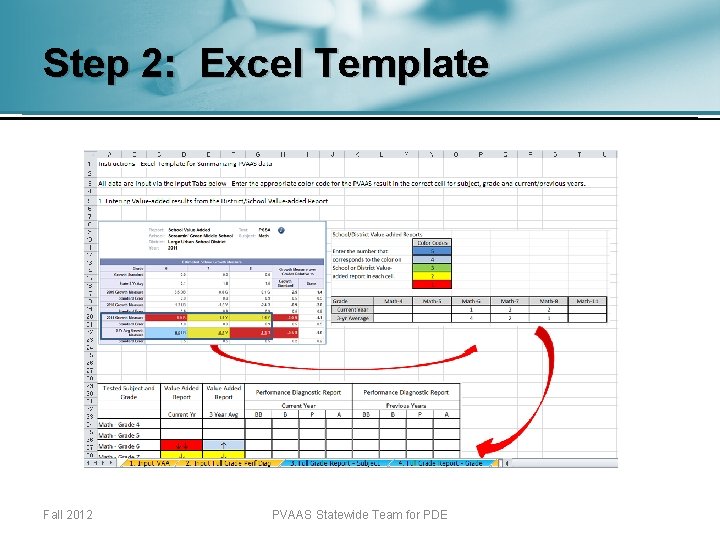
Step 2: Excel Template Fall 2012 PVAAS Statewide Team for PDE
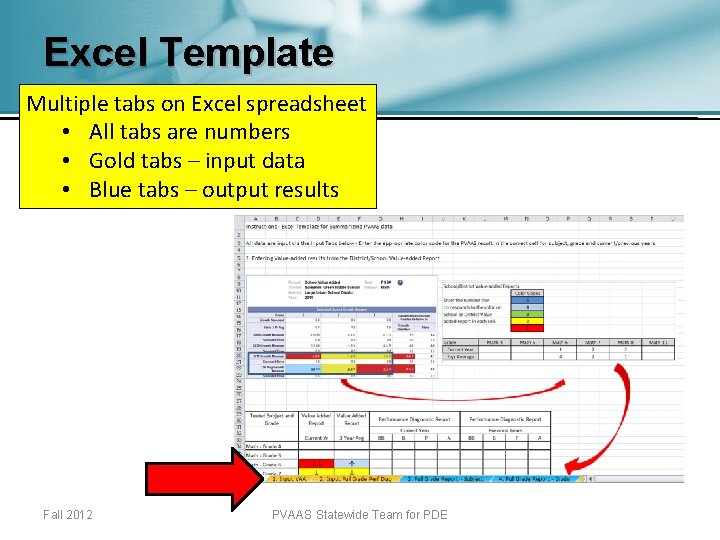
Excel Template Multiple tabs on Excel spreadsheet • All tabs are numbers • Gold tabs – input data • Blue tabs – output results Fall 2012 PVAAS Statewide Team for PDE
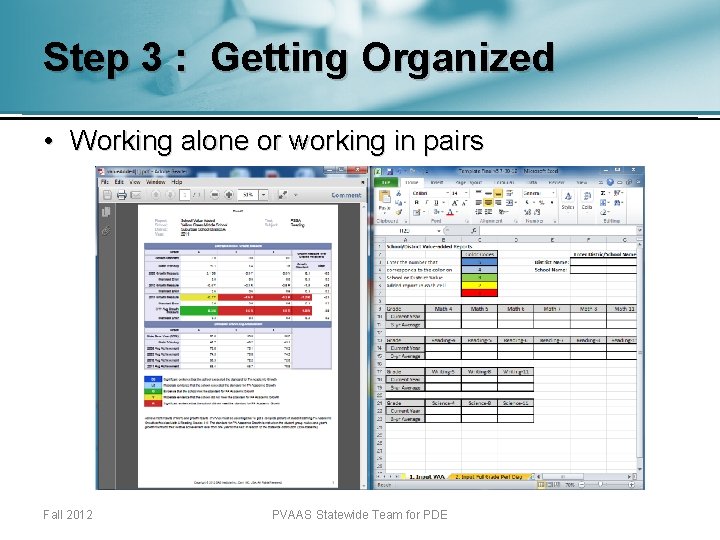
Step 3 : Getting Organized • Working alone or working in pairs Fall 2012 PVAAS Statewide Team for PDE
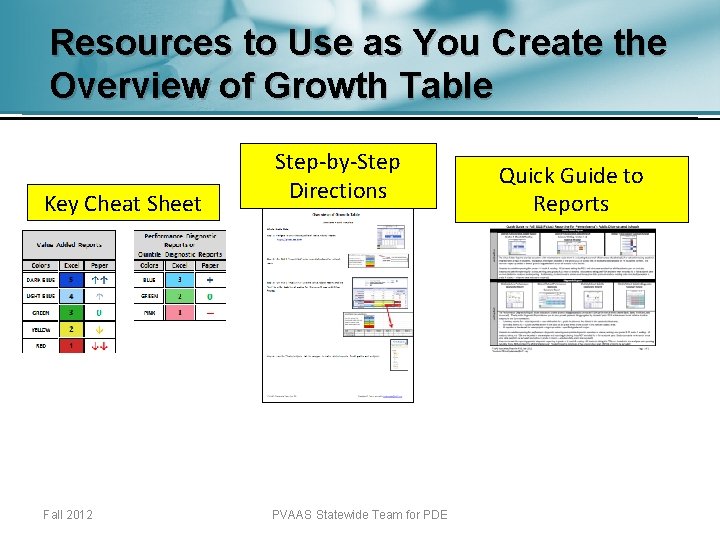
Resources to Use as You Create the Overview of Growth Table Key Cheat Sheet Fall 2012 Step-by-Step Directions PVAAS Statewide Team for PDE Quick Guide to Reports
Patterns of Progress • Serve as an indicator of – Where programs are effectively growing students – Where programs are not effectively growing students • Should be viewed through the context of the achievement goals of your school
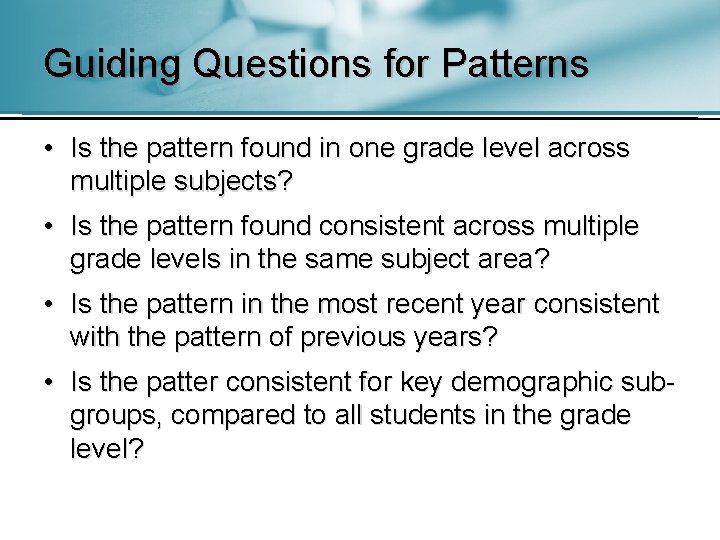
Guiding Questions for Patterns • Is the pattern found in one grade level across multiple subjects? • Is the pattern found consistent across multiple grade levels in the same subject area? • Is the pattern in the most recent year consistent with the pattern of previous years? • Is the patter consistent for key demographic subgroups, compared to all students in the grade level?
Patterns – by Subject 1 2
Patterns – by Grade 1 2
Sub Groups - GIEP
Learning Outcomes • How effectively is our system meeting the needs of our advanced learners? • Are we projected to grow our advanced learners? • How can we use PVAAS to inform the decisions we make regarding Chapter 16?
PVAAS and Screening • Combination of Current PSSA Score Percentiles and PVAAS Projections to a Percentile • Projections one and two year’s out • Unidentified students may need and are NOT receiving what they need instructionally
GIEP Planning • Use past effectiveness to justify “meaningful benefit” • Use Projection to Percentiles in Present Levels to proactively plan – Key – if you see the projected percentile take a dive – look at Past Effectiveness of previous cohorts who have received that planned instruction, don’t assume it is the student until you have analyzed your system • Projections to keystone will start this year as low as 5 th grade – could indicate a need for acceleration
Questions? ?
Questions? • Tanya Morret – tmorret@caiu. org • Statewide PVAAS Team – pdepvass@iu 13. org