RENAL DOPPLER ULTRASOUND A Norouzi 1393 Renovascular disease


 • Accessory RAs are quite common, seen in approximately")


 in the main RA and its branches")

 • Four criteria are used to diagnose")


 Resistive Index Acceleration Time The Resistive")


 of an intrarenal doppler waveform indicates stenosis and")
")

 at Doppler US may")


 or renal-segmental ratio (RSR) : • RIR is potentially")


- Slides: 55
RENAL DOPPLER ULTRASOUND A . Norouzi 1393
• Renovascular disease is a complex disorder, most commonly caused by fibromuscular dysplasia and atherosclerotic diseases. • It can be found in one of three forms: asymptomatic renal artery stenosis (RAS), renovascular hypertension, and ischemic nephropathy. • Prevalence of RAS is estimated to range from 1% to 5% of all hypertensives in the general population up to 30% of a highly selected referral population (i. e. malignant hypertension, young patients with hypertension, the presence of an abdominal bruit, decreased serum potassium, unexplained azotemia, recurrent congestive heart failure or “flash” pulmonary edema)
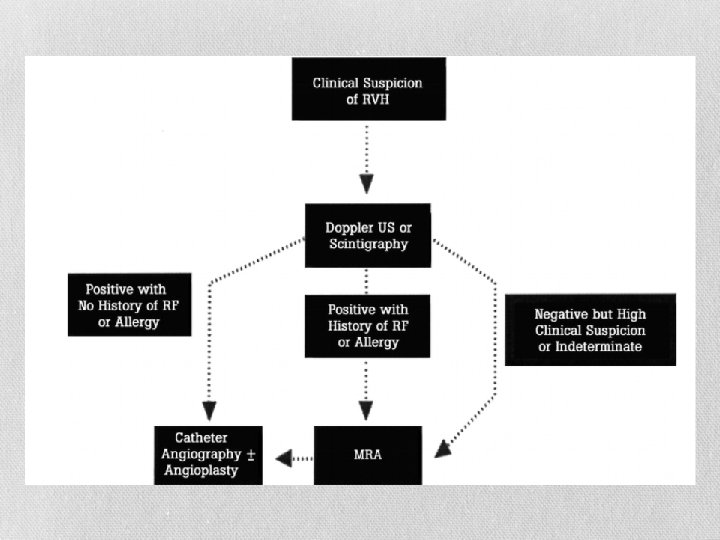
• When left untreated, atheromatous RAS tends to worsen, leading to renal artery thrombosis. • In addition, medical treatment of RVH has been proved to be less effective than percutaneous or surgical revascularization. • Therefore, patients suspected of having RVH should undergo adequate screening.
• In this selected population, the investigation should be extended to noninvasive studies that will allow detection of RAS. • While captopril renography was widely used in the past, Doppler ultrasound (US) of the renal arteries (RAs), angio-CT, or magnetic resonance angiography (MRA) have replaced other modalities and they are now considered the screening tests of choice. • An arteriogram is rarely needed for diagnostic purposes only.
Causes of RAS • Although a variety of pathologic lesions may cause RVH, the most common is stenosis of the renal artery caused by atherosclerosis or, less commonly, fibromuscular dysplasia. • Other causes include parenchymal disease, renal neoplasms, renal vein thrombosis, arteritis, dissection, neurofibromatosis or an adrenal mass • In general, atheromatous lesions involve the proximal renal artery, whereas fibromuscular dysplasia involves the distal main renal artery and segmental renal arteries. • Consequently, diagnostic tests that demonstrate only the proximal renal arteries, such as MR angiography or Doppler US limited to the main renal arteries, can be of less value in patients with suspected fibromuscular dysplasia.
• Doppler US has the advantages of being noninvasive and inexpensive. • However, considerable controversy exists with regard to the role of Doppler US in screening for RAS. • However, when a discrepancy exists between clinical data and the results of Doppler US, additional tests are mandatory.
• Two approaches are used to detect RAS with Doppler US: direct visualization of the renal arteries and analysis of intrarenal Doppler waveforms. • Both ideally are used in conjuction with each other, however, in circumstances where the renal artery is not seen in its entirety then the indirect approach alone can give an indication of vascular disease.
• PREPARATION Fast for 6 -12 hours. No food. Drink 2 litres of water over the two hours prior to the appointment. The bladder can be emptied as needed. Book the appointment in the morning preferably to reduce bowel gas. • TRANSDUCER: Highest frequency curved linear array probe possible. Start with 7 MHz and work down to 2 or 3 MHz for larger patients. Colour and Doppler capabilities. Assess the depth of penetration required and adapt. • LIMITATIONS This examination requires the patient to be cooperative and hold respiration in inspiration and expiration depending where the sonographer can best see the artery.
Anatomy • The main RA divides at the hilum, either within or outside the kidney, into anterior and posterior branches that further divide into segmental and then interlobar arteries. • The interlobar arteries further divide into a network of arcuate arteries that run at the corticomedullary junction and give off the cortical (interlobular) branches, which run radially towards the periphery, and the medullary branches, which supply the renal pyramids.
• DIRECT ASSESSMENT • Owing to various factors such as gas interposition or the anatomy of the left renal artery, a complete examination of both renal arteries can be achieved in only 50%– 90% of cases
• ANTERIOR APPROACH • The first approach involves direct scanning of the main renal arteries with color or power Doppler US followed by analysis of renal artery velocity with spectral Doppler US. • The renal arteries are clearly imaged in B Mode from an anterior, subcostal approach (usually 1– 2 cm below the superior mesenteric artery origin) however as it is perpendicular to the ultrasound beam it is not suitable for Doppler assessment. • An anterior or anterolateral approach usually allows exploration of both renal arteries with an adequate angle of insonation.
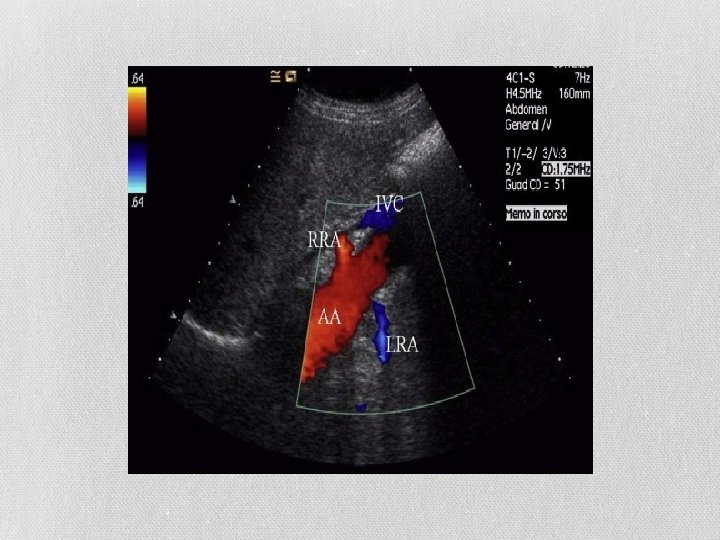
• The right RA originates from the anterolateral aspect of the aorta and immediately turns posteriorly to course beneath the inferior vena cava (IVC). • The proximal right RA is not only deep in the abdomen but it also lies perpendicular to the Doppler beam in the usual transverse scan plane. • The right RA may also be difficult to separate from the overlying IVC in this plane, and in this case flank approach is better. • From this view, RA flow is in a direction that is parallel to the Doppler beam, optimizing signal reception. • The patient usually needs to be placed in the opposite lateral decubitus position. • On the right, an additional aid in locating the RA is to image the IVC and to look posterior to it until a vessel crossing perpendicularly and of the opposite color is found. This must be the right RA, because no other large vessel lies posterior to the IVC
• The left RA tends to originate from the posterolateral surface of the aorta and courses posteriorly the surface of the aorta and over the psoas muscle. • An aid to locating the left RA is to first identify the left renal vein, which is usually large and easy to find. • Once the vein is identified, the artery will often be apparent as a smaller vessel directly behind it, coursing in the opposite direction.
Anterior Approach. The patient is lying supine and the probe is moved inferiorly and superiorly to identify the renal arteries and any supernumerary arteries. Look in B-Mode and Colour Doppler to help identify.
Anterior Approach: The left renal vein passes between the aorta and SMA. The left renal artery is located posterior to the renal vein.
• OBLIQUE APPROACH • By moving the probe to the left of midline and angling toward the patient's right, an acceptable Doppler angle of 60 degrees is achieved. • To avoid aliasing set the colour scale high enough so it is minimized. If the scale is too low then it is difficult to determine which vessel is the vein and which vessel is the artery.
Oblique Approach. Angling 45 degrees to right renal artery or rolling the patient in a semi left decubitus position to avoid the bowel gas and improve the Doppler angle.
Oblique Approach. Angling 45 degrees to right renal artery. In most individuals, the renal arteries arise from the abdominal aorta immediately distal to the origin of the SMA. By moving the probe to the right of midline and angling toward the patient's left, an acceptable Doppler angle of 45 -60 degrees is achieved
• Coronal Approach • A coronal approach can be used when bowel gas is present. • Roll the patient into a decubitus position to avoid bowel gas and improve visibility of the renal artery, especially the mid to distal portion.
Coronal Approach. Angling 90 degrees to left renal artery. The patient is rolled decubitus and a coronal view through the left loin and liver. An intercostal view through the ribs on a deep inspiration is ideal. Coronal Approach. This view provides an excellent angle for imaging the origins of both the right and left renal arteries using color/Power Doppler Using the Coronal approach to visualise the renal artery from the aorta to the kidney on a tortuous vessel may result in the mid section not being seen.
• PRONE APPROACH • The patient is lying prone or decubitus and the probe is moved from the spine laterally using the muscles as an acoustic window to find the kidney initially and then the renal hilum using Colour Doppler.
• Banana peel view • Another method of identifying the main RAs, particularly the areas of the ostia (where most stenoses occur in elderly patients), has been termed the “banana peel” view. • In this situation, the patient is turned to the opposite decubitus position from the vessel being examined. • For the “banana peel” view, the transducer is oriented longitudinally. • The aorta is located, and the transducer is moved in an anterior-toposterior direction until the RA is identified arising from it, coursing towards the transducer.
Supernumerary Arteries ( accessory Arteries) • Accessory RAs are quite common, seen in approximately 25– 30% of cases. • Two or more RAs are common, although typically one is dominant. It may be difficult or impossible to see accessory RAs, leading some to conclude that US evaluation for RAS is not sufficiently sensitive. • However, the occurrence of hemodynamically significant stenosis isolated to an accessory RA was 1– 1. 5% in a retrospective review of renal angiograms obtained in patients who underwent workup for renovascular hypertension , thus decreasing the significance of nonvisualized accessory RAs • Supernumerary (duplicate) arteries can be seen looking posterior to the IVC in B Mode and Colour in a sagittal plane.
• The caliber of the single renal artery originating from the abdominal aorta was found to measure between 5 and 10 mm in adults. • If the diameter of a RA measured by US is 4. 65 mm or less, the presence of an accessory renal artery can be established with 80% sensitivity and 80. 5% specificity. • If the diameter of the renal artery is 4. 15 mm or smaller, the presence of an accessory renal artery is extremely probable, with 98. 8% specificity. • It was also interesting that in kidneys with a main RA diameter of 5. 5 mm, no accessory RAs were encountered.
There are 2 renal arteries posterior to the IVC This coronal plane gives a better appreciation of the supernumerary arteries. Another useful view to demonstrate supernumerary (duplicate) renal arteries is a coronal image of the aorta.
There are 3 renal arteries posterior to the IVC
How to do • Use a 3. 5 - or 5. 0 -MHz curvilinear array transducer. • Doppler gain should be optimized to detect flow by increasing the gain to a level just below color artifact visualization in adjacent structures. • Set angle of insonation at 60° or less during the study of the aorta and renal arteries. • Place sample gate in the center of the arterial lumen, and set the width of the gate as 2 to 5 mm to include the entire artery lumen. • Perform the entire scanning as follows. • First, record the PSV in the abdominal aorta at the level of 1 cm below the origin of the superior mesenteric artery. • Second, obtain doppler traces from proximal, middle, and distal segments of each renal artery at the possibly smallest Doppler angle. • Finally, elicit doppler spectra at the upper, middle, and lower pole interlobar arteries along the pyramids, and select the one with most marked slope for recording the PSV.
• The peak systolic velocity (PSV) in the main RA and its branches should be less then 120 cm/s. • The velocity slowly decreases in the intrarenal arteries as they branch into the kidney. • RI values measured in healthy subjects show a significant dependence on age and the area sampled. • The values in the main RA are higher in the hilar region (0. 65 ± 0. 17) than in the more distal small arteries, and they are lowest in the interlobar arteries (0. 54 ± 0. 20) • In clinical practice the value of RI 0. 7 is used to discriminate between normal and pathologic resistance to flow.
• Various authors currently think that the best signals for evaluation come from the large segmental or interlobar arteries as they course directly towards the transducer. • In this location, signals are the strongest and most reproducible. • Weak signals from peripheral (arcuate arteries) should be avoided
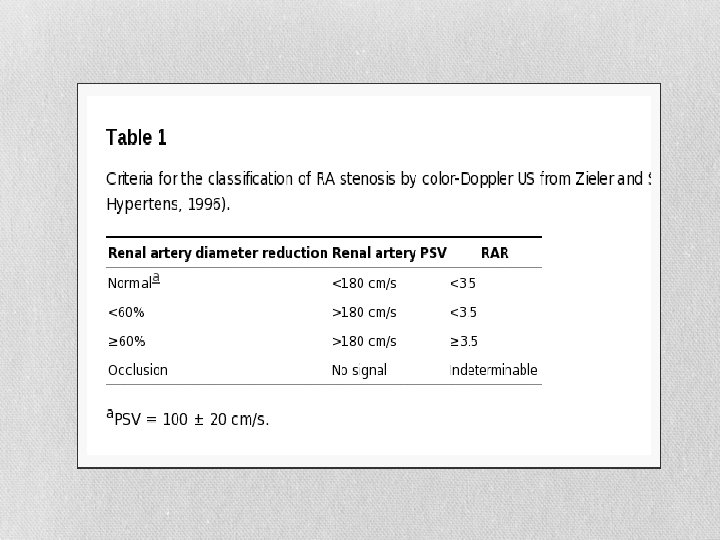
Proximal criteria (direct evaluation of the stenosis) • Four criteria are used to diagnose significant proximal stenosis or occlusion of a renal artery: • (a) An increase in peak systolic velocity in the renal artery (in the literature, the threshold for significant RAS is 180 -200 cm/sec); • (b) a renal-to-aortic ratio of peak systolic velocity greater than 3. 5; • (c) turbulent flow in the poststenotic area; • (d) visualization of the renal artery without detectable Doppler signal, a finding that indicates occlusion.
• DIRECT • Assessing the renal artery from the aorta to the kidney and any accessory arteries for any stenosis. • A stenosis is important when it is more than 60%. In this case, the stenosis produces a significant decrease in renal blood flow. • A >60% stenosis is reported when there is a >3. 5: 1 Renal to Aortic Ratio (RAR) or a >180 cm/sec velocity in the renal artery at any point from the origin to the kidney. • An end-diastolic velocity greater than 150 cm/s suggests a degree of stenosis greater than 80%.
• The use of the RAR instead of the absolute PSV value is preferable since hypertension itself can cause increased PSV velocities in all the vessels in hypertensive patients • Peak Systolic Velocity in the Aorta -taken above the level of the renal arteries origin. • If PSV obtained in the prerenal abdominal aorta is abnormally low (less than 40 cm/s), RAR cannot be used. • Taken with and without an angle for a ratio with the renal artery. • Renal Artery Assessment- initially with colour Doppler. • Renal Artery Spectral Analysis- Origin, Proximal, Mid and Distal Artery. • If a stenosis is suspected then a velocity with an angle and a measurement with no angle to compare with the aorta to give a ratio (>3. 5: 1 is a >60% stenosis which is haemodynamically significant)
Normal waveform A normal waveform obtained from the main renal artery demonstrates a rapid upstroke in systole and a low resistance waveform with continuous forward flow throughout the cardiac cycle. The normal peak systolic velocity of the main renal artery is less than 150 cm/sec. The resistive index is less than 0. 70.
• Doppler spectrum from the proximal left renal artery shows flow acceleration of close to 300 cm/sec
• The false-negative causes of the renal artery PSV are as follows: • (1) moderate RAS, highly severe RAS, or diffuse or segmental RAS; • (2) RAS with ipsilateral renal atrophy; • (3) patients with an ipsilateral patent accessory artery or abundant collateral vessels; • (4) RAS combined with stenoses of distal primary branches or intrarenal arteries; • (5) patients with infrarenal aorta stenosis or severe stenosis or occlusion of the bilateral iliac artery. • False-positive findings occur more often in young patients and in patients with hyperthyroidism or a tortuous renal artery. Severe stenoses or occlusions of multiple branches of the brachiocephalic trunk also increase the chances of a false-positive finding.
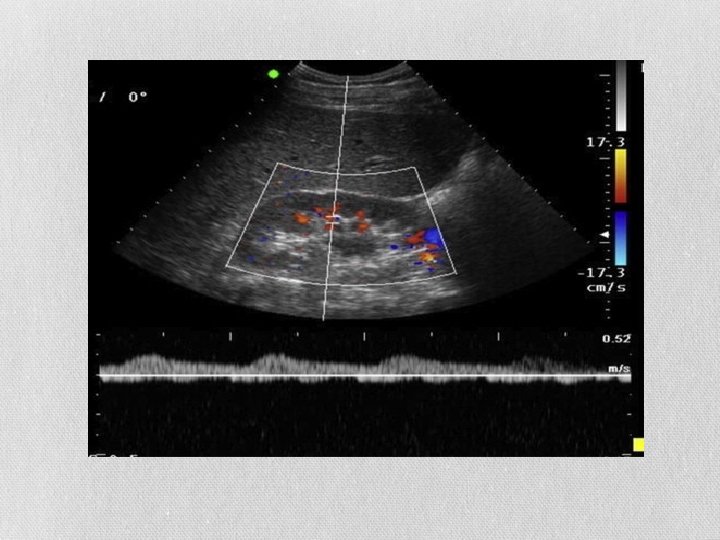
Indirect method • The segmental renal arteries are evaluated by means of a translumbar approach. • Therefore, technical failure occurs in only 0%– 2% of kidneys studied. The different segments of the kidneys must be scanned systematically to detect a stenosis of a segmental or accessory renal artery
• INDIRECT • Assessing the arteries within the kidney parenchyma to assess any alteration in the waveforms. • The RI should be low resistance. • The Acceleration Time (AT) should be <70 msec. • The probe is slowly moved superior and inferior to search for additional renal arteries. Any vessels identified must be traced to the kidney to confirm their identity.
RIs and ATs (RESISTIVE INDEX AND ACCELERATION TIME) Resistive Index Acceleration Time The Resistive Index (RI)is easily performed The Acceleration Time (AT) is done by by placing a caliper on the early systolic peak placing a caliper on the level at which the gradient begins to rise and finished at the (ESP)and the other caliper on the lowest first peak ie the Early systolic Peak diastole. The RI is a ratio of peak systolic and (ESP). This should be less than 70 ms end diastolic velocity.
• Normal Doppler waveform with straight early upstroke and high compliance peak. One should measure acceleration along the initial portion of the upstroke (dotted line), avoiding the compliance peak.
An indirect assessment requires a good colour image to determine the position of the interlobar and interlobular arteries, which in turn will determine the best angle to get an accurate measurement of the RI and AT. This is a normal spectral trace of an interlobar (segmental) artery
• A dampened appearance (tardus–parvus) of an intrarenal doppler waveform indicates stenosis and show a slow rise to the peak systole. • This phenomenon has been called the “tardus–parvus” effect. • Tardus means slow and late and parvus means small and little. • Tardus refers to the fact that systolic acceleration of the waveform is slow with consequent increase in time to reach the systolic peak. Parvus refers to the fact that the systolic peak is of low height, indicating a slow velocity. • However, although the presence of this finding is helpful in forming the diagnosis, its absence does not exclude RAS. In patients with atherosclerosis, vessel compliance may be reduced, making the parvus– tardus waveform morphology less obvious. • The presence of an early systolic peak can be interpreted as a sign of normality; however, the absence of an early systolic peak does not necessarily indicate stenosis
• Several quantitative criteria have been proposed for detection of significant RAS: (a) acceleration of less than 370– 470 cm/sec, (b) time of acceleration greater than 70 msec, (c) acceleration index (AI) lower than 3 m/s 2. (d) change in resistive index of greater than 5% between the right and left kidneys. ( > 0. 05 -0. 07 ) • (e) difference between the kidneys in pulsatility index > 0. 12. • • • The early systolic acceleration seems to be the best predictor of RAS. This quantity should be measured along the initial portion of the systolic rise and should not include the late compliance peak.
• Many factors influence systolic acceleration and may make the test non-specific. • Extrarenal factors such as aortic and mitral valvular diseases, left ventricular dysfunction or even cardiovascular medication might affect systolic acceleration. • Numerous factors, such as age, hypertension and diabetes affect vessel compliance.
• Moreover, the evaluation of the resistive index (RI) at Doppler US may be very useful in RAS affected patients for predicting the response to revascularization. • AT <70 msec and RI >0. 8 indicate for chronic renal disease and not suitable for revascularization and symptoms and urinary values do not improve after stenting in patients with elevated RI > 0. 80.
• Doppler waveform patterns. Types A and B represent normal Doppler spectra. In type A, a peak is present at the end of the early rise. In type B, no peak is present but the rise remains straight. Note that waveform VI is considered normal despite the high compliance peak; this particular type is most commonly seen in young patients. Type C represents abnormal spectra with varying degrees of a slowed early rise.
• When combined morphologic and quantitative criteria are used, the sensitivity for detection of RAS 70% or greater in diameter is 72%– 92%.
• Intrarenal Doppler spectrum shows a waveform with a pulsus tardus configuration, which indicates severe hemodynamic repercussions
• Renal-interlobar ratio (RIR) or renal-segmental ratio (RSR) : • RIR is potentially the best velocity parameter in the diagnosis of RAS of 50% or greater. • Beacause , practically, the PSV in the abdominal aorta is affected by other factors, such as heart diseases and lower extremity arterial diseases. • Moreover, it may still remain unaffected even if the severity of RAS varies. • On the contrary, the renal artery PSV increase and the interlobar artery PSV decrease with the increasing severity of RAS. • This implies that the RIR is better than the RAR in diagnosis of RAS because more substantial changes could be displayed in the RIR
• Its optimal threshold value is 5. • The combination of an RIR greater than 5 and interlobar artery PSV less than 15 cm/s provides the best diagnostic efficiency of RAS. • Renal ratio (RRR), which was defined as the rate between renal artery peak systolic velocity (RPSV) at the proximal or mid segment of the RA and RPSV measured at the distal segment of the renal artery is another new parameter. • The best estimated cut-off value for the new RRR was 2. 7. • The RRR values, when compared to the other direct-method parameters (PSV > 200 cm/s and RAR > 3) showed a sensitivity and specificity of 97% and 96%, respectively.
• Severe stenosis of the middle segment of the right renal artery in a 58 -year-old woman. A, The renal artery PSV at the stenotic site is 438 cm/s, and the RAR is 5. 1 (438/86). B, Spectral analysis of the ipsilateral interlobar artery shows typical abnormal changes: PSV measures 14 cm/s; systolic acceleration time measures 0. 18 seconds, and resistive index measures 0. 43. The RIR is 31. 3 (438/14). C, The middle segment of the right renal artery is confirmed to have severe stenosis (arrow) by renal angiography.
• Accessory renal arteries and bowel gas interposition are the main limiting factors in direct scanning of the renal arteries. • Therefore, recent studies have demonstrated mixed results, with sensitivities of 0%– 93% for detection of RAS