Pathways to Scientific Teaching Day Time Models and


 • Guiding Question: How should the novice-expert continuum influence our")
 • Guiding Question: How should the novice-expert continuum influence our")
 Data collect, represent, analyze Describe, interpret,")


,")


 Informal vs. Formal Groups Which will you use in")

 Informal vs. Formal Groups Which will you use")


 Individual Response 1 Group Discussion Individual Response 2")


 Data collect, represent, analyze Reason, interpret,")


![Q 5 on Quiz Q 5 [Class 5, Obj 2/3] As stated above, the](https://slidetodoc.com/presentation_image/6072fadf1136675e4bc7984cc1f9ffe0/image-40.jpg "Q 5 on Quiz Q 5 [Class 5, Obj 2/3] As stated above, the")


")
. Are MRSA")
 skin of a patient who")


- Slides: 78
Pathways to Scientific Teaching Day Time Models and Assessment 6 November 2017
Work with your team Course Teams – create a few ppt slides for explaining. • Course Name: at intro level (1 st or 2 nd tier) • Paper citation: • List core concept(s) or phenomena that are evident in that paper and align with the big ideas. • Search for misconceptions about concepts in literature – list applicable ones. • Examine the paper in terms of data – are there data students can work with – provide one example (e. g. , a graph).
Objectives 1. Build a scientific model and show it links HPL – How People Learn. 2. Identify students’ misconceptions and connect to assessments. 3. Experience a 5 E Instructional Design. 4. Identify core ideas and practices in selecting a biology paper and connect to the expert-novice continuum.
Engage: How DO experts differ from novices?
Report Out – HPL Chapter 2 • Guiding Question: How should the novice-expert continuum influence our course design and daily class meeting lessons? 1. Experts notice features and meaningful patterns of information that are noticed by novices. 2. Experts have acquired a great deal of content knowledge that is organized in ways that reflect deep understanding of their subject matter
Report Out – (2) • Guiding Question: How should the novice-expert continuum influence our course design and daily class meeting lessons? 3. Experts’ knowledge cannot be reduced to sets of isolated facts or propositions, but, instead reflects contexts of applicability: - “conditionalized”. 4. Experts are able to flexibly retrieve important aspects of their knowledge with little attentional effort.
Report Out – (3) • Guiding Question: How should the novice-expert continuum influence our course design and daily class meeting lessons? 5. Although experts know their disciplines thoroughly, this does not guarantee that they are able to teach others. 6. Experts have varying levels of flexibility in their approach to new situations.
build, use, revise Arguments claim, evidence, warrant (reason) Data collect, represent, analyze Describe, interpret, evaluate Models Explanations Collaboration Explore: Practice-based Biology Long, T. 2015. PLB Michigan State University
Backward Design Identify desired goals/objectives Determine acceptable evidence Design learning experiences and instruction Wiggins and Mc. Tighe 2005
Bloom’s Taxonomy: A Nested Hierarchy Higher-level cognitive skills • From the MSU Liberal Learning Goals: Synthesis & Evaluation Analysis Application Comprehension • Analytical Thinking – e. g. , acquires, analyzes, and evaluates information from multiple sources Knowledge Lower-level cognitive skills
Radish Problem Experimental setup: Weighed out 3 batches of radish seeds each weighing 1. 5 g. Experimental treatments: 1. 2. 3. 4. Seeds placed on DRY paper towels in LIGHT Seeds placed on WET paper towels in DARK Seeds placed on DRY paper towels in DARK in Ebert-May D, Batzli J, Lim H. 2003. Bioscience 53: 1221 -1228.
Course Source • http: //www. coursesource. org/
Within Teams • Share ideas of possible topics for an introductory biology (cell/molecular, organismal/population), genetics, ecology, evolution course based on the papers you found for this week. • Write topics on white boards - record
Objectives 1. Peer review assessments and objectives of lessons. 2. Create rubrics for scoring models.
Today 1. Write learning objectives for lesson. Include scientific practices. 2. Develop assessments that are aligned with the objectives.
Team Report Design instruction for lesson using 5 -e framework. A. B. C. D. E. One slide for Objectives (include paper citation) One slide EACH for the 5 -es. Include the question, activity, task, assessment. Select one activity to do with the class. Include formative assessments Put in Dropbox before class
Report Out • Tanner, K. 2010. Order Matters: Using the 5 E model to align teaching with HPL • Guiding Question: What is the link of the 5 E model to HPL? Engage Explore Explain Elaborate Evaluate
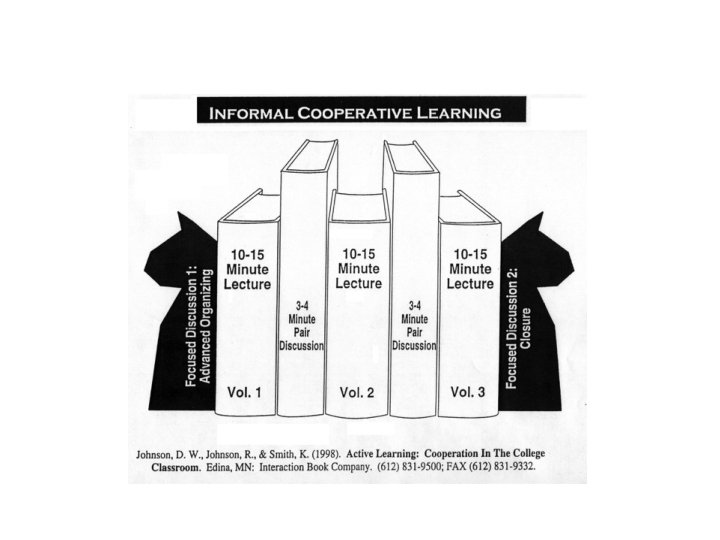
Cooperative Groups (from Smith, Johnson) Informal vs. Formal Groups Which will you use in your course and why?
Engage: Reality Check: Q 1. What are your experiences with “group learning”? Discuss in your team Report out
Explore: Cooperative Groups (from Smith, Johnson) Informal vs. Formal Groups Which will you use in your course and why?
Cooperative Learning is instruction that involves people working in teams to accomplish a common goal, under conditions that involve both positive interdependence (all members must cooperate to complete the task) and individual and group accountability (each member is accountable for the complete final outcome).
Teamwork 24 Karl A. Smith, PKAL workshop presentation, 9/20/2008
How can we maximize our likelihood of achieving cooperation?
Tip 1. Backward Design the construct of your group! • What is your goal for implementing groups? What purpose will the group serve in the context of the course? • How long, and in what contexts will they work together? • Design the group in the most effective and efficient manner for the goal.
Establishing the Group Selfselect Group Advantages? Disdvantages? Random Methods? Assign Intentional Maximize Diversity
Heterogeneity in groups is good. • Demographics: Age, class, gender, ethnicity • Experience or background: content expertise • Skills: task, cognitive, processing, etc. • Personality, personal characteristics
Tip 2. Mix it up! • Consider reorganizing groups ONLY IF it serves your intended goal for groups. • Diversify tasks and nature of interactivity.
Clickers with Peer Instruction (Eric Mazur) Individual Response 1 Group Discussion Individual Response 2
In-class Problems, Active Homework • Rotate roles among group members
Pyramid Exams • 2 -Part Exam • Score represents both Individual and Group Individual Exam Turn in Group Exam
Projects • Papers • Public Service Announcements • Innovation with other media
build, use, revise Arguments claim, evidence, warrant (reason) Data collect, represent, analyze Reason, interpret, evaluate Models Explanations Collaboration Practice-based Biology . . . MAD Bio!! Long, T. 2015. PLB Michigan State University
Pathways to Scientific Teaching Saturday AM Assessments Drive Instruction 7 October 2017
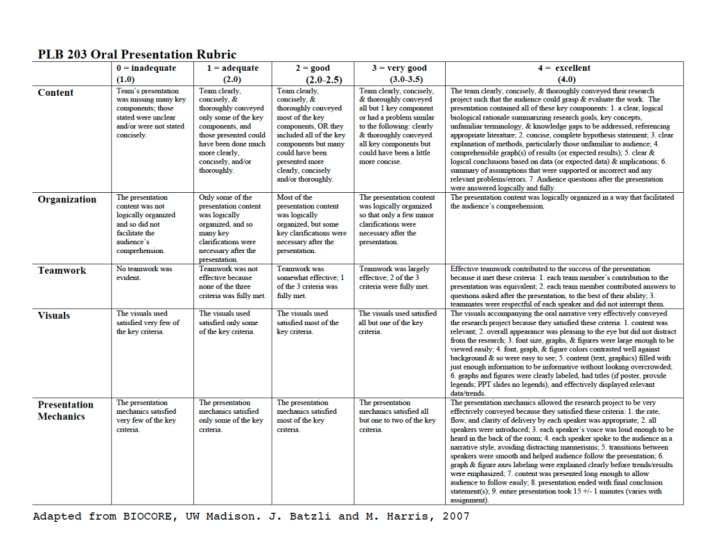
What the heck is a rubric?
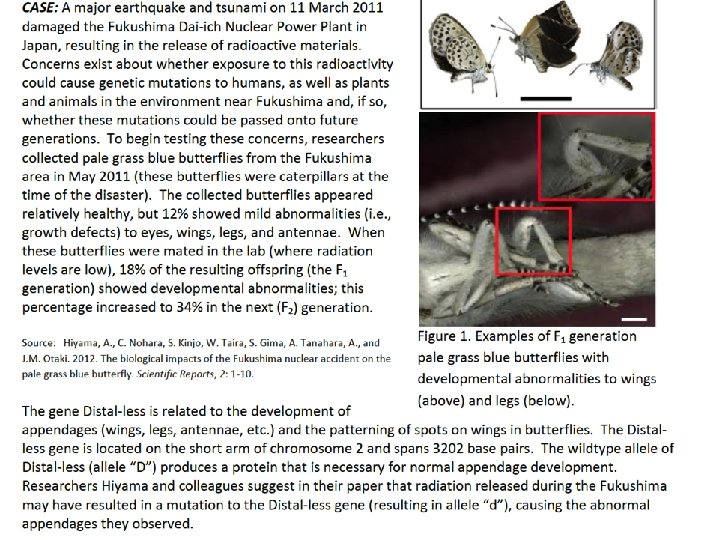
CASE on Quiz 1 • • • CASE: A major earthquake and tsunami on 11 March 2011 damaged the Fukushima Dai-ich Nuclear Power Plant in Japan, resulting in the release of radioactive materials. Concerns exist about whether exposure to this radioactivity could cause genetic mutations to humans, as well as plants and animals in the environment near Fukushima and, if so, whether these mutations could be passed onto future generations. To begin testing these concerns, researchers collected pale grass blue butterflies from the Fukushima area in May 2011 (these butterflies were caterpillars at the time of the disaster). The collected butterflies appeared relatively healthy, but 12% showed mild abnormalities (i. e. , growth defects) to eyes, wings, legs, and antennae. When these butterflies were mated in the lab (where radiation levels are low), 18% of the resulting offspring (the F 1 generation) showed developmental abnormalities; this percentage increased to 34% in the next (F 2) generation. Source: Hiyama, A. , C. Nohara, S. Kinjo, W. Taira, S. Gima, A. Tanahara, A. , and J. M. Otaki. 2012. The biological impacts of the Fukushima nuclear accident on the pale grass blue butterfly. Scientific Reports, 2: 1 -10. The gene Distal-less is related to the development of appendages (wings, legs, antennae, etc. ) and the patterning of spots on wings in butterflies. The Distal-less gene is located on the short arm of chromosome 2 and spans 3202 base pairs. The wildtype allele of Distal-less (allele “D”) produces a protein that is necessary for normal appendage development. Researchers Hiyama and colleagues suggest in their paper that radiation released during the Fukushima may have resulted in a mutation to the Distal-less gene (resulting in allele “d”), causing the abnormal appendages they observed.
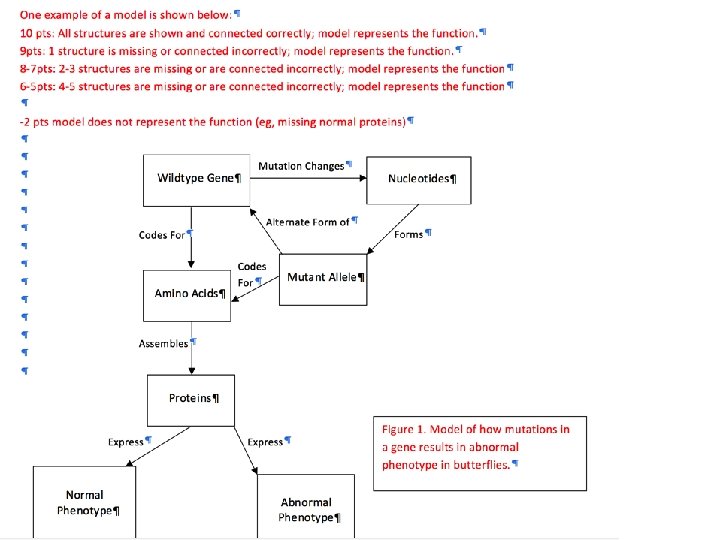
Q 5 on Quiz Q 5 [Class 5, Obj 2/3] As stated above, the normal protein Distalless facilitates normal appendage development in butterflies. A. [10 pts] In the space below, construct a box and arrow model that shows the following function: For Distal-less, how genes result in the production of proteins and corresponding phenotypes (traits) in the pale grass blue butterfly case. Use the following concepts in your model: allele, gene, amino acid, nucleotides, phenotype, protein, mutation. Be sure to include appropriate word/phrases for the processes/behaviors next to the arrows that show the connection between two concepts/structures in your model, as they apply to this case. You may use the concepts more than once. B. [2 pts] Write a figure legend for the model.
Rubric Performance? Criteria? Each group construct a rubric on whiteboard.
A
B
C
D
We built a tool to help characterize write assessments 3 D-LAP 3 -Dimensions Learning Assessment Protocol
Brewer et al 2011 NRC, 2012
Case-based Exam 2005. Science 307: 1959 -1961
Synopsis from Croll et al. 2005
Here is the assessment 1. Make two different models that illustrate the trophic relationships in this subarctic ecosystem, (1) for islands with no foxes, and (2) for islands with foxes. 2. Based on the information in reading and models you created above, make two graphs that predict the following – remember to label the axes. (i) biomass of the plants on the fox free islands vs. foxinfested islands (ii) nitrogen composition of dominant plants on fox-free islands vs. fox-infested islands.
Models 1. Provide an event, observation, or phenomenon
Here is the assessment 1. Make two different models that illustrate the trophic relationships in this subarctic ecosystem, (1) for islands with no foxes, and (2) for islands with foxes. 2. Based on the information in reading and models you created above, make two graphs that predict the following – remember to label the axes. (i) biomass of the plants on the fox free islands vs. fox-infested islands (ii) nitrogen composition of dominant plants on fox-free islands vs. fox-infested islands.
Models 1. Provide an event, observation, or phenomenon Islands with foxes, islands without foxes etc.
Models 1. Question gives an event, observation, or phenomenon for the student to explain or make a prediction about. 2. Question asks student to use or construct a representation to explain or predict the outcome the even, observation or phenomenon.
Here is the assessment 1. Make two different models that illustrate the trophic relationships in this subarctic ecosystem, (1) for islands with no foxes, and (2) for islands with foxes. 2. Based on the information in reading and models you created above, make two graphs that predict the following – remember to label the axes. (i) biomass of the plants on the fox free islands vs. fox-infested islands (ii) nitrogen composition of dominant plants on fox-free islands vs. fox-infested islands.
Models 1. Question gives an event, observation, or phenomenon for the student to explain or make a prediction about. 2. Question asks student to use or construct a representation to explain or predict the outcome the even, observation or phenomenon. Construct two different models that illustrate the trophic relationships in this subarctic ecosystem
Models 1. Question gives an event, observation, or phenomenon for the student to explain or make a prediction about. 2. Question gives a representation or asks student to construct a representation. 3. Question asks student to provide the reasoning that links the representation to their explanation or prediction.
Here is the assessment 1. Make two different models that illustrate the trophic relationships in this subarctic ecosystem, (1) for islands with no foxes, and (2) for islands with foxes. 2. Based on the information in reading and models you created above, make two graphs that predict the following – remember to label the axes. (i) biomass of the plants on the fox free islands vs. fox-infested islands (ii) nitrogen composition of dominant plants on fox-free islands vs. fox-infested islands.
Models 1. Question gives an event, observation, or phenomenon for the student to explain or make a prediction about. 2. Question gives a representation or asks student to construct a representation. 3. Question asks student to provide the reasoning that links the representation to their explanation or prediction.
Here is the assessment - revised 1. Make two different models that illustrate the trophic relationships in this subarctic ecosystem, (1) for islands with no foxes, and (2) for islands with foxes. Write a figure legend the models. Provide the reasoning that links the model to your explanation. 2. Based on the information in reading and models you created above, make two graphs that predict the following – remember to label the axes. (i) biomass of the plants on the fox free islands vs. fox-infested islands (ii) nitrogen composition of dominant plants on fox-free islands vs. fox-infested islands.
Do animal antibiotics pose a threat? http: //www. cbsnews. com/videos/an imal-antibiotics-a-threat/
What are bacteria? What are antibiotics? Figure 2. Staphylococcus aureus bacteria in groups. (Scanning electron micrograph, or SEM, from Nature Scitable 2012)
What are bacteria? What are antibiotics?
Q 1. Are all these bacteria the same? (Be as specific as you can)
Q 2. Suppose this SEM image is of MRSA (methicillinresistant Staphylococcus aureus). Are MRSA bacteria different from non-resistant S. aureus bacteria? Make this table and fill in with your team. Characteristic DNA Gene(s) Allele(s) Phenotype Same or different? How?
MRSA: Some facts Figure 1. MRSA progresses rapidly. A) skin of a patient who noticed a red rash and sought treatment immediately. B) skin of a patient who did not seek treatment until a bump (abcess) burst.
MRSA: Some facts Total cases Outpatient clinics, longterm health care Community Hospitals CDC, 2103 Interpret data: Where did most patients acquire MRSA from 2005 -2011?
MRSA: Some facts Waters et al. 2011, Clinical Infectious Diseases Figure 3. Incidence of S. aureus contamination and multi-drug resistant S. aureus in U. S. meat supply.
Q 3. Predict what you would observe if you cultured MRSA and non-resistant S. aureus, each in their own petri dish containing methicillin. Q 4. Make a scientific claim about your observation.
Antibiotic resistance: Lab experiment
Antibiotic resistance: Lab experiment Wikimedia Commons
Antibiotic resistance: Lab experiment Antibiotic applied to both Petri dishes: which one is MRSA? Which one is non-resistant S. aureus? What is your evidence? A Bacterial colonies B
Q 5. To which antibiotic disc is the bacteria most susceptible? Write this as a scientific claim. Then describe the evidence supporting your claim. A D Each disc is a different antibiotic. B C
Constructing a scientific argument CLAIM: EVIDENCE:
What is a scientific argument? Essential Part Claim Evidence Reasoning/ Warrant Its Role A testable explanation or mechanism (about an observation) The data supporting the claim Justifies the evidence used
What’s happening in class? 1. Videos from the University of Georgia. Complete the video review form. https: //seercenter. uga. edu/realisevideos_immerse/ 2. Check out the Teaching Professor Web site – ”Three Common Demands from Students in Large Classes and What to Do about Them” https: //tomprof. stanford. edu/posting/1540 3. Reading: Seidel, S. B. , and K. D. Tanner. 2013. “What if Students Revolt? ” Considering Student Resistance: Origins, Options, and Opportunities for Investigation. CBE-Life Sciences Education 12 (4): 586– 595. Question to Guide Reading: How does a transformed class address resistance?
Videos of Teaching 1. What are the students doing? 2. What is the teacher doing? • Is the instructor doing something that the students should do themselves? • Is there value in having the students complete this task? • Is the classroom learner-centered? Evidence?