Nerf NStrike Claims to Fire 75 feet Fake


 1 12. 611 m 2 12. 6873 m")


= ½ gt 2 + vy t")
 = 24. 92 Using Desmos Using the desmos")
= vx t t= time in the air v 0")


- Slides: 50
Nerf N-Strike Claims to Fire 75 feet! Fake News? Recognizing Connected Opportunities in Mathematics Supporting Standards & Mathematical Practices
Hear, See, Do And I forget, I understand, I remember. ◦ A person gathers , discovers or creates knowledge in the course of some purposeful activity set in a meaningful context. �Improve understanding and motivation.
Mathematical Practice From the Common Core Document under Mathematics: Standards for Mathematical Practice 4. Model with mathematics. “Mathematically proficient students can apply the mathematics they know to solve problems arising in everyday life, society, and the workplace. “
Context is Key… “They routinely interpret their mathematical results in the context of the situation and reflect on whether the results make sense, possibly improving the model if it has not served its purpose. ”
MATH IN CONTEXT Rules of Engagement Loss of: Depth Efficiency Elegance F S U C O MATH LOSS of : Width, Motivation, Applications WITH MATH
Project Based Learning�A Driving Question- drive critical and creative thinking! � Significant Content & Connects to Standards � Meaningful � Mock Scenario � Voice & Choice � 21 st Century Skills � Conduct Real Inquiry � Feedback & Revisions
Video Break � Dan Meyer-Math Class Needs a Makeover.
Projectile Motion Try to think of the “classic” projectile motion problems. How well do you think they connect to student interest? Can you think of something doable, fun and motivating while supporting the standards?
to the Rescue! � Product Testing � Collecting, modeling data � Teamwork � Parameters- controlled or not � Rich STEM connections
Teacher/Student What can we ask? What are some obstacles to consider ? What are some of your expectations? How will you make use of technology ? What do we know? What do we need to know? Do the results make sense? Can you identify sources of error?
Video Break! Engage! Real Time Cliff Jump Watch a few times, and think… what type of “problem” could you ask? Stick to your grade level or course. Engage, Explore, Explain, Extrapolate.
Engage/Explore and Explain through Virtual Technology: Explore Learning – Merges science and math- virtual lab experiencewww. Explorelearning. com Gizmos- Free Fall Tower , Golf Range, etc… You can sign up for a 1 -month free trial which gives you plenty of access to all features. Subscriptions are available $800? The Physics Classroom- http: //www. physicsclassroom. com/ FREE !!! Interactive, but not like the Gizmos. Excellent for the math teacher looking to improve their physics background.
Timeline for the Problem � Day 1 -2 � Free Fall Jump / 2 - Free Fall Tower Gizmo/ 3 - The Physics Classroom/ 3 - Golf Gizmo � Depending on student ability and background, this can take longer/shorter. You may opt to do all activities, or cut this back. � Day 3 - Determine firing velocity of a Launcher prerequisite work. � Do this as a class- review what the big idea is from the Golf Range Gizmo. Engage again with the Myth Busters video demonstrating the concept of dropping bullet and firing a bullet at 0 degrees and answering the question: Will they hit at the same time? ”
Timeline for the Problem � Day 4 -Determine the velocity of a “flick” � Opportunity for students to simulate what they will need to do for the Nerf/Halo toy. Gives opportunity for the teacher to debug. � Day 5 – option to work in Explore. Learning – Golf Gizmo/Free Fall Tower � Day 6 -10– Start testing/Problem Solving/write up results � READY?
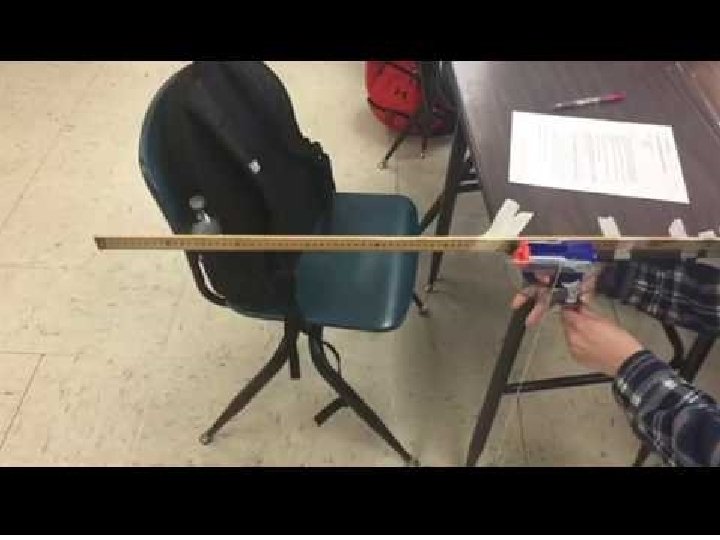
Product Testing: Nerf N-Strike � Your problem is to do some product testing on a popular child’s toy. The manufacturer of the Nerf N-Strike claims that the gun will shoot up to 75 feet. Your job is to verify that claim and defend your results.
From student exemplars www. mathizaverb. com
Finding firing velocity Trial Number X(t) 1 12. 611 m 2 12. 6873 m 3 11. 43 m 4 13. 31 m 5 13. 055 m
Firing at 45 o After using the firing velocity to predict the farthest distance it could travel, however that did not account for wind or air resistance, so some real test shots were necessary. After taking a good amount of test shots Trial Number Distance We got an average distance of 18. 33 m which is 60. 14 feet. Bullet 1 20. 15 m Not quite 75 but a closer Bullet 2 16. 9 m number than I was originally expecting. Seems like Nerf’s Bullet 3 18. 2 m claims are close to the truth. Bullet 4 18. 2 m Bullet 5 18. 2 m Avg Distance: 18. 33 m
The only problem that our experiment has not addressed is air resistance. The number that we got from our experiment are just extrapolated and a prediction. When actually performing the experiment the results will not be nearly that far as our math never accounted for drag. We performed the experiment and got closer data to the claim made by Nerf.
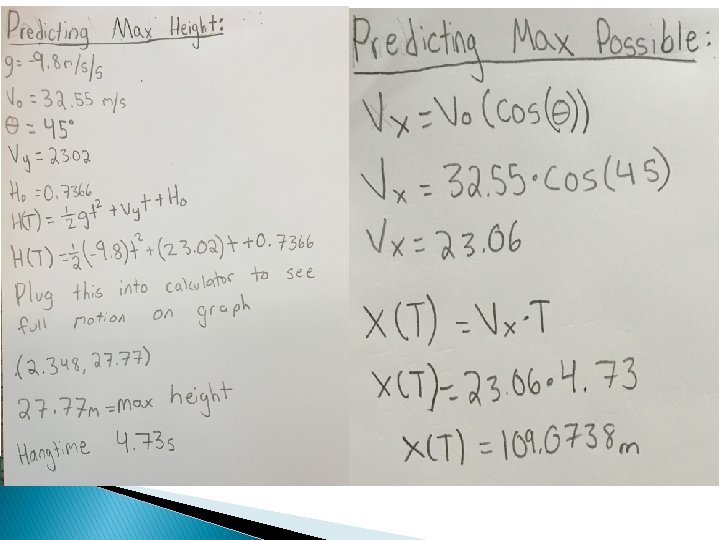
Calculating the Height of the Projectile Equation: H(t)= ½ gt 2 + vy t + H 0 H(t) = height at any time of the projectile g= gravity (-32 f/s/s) t= time in seconds of entire flight V 0= Initial velocity Vy = Vertical component of velocity using the equation: Vy = V 0 sin(��) H 0= Height of nerf gun initially Once you have all the data you can fill in the equation and it will look like: H(t)= -16 t 2 + 38. 3 t + 2 Which can then be plugged into the graphing function of your calculator. Once this is done you can find the maximum height of your projectile. You can also calculate the time it took to hit the ground. We found our maximum height to be 24. 9 ft at approximately 1. 19 seconds. It took approximately 2. 4 seconds for the bullet to hit the ground.
Y coor of Vertex or H(t) = 24. 92 Using Desmos Using the desmos graphing calculator I was able to graph the equation of the height of the projectile. By doing this I could see the complete behavior of the projectile from beginning to end. X-int = 2. 445 seconds
Calculate the Horizontal Position x(t)= vx t t= time in the air v 0 = initial velocity ��= firing angle vx= horizontal component of the velocity using the equation vx= v 0 cos(��) Calculations: x(t)= vx t x(t)= (38. 32519)(2. 448773) x(t)= 93. 84968 The bullet could fire approximately 94 feet.
In these images you can see how much drag effects the distance of the bullet. Although this is just an online exercise it is very effective in showing that drag depletes the distance the bullet will go. Air Resistance No Air Resistance
Conclusion: Is the claim right? The claim was that the N-Strike Elite could fire a nerf bullet 75 feet. Our final result was that the N-Strike Elite could fire a nerf bullet approximately 94 feet with no drag calculated. We do not know how the nerf company came up with their claim of how far the nerf bullet would shoot. This is an estimate that is reasonable when the gun is angled at 45° with no drag. The data we collected is unreasonable in the vertical but, reasonable in the horizontal. The answer calculated is most likely correct and reasonable if it were recalculated with the air resistance and drag.
After experimentation and “product testing” we have come to the conclusion that while the Nerf gun doesn’t shoot quite 75 feet, sixty feet is still a close number. Using physics and mathematics we were able to find the firing velocity and make our own predictions to what would happen is this experiment were to happen inside a vacuum. We were able to successfully complete this experiment and ended with a final number of a average max distance that the bullet can travel of 60 feet.
If I were to do this experiment again I wish there was a way to fire this gun in a vacuum to see if our predictions using the various equations would be correct. From this experience we were able to gain knowledge into how product testing occurs and also clarity to see how valid company's claims really are. Setting out to do our best work, our group worked diligently towards the goal of finding the max distance this gun could fire. Working with people that we hadn’t worked with all year was also a valuable experience. The project is intuitive and interesting and I believe that other kids in the future will enjoy doing it as well.
Keeping it in balance? Habits of mind Creative& Critical thinker standards Visual thinking Problem solving STEM ? assessments
Connected Opportunities Problem Solving Visual Thinking Creative &Critical Habits of Mind Standards NGLS Assessment
Working with DATA in Context � Use recent or current events, etc… � Tie to Science � Keep your eyes and ears open.
Ice, Ice Baby � Modeling ◦ ◦ ◦ ◦ ◦ Arctic Sea Ice –open questions When do you think sea ice will be gone? At what rate is it decreasing? How fast? What month is most important to study and why? Is Climate change real? Causes? Why is it important? How was it caused? Weather verses climate? Cryosphere- where is it ? Why is it important? World Politics?
STEM connections � Build content knowledge through research ◦ Internet research at NSIDC, NASA, NOAA ◦ Film : “NOVA: What’s Up with the Weather” � Build mathematical skills through activities and other related data sets ◦ Graphing calculator for small set, Excel for larger ◦ Interpolation, extrapolation, meaning of slope as an average rate of change.
www. mathizaverb. com
NASA Vital Signs
Engage/Explore/Explain � Global Temperature Changes ◦ Visual Engagement- What do the graphs show? ◦ What could we ask?
Explore/Explain Observations? What about local anomalies? Averaging? How is the data collected? Relative Extrema This graph illustrates the change in global surface temperature relative to 1951 -1980 average temperatures. The 10 warmest years in the 134 -year record all have occurred since 2000, with the exception of 1998. The year 2015 ranks as the warmest on record. (Source: NASA/GISS).
What’s happening where you live? What does the comparison show? Can you determine which graph is closest to the Arctic? Why? Not the same for everyone! Connect to previous images.
Data- Extend to sea ice question � Access the data and apply linear regression � NASA Vital Signs makes it easy to download data for analysis � Supports practice for working with large TXT files. Need for Excel. NSIDC data
Evaluate- When will sea ice be gone? � Apply knowledge to Arctic sea ice open ended question. � What month of data is best to examine and why? How does sea ice change over time? What are the impacts of this change? � Prepare your findings in present to the UN Committee on Climate Change Time for YOU to explore!
Video Break! Hans Rosling : Population Growth over 200 years. David Mc. Candless turns complex data sets (like worldwide military spending, media buzz, into beautiful, simple diagrams that tease out unseen patterns and connections.
Video Break! � RSA Animate-Ken Robinson � Hans Rosling : Population Growth over 200 years. q David Mc. Candless turns complex data sets (like worldwide military spending, media buzz, into beautiful, simple diagrams that tease out unseen patterns and connections. � Taylor Mali- just because
3 Elementary Examples What’s Hidden Inside? www. nasa. gov for educator resources How Big is the Sun? Eyeonthesky. org Program A Friend www. egfi-k 12. org
What’s Hidden Inside? Level 3 -5
Objectives � Gather data through observations � Make inferences about hidden items based on data collected � Develop a conclusion based on the data collected � VERBS◦ Predicting, observing, inferring, communicating � 30 min
How Big is the Sun? level 3 -5 § § Explore relative sizes of the Sun, Earth, and Moon Large scale models Compare using mathematical symbols of inequalities Diameter, measuring Done over 3 days, decorate classroom!
Assessment How many “Earths” does it take to cover the diameter of the Sun? How many Moons does it take to cover the diameter of Earth? How many Moons will it take to cover the Sun? How do we symbolize “greater than”?
Program a Friend level 1 -8 teachers. egfi-k 12. org Vernier Technology lab � Working in pairs, students learn basic computer programming and software engineering concepts by building an obstacle course, then steering a blindfolded friend through it by using a series of commands. They re-run the maze to improve on the “program. ” � Engineering Design Process: A series of steps to solve a complex problem Done without technology!
Engineering Design Process
Objective: After doing this activity, students should be able to: § Recognize that computer programs boil down to a series of yes/no commands. § Break a task or process into little steps. § Understand that making errors and correcting them is part of the iterative design process. § Improve on a product or process based on observations and field testing.