MODULE 8 Crop Nutrition 29 11 2020 1
- Slides: 90
MODULE 8 Crop Nutrition 29. 11. 2020 1
LESSON 1 Introduction to Crop Nutrition 29. 11. 2020 2
Outcomes 1. Define plant nutrition 2. Discuss the basic needs of plants 3. Define what fertilizers are 29. 11. 2020 3
Structure 1. Why crop nutrition is important 2. Why do plants need fertilizers 3. Explain the Liebig’s law of the minimum 29. 11. 2020 4
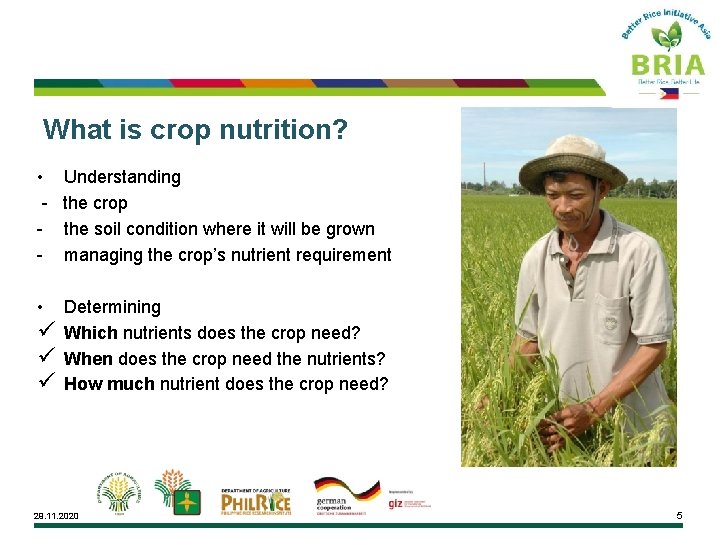
What is crop nutrition? • Understanding - the crop - the soil condition where it will be grown - managing the crop’s nutrient requirement • ü ü ü Determining Which nutrients does the crop need? When does the crop need the nutrients? How much nutrient does the crop need? 29. 11. 2020 5
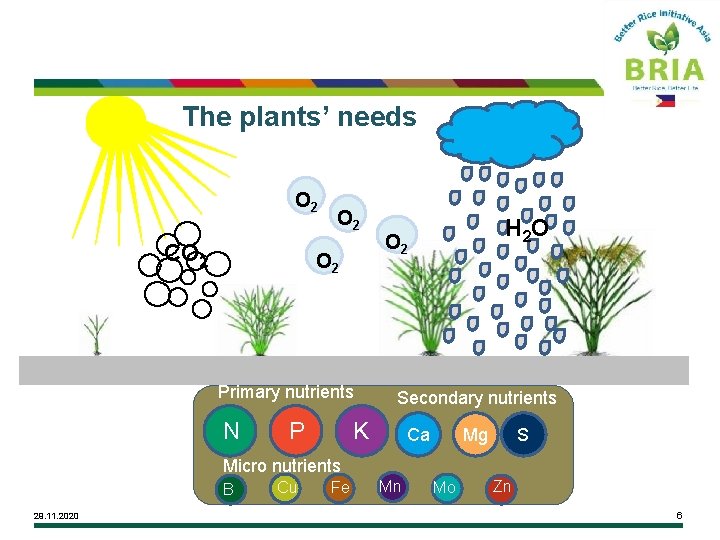
The plants’ needs O 2 CO 2 O 2 Primary nutrients N P H 2 O O 2 Secondary nutrients K Mg Ca S Micro nutrients B 29. 11. 2020 Cu Fe Mn Mo Zn 6
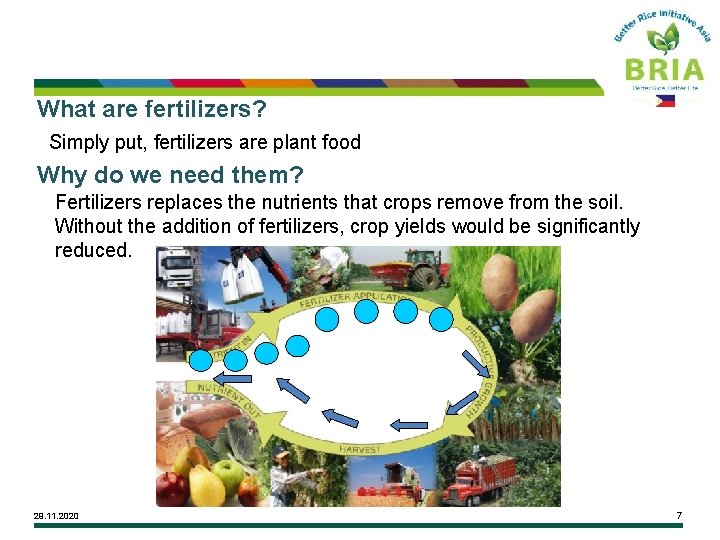
What are fertilizers? Simply put, fertilizers are plant food Why do we need them? Fertilizers replaces the nutrients that crops remove from the soil. Without the addition of fertilizers, crop yields would be significantly reduced. 29. 11. 2020 7
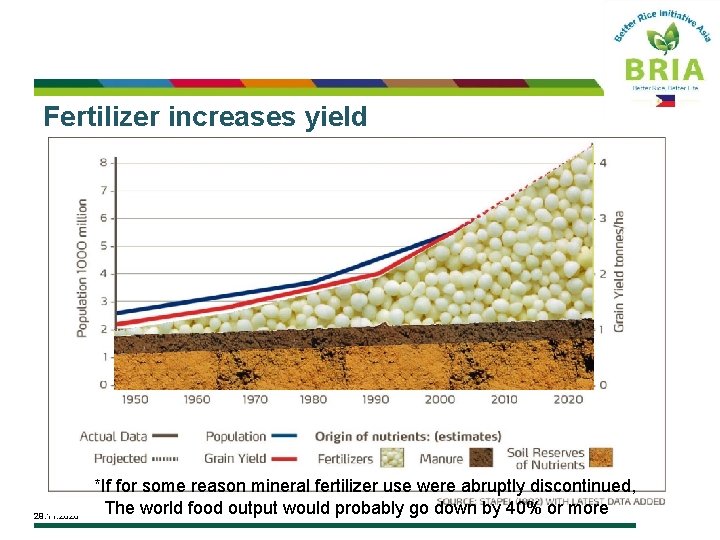
Fertilizer increases yield 29. 11. 2020 *If for some reason mineral fertilizer use were abruptly discontinued, The world food output would probably go down by 40% or more 8
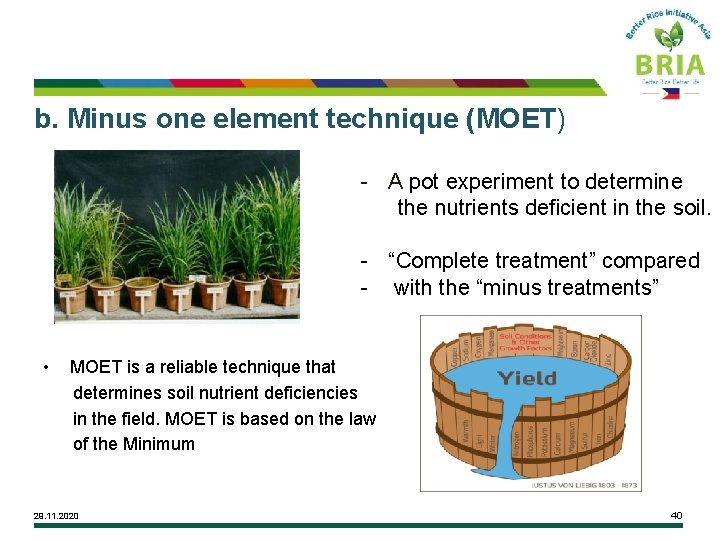
Liebigs law of the minimum 29. 11. 2020 9
LESSON 2 Understanding the soil 29. 11. 2020 10
Outcomes 1. Determine the types of soil 2. Discuss why cultivation is important 29. 11. 2020 11
Structure 1. Relationship of soil and crop productivity 2. Cross section of the soil 3. How cultivation affects the soil 29. 11. 2020 12
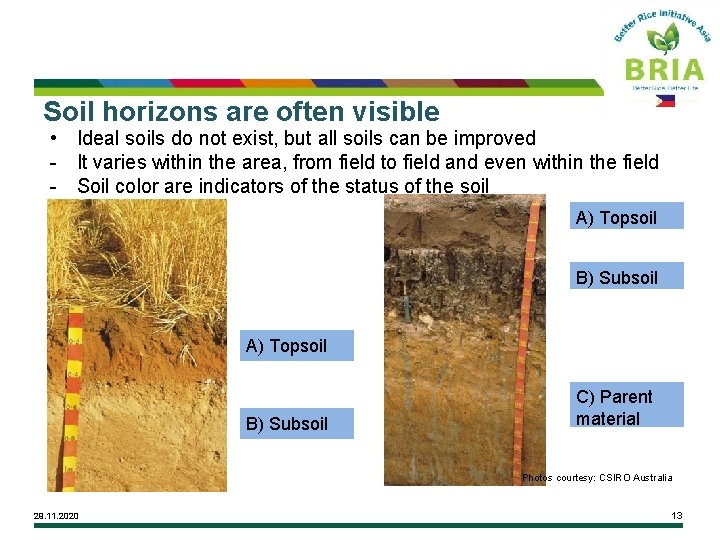
Soil horizons are often visible • Ideal soils do not exist, but all soils can be improved - It varies within the area, from field to field and even within the field - Soil color are indicators of the status of the soil A) Topsoil B) Subsoil C) Parent material Photos courtesy: CSIRO Australia 29. 11. 2020 13
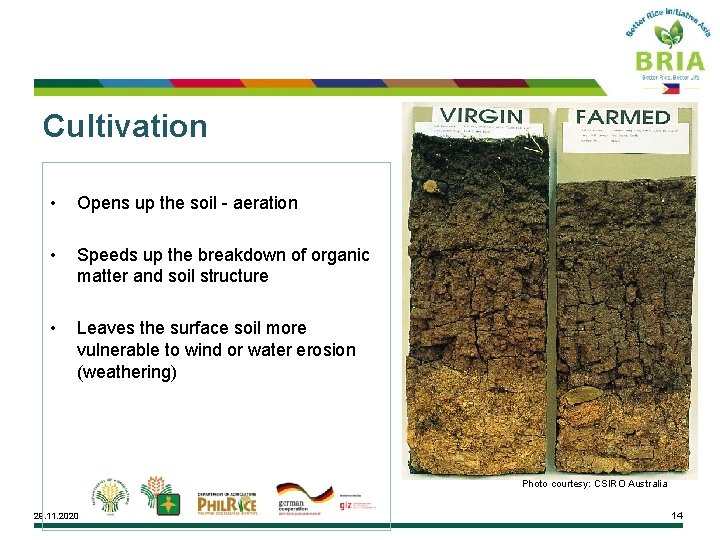
Cultivation • Opens up the soil - aeration • Speeds up the breakdown of organic matter and soil structure • Leaves the surface soil more vulnerable to wind or water erosion (weathering) Photo courtesy: CSIRO Australia 29. 11. 2020 14
LESSON 3 Physical Properties of the Soil 29. 11. 2020 15
Outcomes 1. Name and define the physical attributes/ characteristic of soil 2. Explain how such physical attributes affects soil fertility 29. 11. 2020 16
Structure 1. Learn about soil color 2. Learn about soil texture 3. Learn about soil structure 4. Learn about soil composition 29. 11. 2020 17
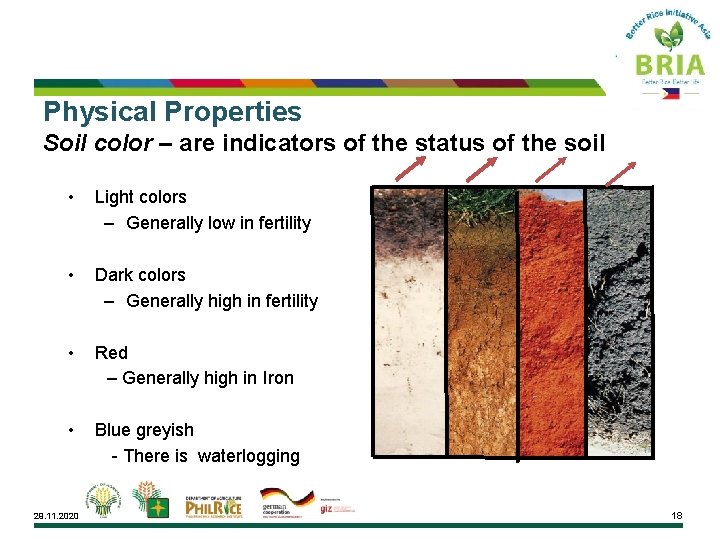
Physical Properties Soil color – are indicators of the status of the soil • Light colors – Generally low in fertility • Dark colors – Generally high in fertility • Red – Generally high in Iron • Blue greyish - There is waterlogging 29. 11. 2020 18
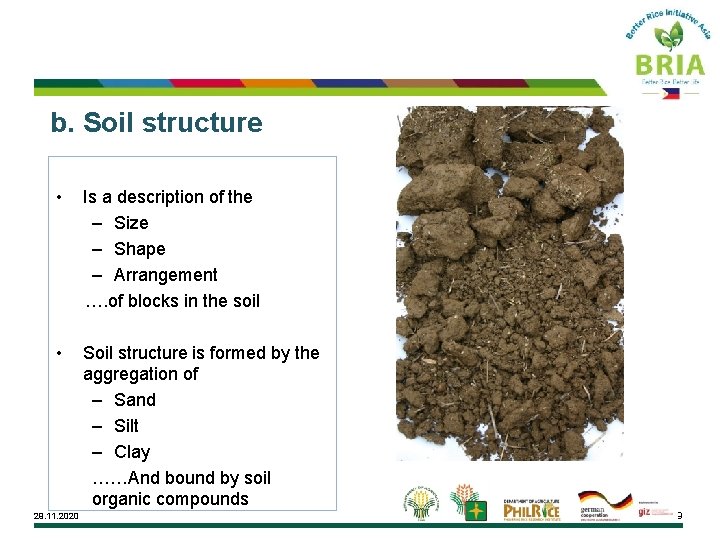
b. Soil structure • Is a description of the – Size – Shape – Arrangement …. of blocks in the soil • 29. 11. 2020 Soil structure is formed by the aggregation of – Sand – Silt – Clay ……And bound by soil organic compounds 19
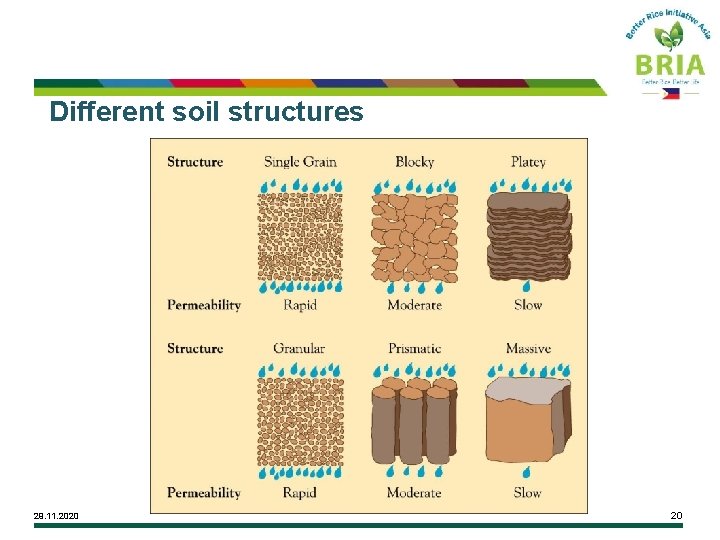
Different soil structures 29. 11. 2020 20
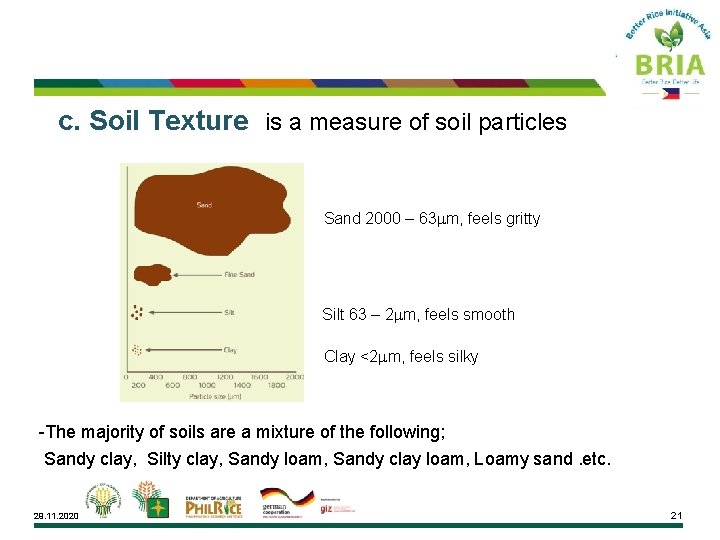
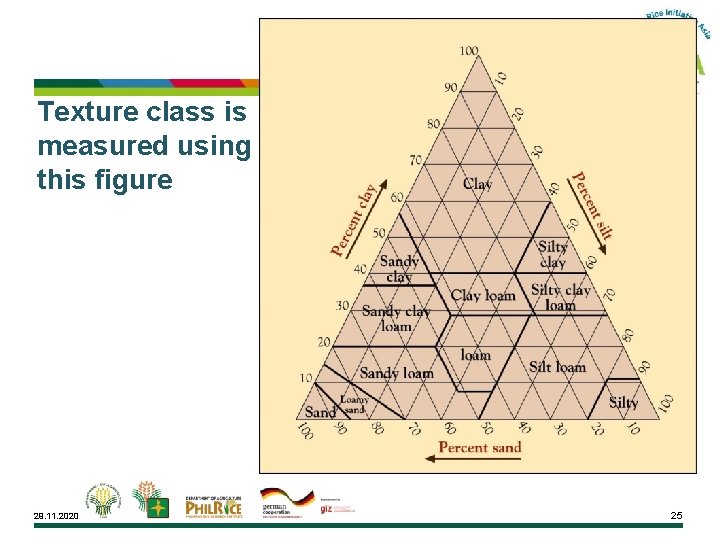
c. Soil Texture is a measure of soil particles Sand 2000 – 63 mm, feels gritty Silt 63 – 2 mm, feels smooth Clay <2 mm, feels silky -The majority of soils are a mixture of the following; Sandy clay, Silty clay, Sandy loam, Sandy clay loam, Loamy sand. etc. 29. 11. 2020 21
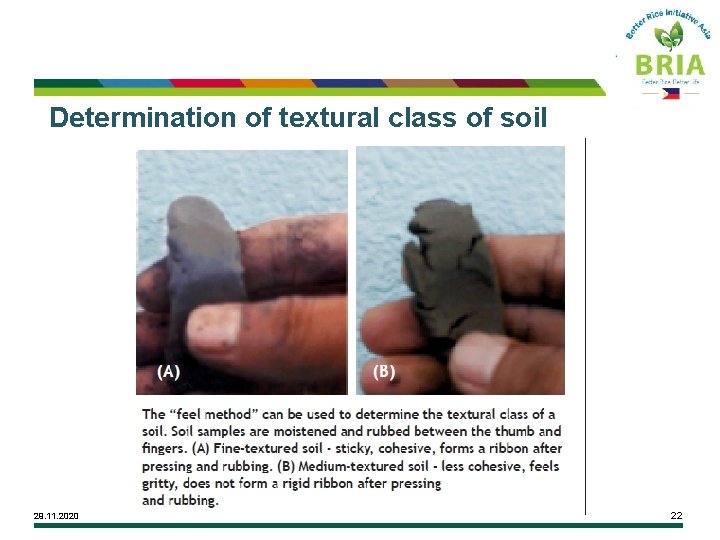
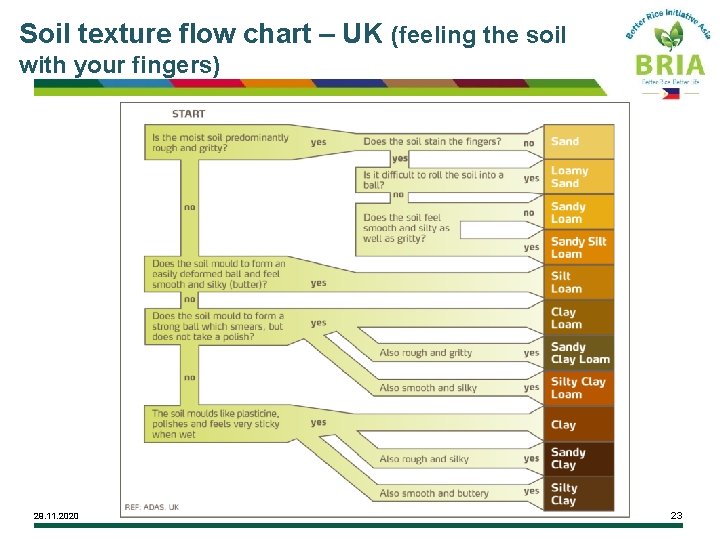
Determination of textural class of soil 29. 11. 2020 22
Soil texture flow chart – UK (feeling the soil with your fingers) 29. 11. 2020 23
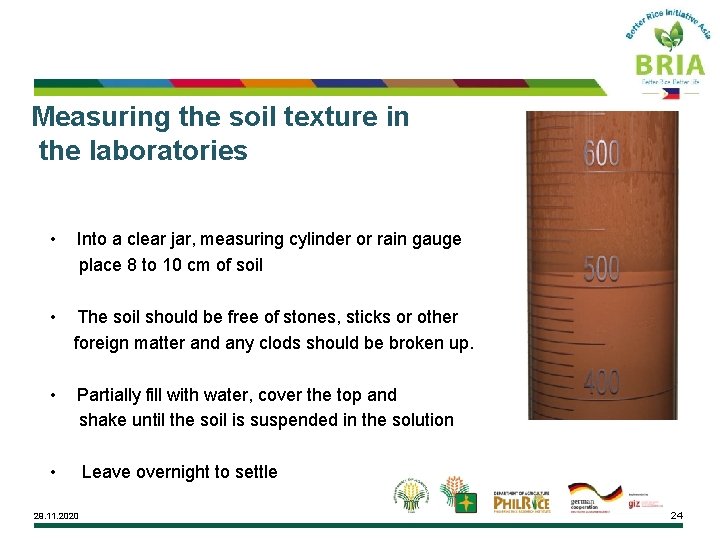
Measuring the soil texture in the laboratories • Into a clear jar, measuring cylinder or rain gauge place 8 to 10 cm of soil • The soil should be free of stones, sticks or other foreign matter and any clods should be broken up. • Partially fill with water, cover the top and shake until the soil is suspended in the solution • Leave overnight to settle 29. 11. 2020 24
Texture class is measured using this figure 29. 11. 2020 25
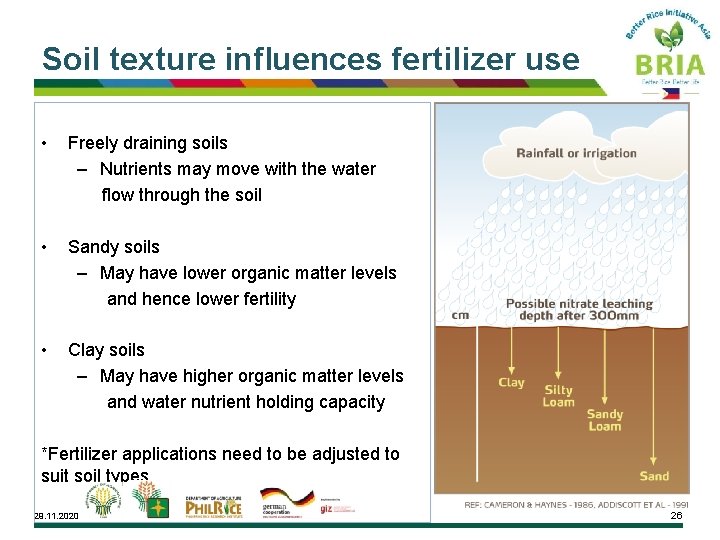
Soil texture influences fertilizer use • Freely draining soils – Nutrients may move with the water flow through the soil • Sandy soils – May have lower organic matter levels and hence lower fertility • Clay soils – May have higher organic matter levels and water nutrient holding capacity *Fertilizer applications need to be adjusted to suit soil types 29. 11. 2020 26
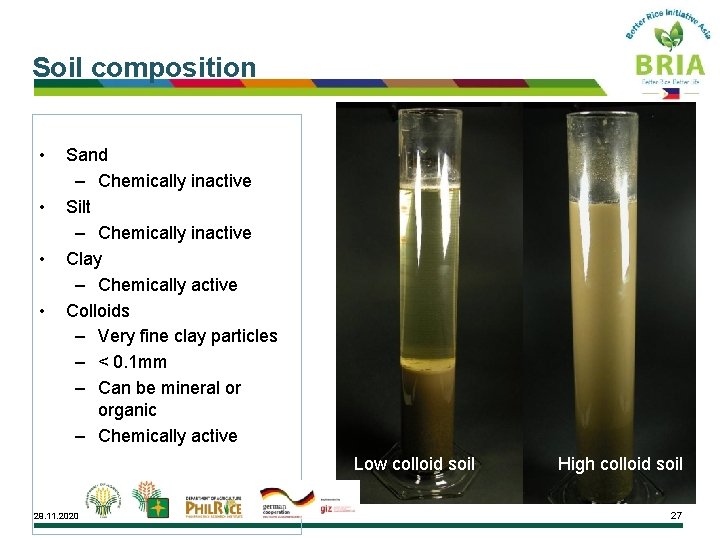
Soil composition • • Sand – Chemically inactive Silt – Chemically inactive Clay – Chemically active Colloids – Very fine clay particles – < 0. 1 mm – Can be mineral or organic – Chemically active Low colloid soil 29. 11. 2020 High colloid soil 27
LESSON 4 Chemical Properties of the Soil 29. 11. 2020 28
Outcomes 1. What ions are 2. Describe ion movements in the soil 3. Describe how nutrients are taken up by plants 4. Explain how soil acidity affects nutrient availability 29. 11. 2020 29
Structure 1. What ions are? 2. Nutrient retention and release 3. Nutrient uptake pathways 4. p. H level and nutrient availability 29. 11. 2020 30
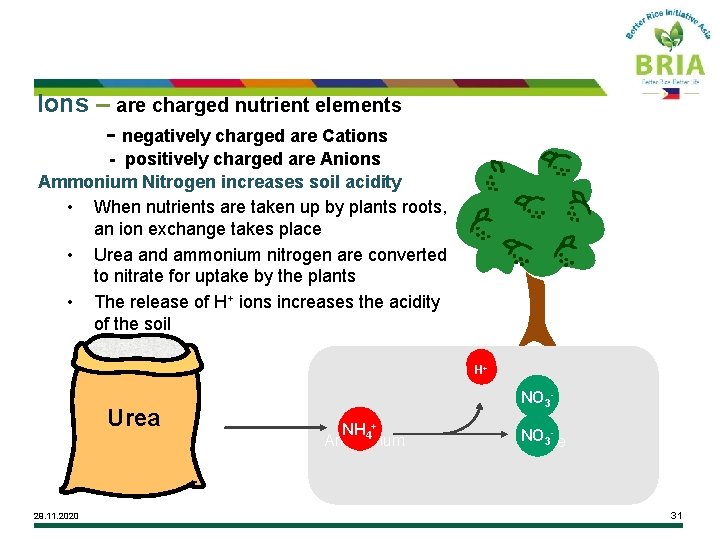
Ions – are charged nutrient elements - negatively charged are Cations - positively charged are Anions Ammonium Nitrogen increases soil acidity • When nutrients are taken up by plants roots, an ion exchange takes place • Urea and ammonium nitrogen are converted to nitrate for uptake by the plants • The release of H+ ions increases the acidity of the soil + H H++ Urea 29. 11. 2020 NO 3 NH 4+ Ammonium NO 3 Nitrate 31
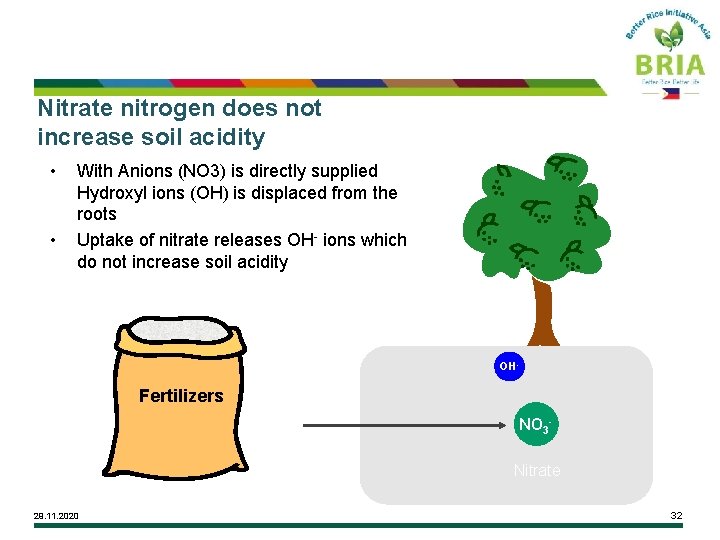
Nitrate nitrogen does not increase soil acidity • • With Anions (NO 3) is directly supplied Hydroxyl ions (OH) is displaced from the roots Uptake of nitrate releases OH- ions which do not increase soil acidity OH OH-- Fertilizers NO 33 -Nitrate 29. 11. 2020 32
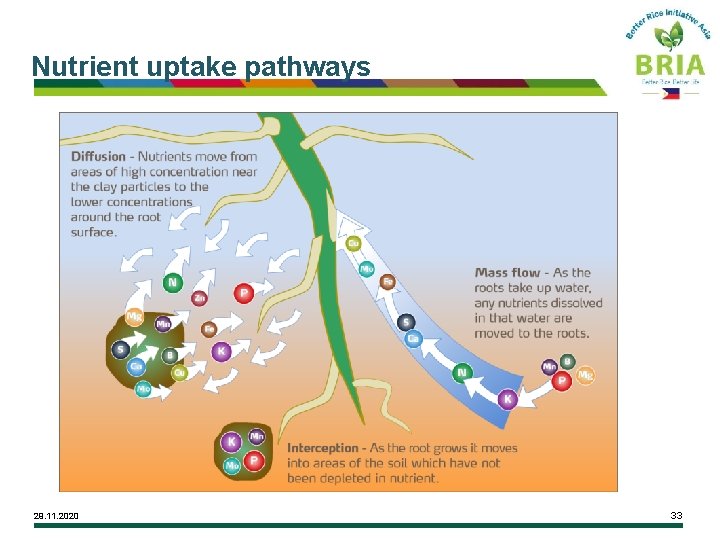
Nutrient uptake pathways 29. 11. 2020 33
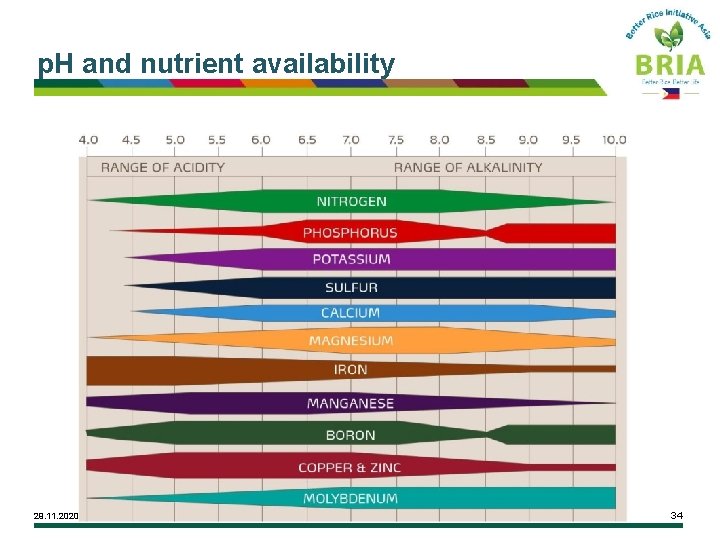
p. H and nutrient availability 29. 11. 2020 34
Al becomes available as the soil becomes acidic 29. 11. 2020 35
LESSON 5 Physical Properties of the Soil 29. 11. 2020 36
Outcomes 1. Describe the different methods of assessing soil fertility 2. Determine which method is more appropriate/ practical for farmer use 29. 11. 2020 37
Structure 1. How to take soil samples properly 2. Minus one element technique 3. Crop offtake table 4. Use of leaf color chart 5. N-tester 6. Crop manager 29. 11. 2020 38
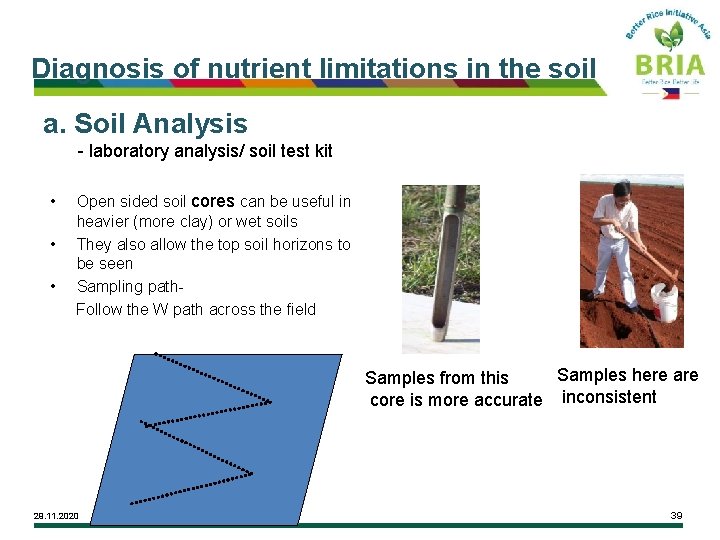
Diagnosis of nutrient limitations in the soil a. Soil Analysis - laboratory analysis/ soil test kit Open sided soil cores can be useful in heavier (more clay) or wet soils • They also allow the top soil horizons to be seen • Sampling path- Follow the W path across the field • Samples here are Samples from this core is more accurate inconsistent 29. 11. 2020 39
b. Minus one element technique (MOET) - A pot experiment to determine the nutrients deficient in the soil. - “Complete treatment” compared - with the “minus treatments” • MOET is a reliable technique that determines soil nutrient deficiencies in the field. MOET is based on the law of the Minimum 29. 11. 2020 40
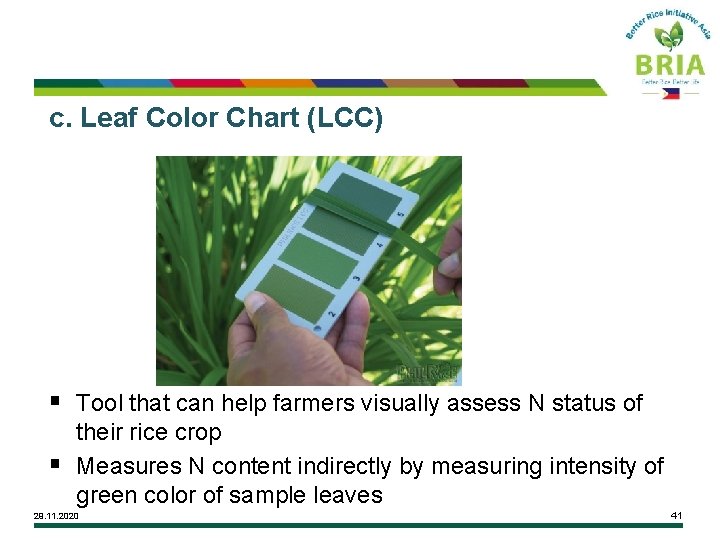
c. Leaf Color Chart (LCC) § Tool that can help farmers visually assess N status of § their rice crop Measures N content indirectly by measuring intensity of green color of sample leaves 29. 11. 2020 41
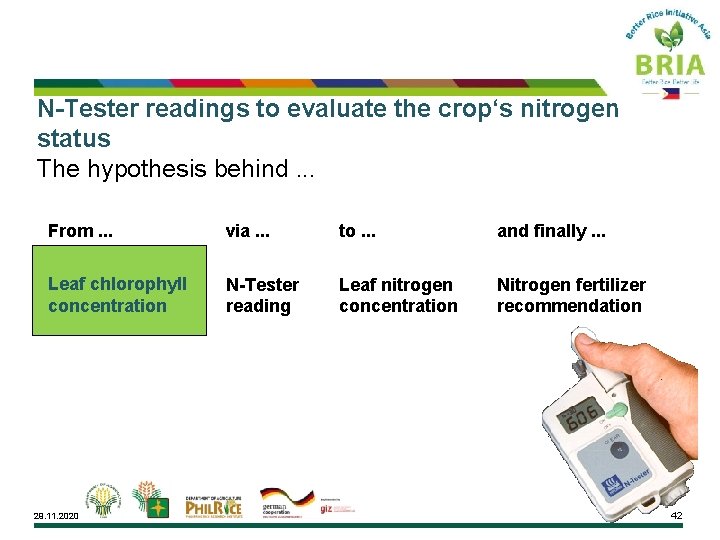
N-Tester readings to evaluate the crop‘s nitrogen status The hypothesis behind. . . From. . . via. . . to. . . and finally. . . Leaf chlorophyll concentration N-Tester reading Leaf nitrogen concentration Nitrogen fertilizer recommendation 29. 11. 2020 42
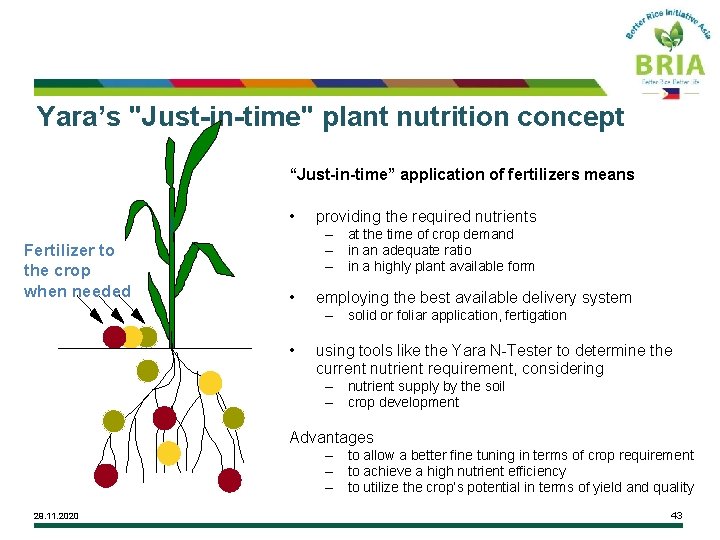
Yara’s "Just-in-time" plant nutrition concept “Just-in-time” application of fertilizers means • Fertilizer to the crop when needed providing the required nutrients – at the time of crop demand – in an adequate ratio – in a highly plant available form • employing the best available delivery system – solid or foliar application, fertigation • using tools like the Yara N-Tester to determine the current nutrient requirement, considering – nutrient supply by the soil – crop development Advantages – to allow a better fine tuning in terms of crop requirement – to achieve a high nutrient efficiency – to utilize the crop’s potential in terms of yield and quality 29. 11. 2020 43
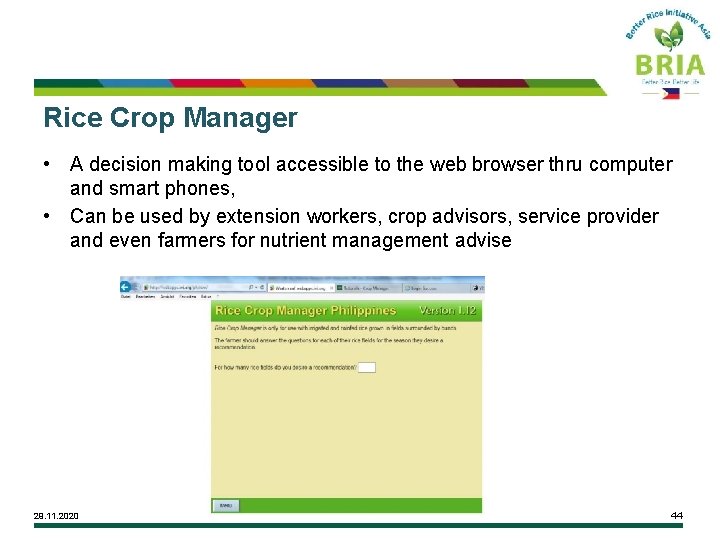
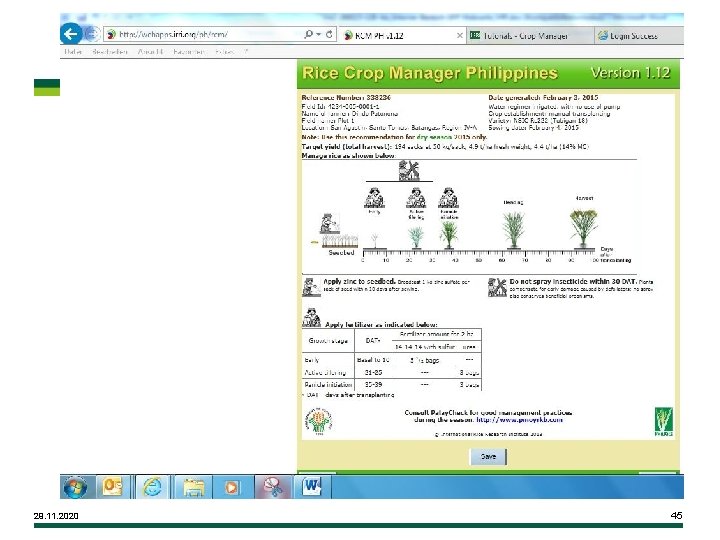
Rice Crop Manager • A decision making tool accessible to the web browser thru computer and smart phones, • Can be used by extension workers, crop advisors, service provider and even farmers for nutrient management advise 29. 11. 2020 44
29. 11. 2020 45
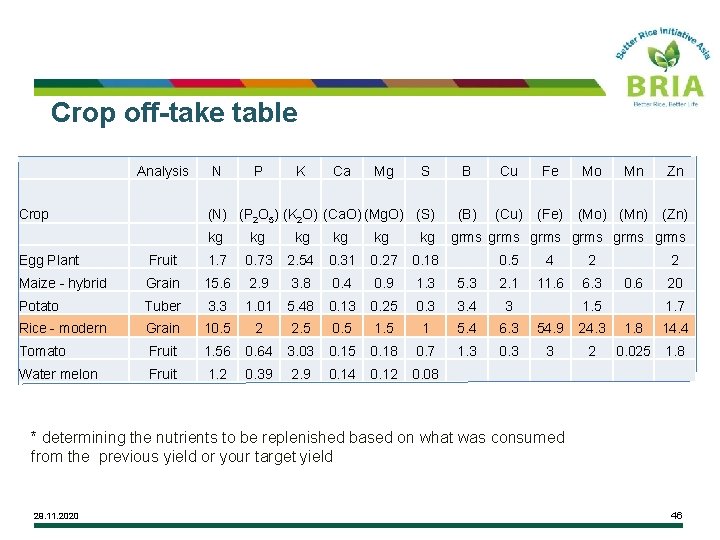
Crop off-take table Analysis Crop N P K Ca Mg S B Cu Fe (B) (Cu) (Fe) Mo Mn (N) (P 2 O 5) (K 2 O) (Ca. O) (Mg. O) (S) kg kg kg Egg Plant Fruit 1. 7 0. 73 2. 54 0. 31 0. 27 0. 18 0. 5 4 2 2 Maize - hybrid Grain 15. 6 2. 9 3. 8 0. 4 0. 9 1. 3 5. 3 2. 1 11. 6 6. 3 0. 6 20 Potato Tuber 3. 3 1. 01 5. 48 0. 13 0. 25 0. 3 3. 4 3 1. 5 1. 7 Rice - modern Grain 10. 5 2 2. 5 0. 5 1 5. 4 6. 3 54. 9 24. 3 1. 8 14. 4 Tomato Fruit 1. 56 0. 64 3. 03 0. 15 0. 18 0. 7 1. 3 0. 3 3 2 0. 025 1. 8 Water melon Fruit 1. 2 0. 39 2. 9 0. 14 0. 12 0. 08 (Mo) (Mn) Zn (Zn) kg grms grms * determining the nutrients to be replenished based on what was consumed from the previous yield or your target yield 29. 11. 2020 46
LESSON 6 Organic and mineral fertilizers 29. 11. 2020 47
Outcomes 1. Describe organic and mineral fertilizers 2. How organic and mineral fertilizers are made 29. 11. 2020 48
Structure 1. What organic and mineral fertilizers are 2. How are organic and mineral fertilizers made 29. 11. 2020 49
Organic and mineral fertilizers production and utilization • Organic fertilizer – These are fertilizers mostly derived from animal manure or decomposed plant and animal materials • Mineral Fertilizer – These are formulated fertilizers, not arising from natural process Foliar fertilizer – these are fertilizers directly applied to the leaves 29. 11. 2020 50
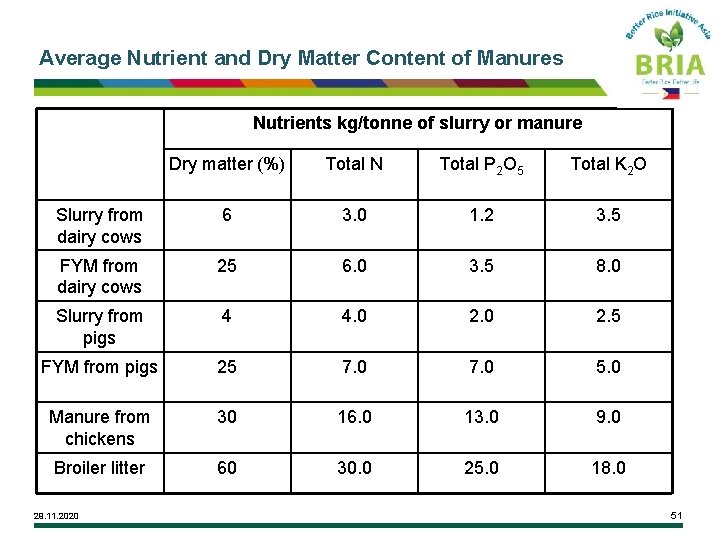
Average Nutrient and Dry Matter Content of Manures Nutrients kg/tonne of slurry or manure Dry matter (%) Total N Total P 2 O 5 Total K 2 O Slurry from dairy cows 6 3. 0 1. 2 3. 5 FYM from dairy cows 25 6. 0 3. 5 8. 0 Slurry from pigs 4 4. 0 2. 5 FYM from pigs 25 7. 0 5. 0 Manure from chickens 30 16. 0 13. 0 9. 0 Broiler litter 60 30. 0 25. 0 18. 0 29. 11. 2020 51
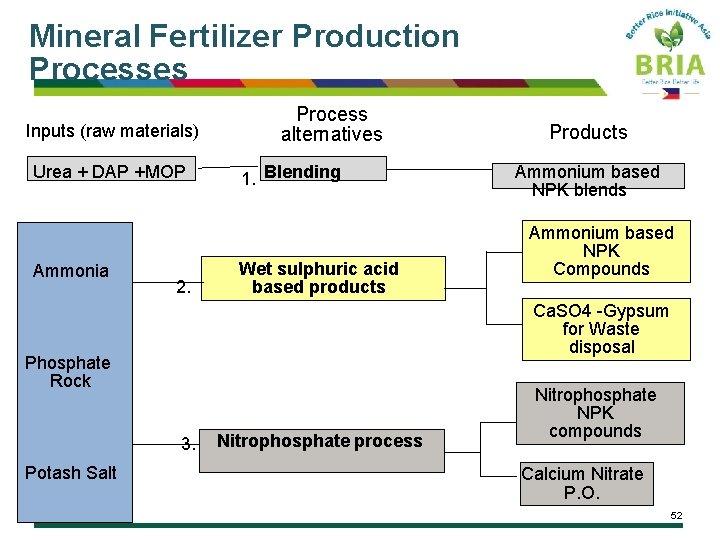
Mineral Fertilizer Production Processes Inputs (raw materials) Urea + DAP +MOP Ammonia 2. Process alternatives Blending 1. Wet sulphuric acid based products 3. 29. 11. 2020 Ammonium based NPK blends Ammonium based NPK Compounds Ca. SO 4 -Gypsum for Waste disposal Phosphate Rock Potash Salt Products Nitrophosphate process Nitrophosphate NPK compounds Calcium Nitrate P. O. 52
LESSON 7 Managing the nutrient requirement of crops (Key Check 5) 29. 11. 2020 53
Outcomes 1. Determine the nutrient deficiencies 2. How organic and mineral fertilizers are made 29. 11. 2020 54
Structure 1. The deficiency symptoms of each nutrient element 2. The causes of deficiencies 3. The right kind of fertilizers 4. The right amount of fertilizers 5. The right time to apply fertilizers 29. 11. 2020 55
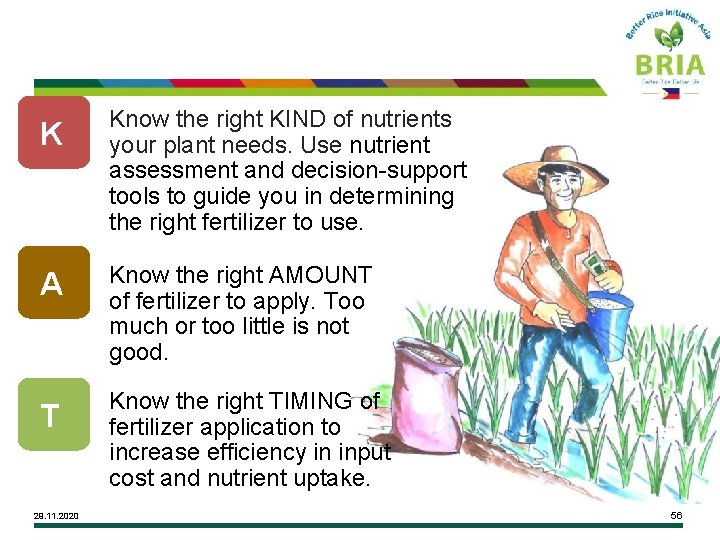
K Know the right KIND of nutrients your plant needs. Use nutrient assessment and decision-support tools to guide you in determining the right fertilizer to use. A Know the right AMOUNT of fertilizer to apply. Too much or too little is not good. T Know the right TIMING of fertilizer application to increase efficiency in input cost and nutrient uptake. 29. 11. 2020 56
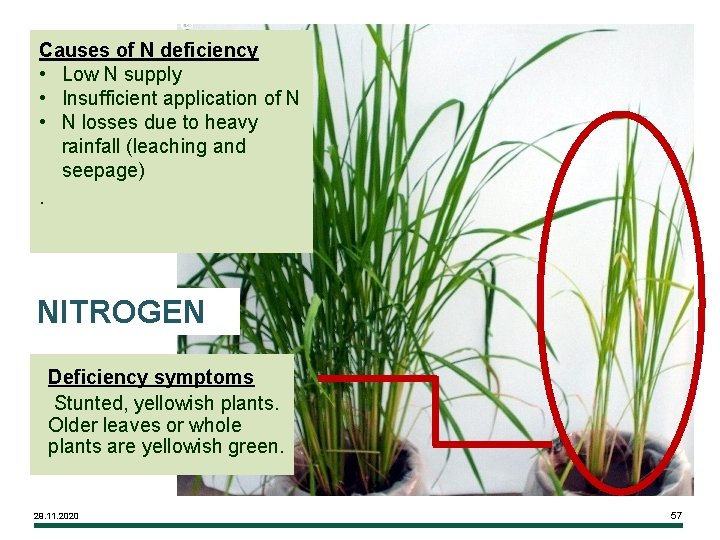
Causes of N deficiency • Low N supply • Insufficient application of N • N losses due to heavy rainfall (leaching and seepage). NITROGEN Deficiency symptoms Stunted, yellowish plants. Older leaves or whole plants are yellowish green. 29. 11. 2020 57
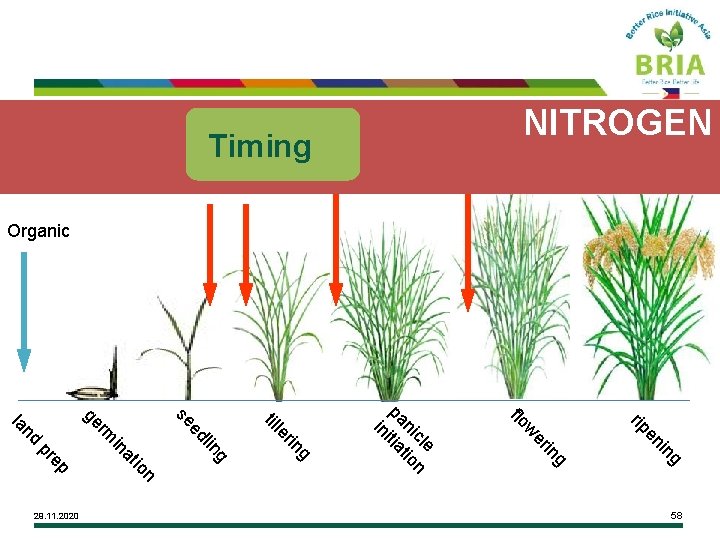
(Basal) Timing g in en rip g in er w flo e cl n ni tio pa itia in g rin le til g lin n io p re at in p nd rm ed se ge la 58 29. 11. 2020 NITROGEN Organic
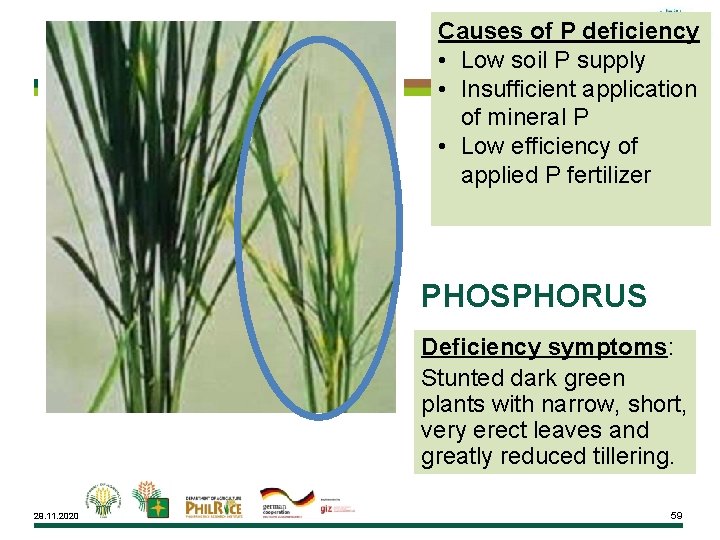
Causes of P deficiency • Low soil P supply • Insufficient application of mineral P • Low efficiency of applied P fertilizer PHOSPHORUS Deficiency symptoms: Stunted dark green plants with narrow, short, very erect leaves and greatly reduced tillering. 29. 11. 2020 59
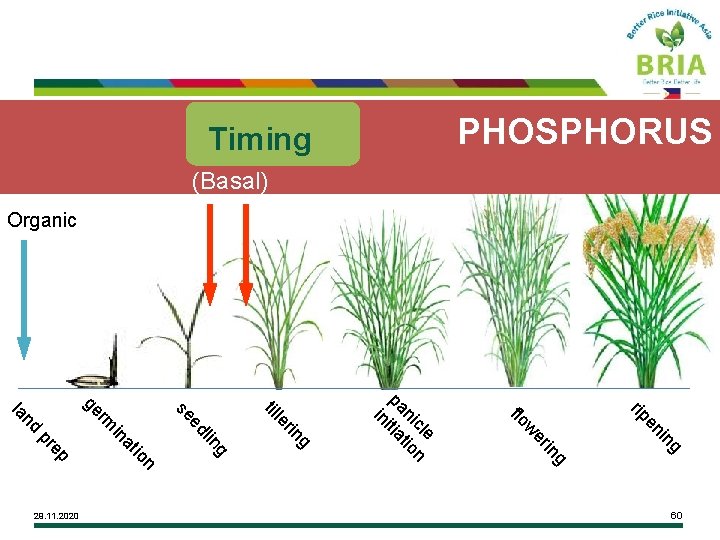
g in en rip g in er w flo e cl n ni tio pa itia in g rin le til g lin ed n io p re at in p nd rm se ge la 60 29. 11. 2020 PHOSPHORUS Timing (Basal) Organic
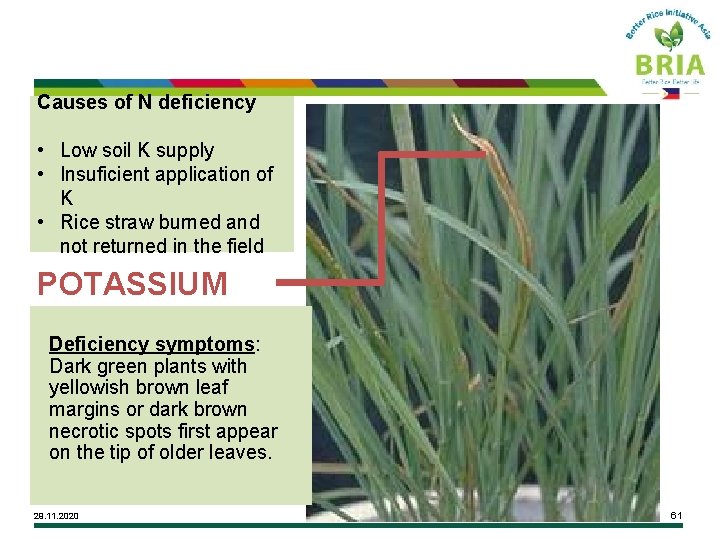
Causes of N deficiency • Low soil K supply • Insuficient application of K • Rice straw burned and not returned in the field POTASSIUM Deficiency symptoms: Dark green plants with yellowish brown leaf margins or dark brown necrotic spots first appear on the tip of older leaves. 29. 11. 2020 61
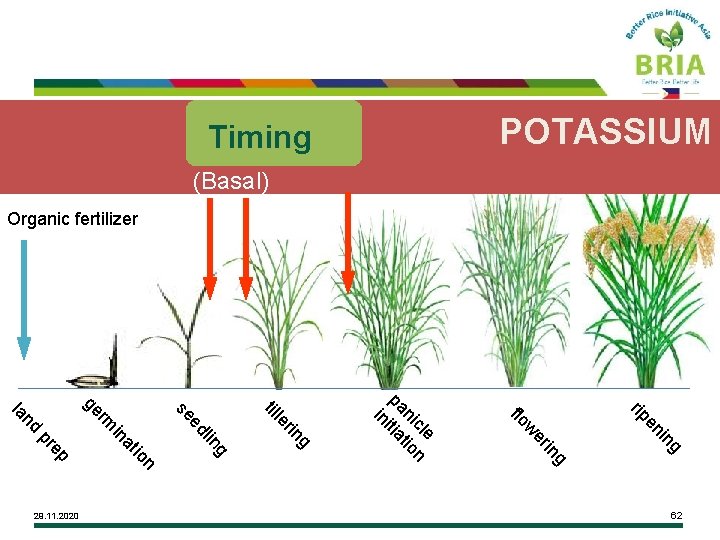
g in en rip g in er w flo e cl n ni tio pa itia in g rin le til g lin ed n io p re at in p nd rm se ge la 62 29. 11. 2020 POTASSIUM Timing (Basal) Organic fertilizer
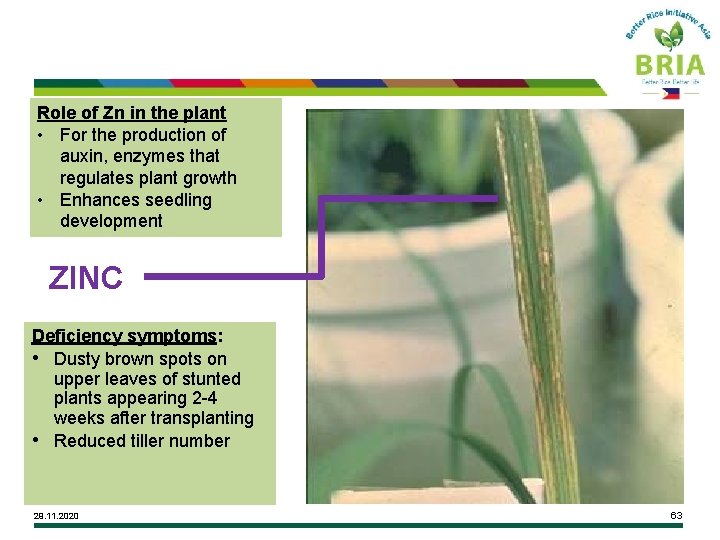
Role of Zn in the plant • For the production of auxin, enzymes that regulates plant growth • Enhances seedling development ZINC Deficiency symptoms: • Dusty brown spots on upper leaves of stunted plants appearing 2 -4 weeks after transplanting • Reduced tiller number 29. 11. 2020 63
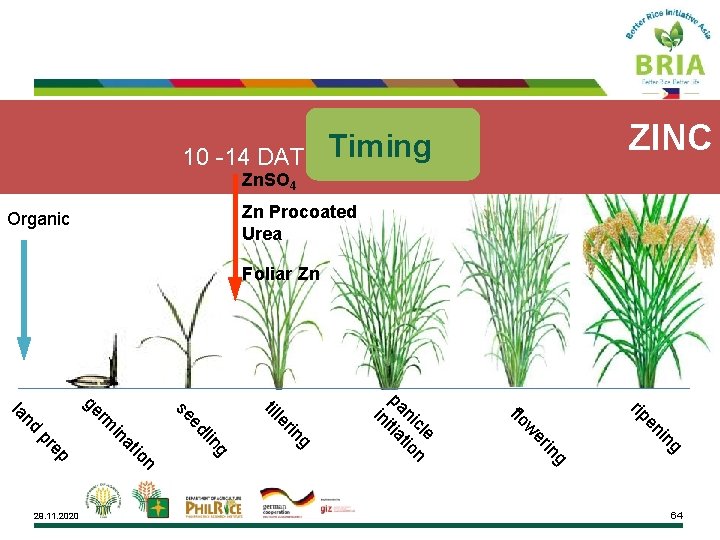
Zn. SO 4 10 -14 DAT g in en rip g in er w flo e cl n ni tio pa itia in g rin le til g lin ed n io p re at in p nd rm se ge la 64 29. 11. 2020 Zn Procoated Urea Organic ZINC Timing Foliar Zn
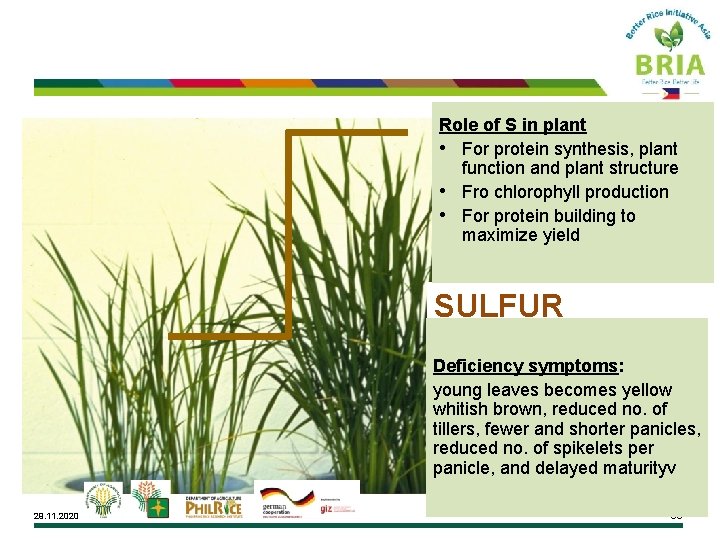
Role of S in plant • For protein synthesis, plant function and plant structure • Fro chlorophyll production • For protein building to maximize yield SULFUR Deficiency symptoms: young leaves becomes yellow whitish brown, reduced no. of tillers, fewer and shorter panicles, reduced no. of spikelets per panicle, and delayed maturityv 29. 11. 2020 65
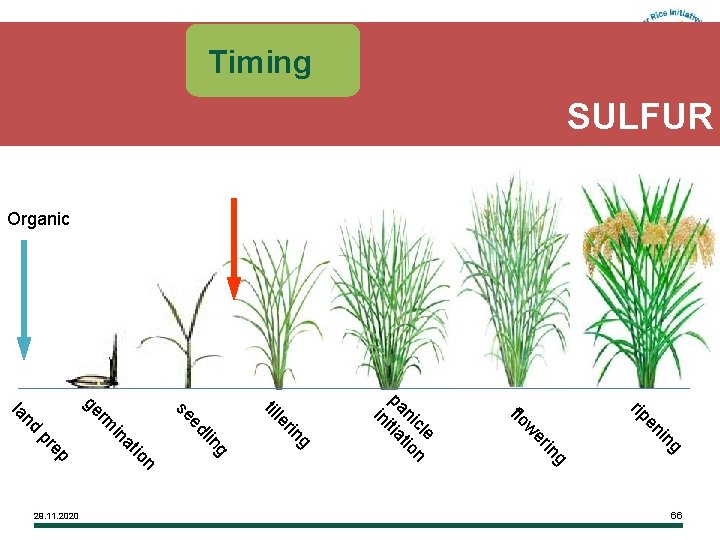
Timing SULFUR Organic g in en rip g in er w flo e cl n ni tio pa itia in g rin le til g lin ed n io p re at in p nd rm se ge la 66 29. 11. 2020
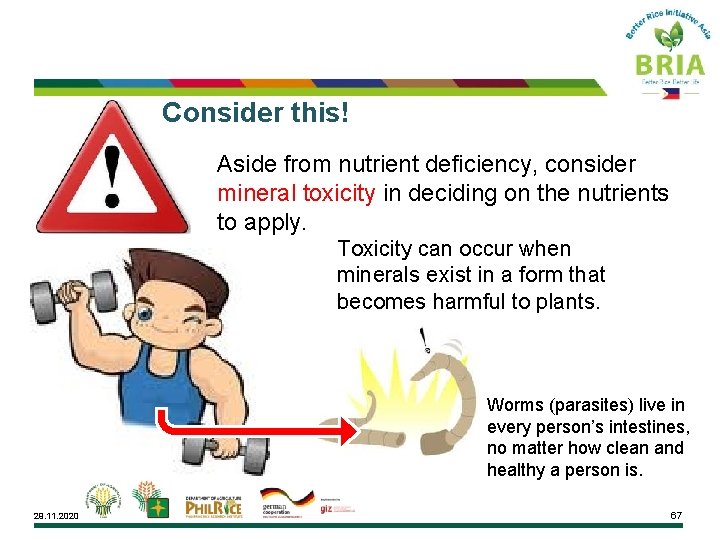
Consider this! Aside from nutrient deficiency, consider mineral toxicity in deciding on the nutrients to apply. Toxicity can occur when minerals exist in a form that becomes harmful to plants. Worms (parasites) live in every person’s intestines, no matter how clean and healthy a person is. 29. 11. 2020 67
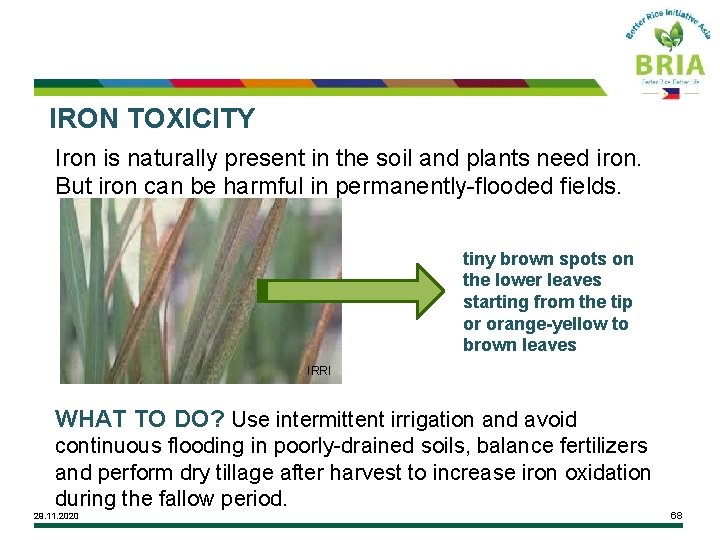
IRON TOXICITY Iron is naturally present in the soil and plants need iron. But iron can be harmful in permanently-flooded fields. tiny brown spots on the lower leaves starting from the tip or orange-yellow to brown leaves IRRI WHAT TO DO? Use intermittent irrigation and avoid continuous flooding in poorly-drained soils, balance fertilizers and perform dry tillage after harvest to increase iron oxidation during the fallow period. 29. 11. 2020 68
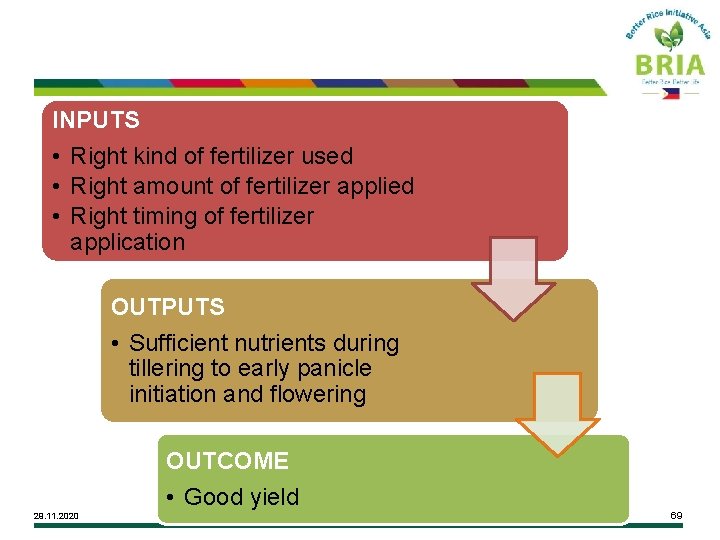
INPUTS • Right kind of fertilizer used • Right amount of fertilizer applied • Right timing of fertilizer application OUTPUTS • Sufficient nutrients during tillering to early panicle initiation and flowering OUTCOME • Good yield 29. 11. 2020 69
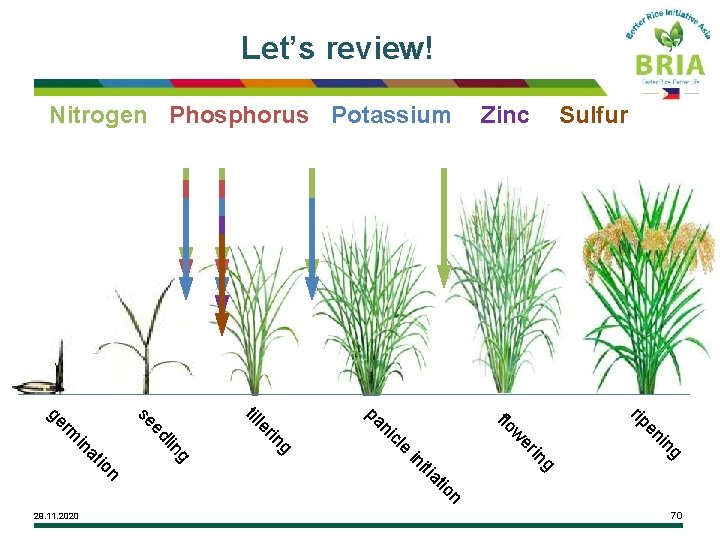
Let’s review! Nitrogen Phosphorus Potassium Zinc Sulfur g in en rip g n io at iti in in er e cl w flo ni pa g in g lin ed n io at in rm r le til se ge 29. 11. 2020 70
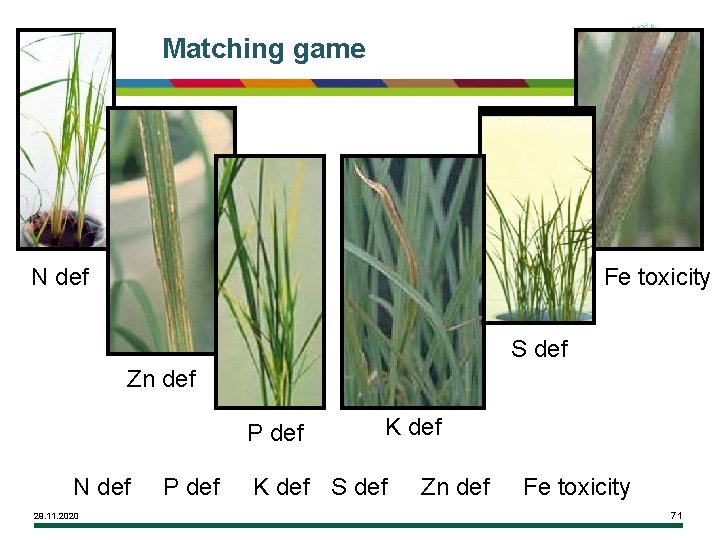
Matching game N def Fe toxicity S def Zn def P def N def 29. 11. 2020 P def K def S def Zn def Fe toxicity 71
LESSON 7 Managing the nutrient requirement of crops (Key Check 5) 29. 11. 2020 72
Outcomes 1. Able to analyze current fertilizer program 2. Able to calculate the nutrients in a bag 3. Create a fertilizer program 29. 11. 2020 73
Structure 1. Issues to consider in creating a fertilizer program 2. Calculate the amount of nutrients per bag of fertilizers 3. Creating a fertilizer program 29. 11. 2020 74
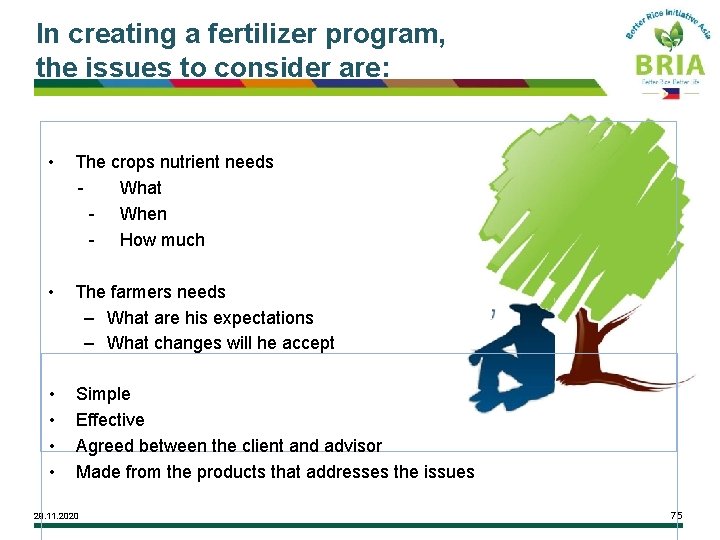
In creating a fertilizer program, the issues to consider are: • The crops nutrient needs What - When - How much • The farmers needs – What are his expectations – What changes will he accept • • Simple Effective Agreed between the client and advisor Made from the products that addresses the issues 29. 11. 2020 75
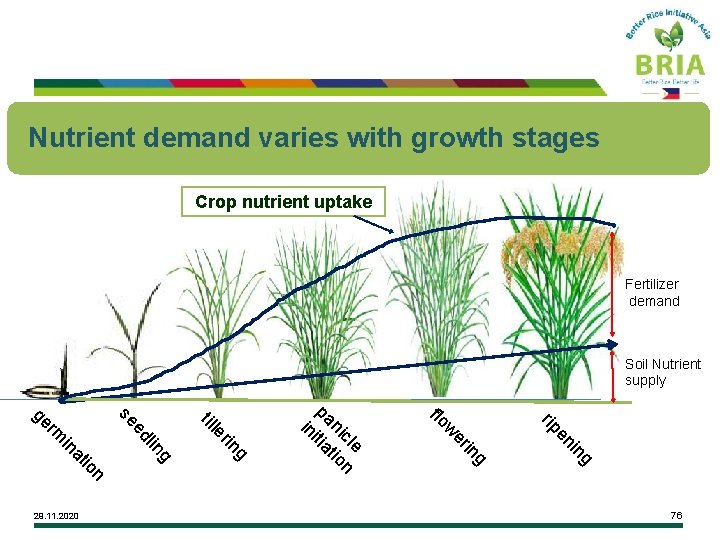
Nutrient demand varies with growth stages Crop nutrient uptake Fertilizer demand Soil Nutrient supply g in en rip g in er w flo e cl n ni tio pa itia in g rin le g lin n io at in rm ed til se ge 29. 11. 2020 76
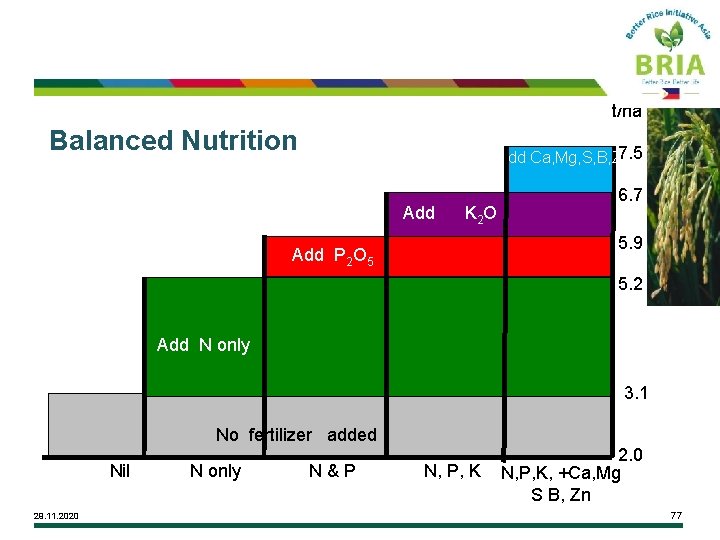
t/ha Balanced Nutrition 7. 5 Add Ca, Mg, S, B, Zn Add K 2 O 6. 7 5. 9 Add P 2 O 5 5. 2 Add N only 3. 1 No fertilizer added Nil 29. 11. 2020 N only N & P N, P, K 2. 0 N, P, K, +Ca, Mg S B, Zn 77
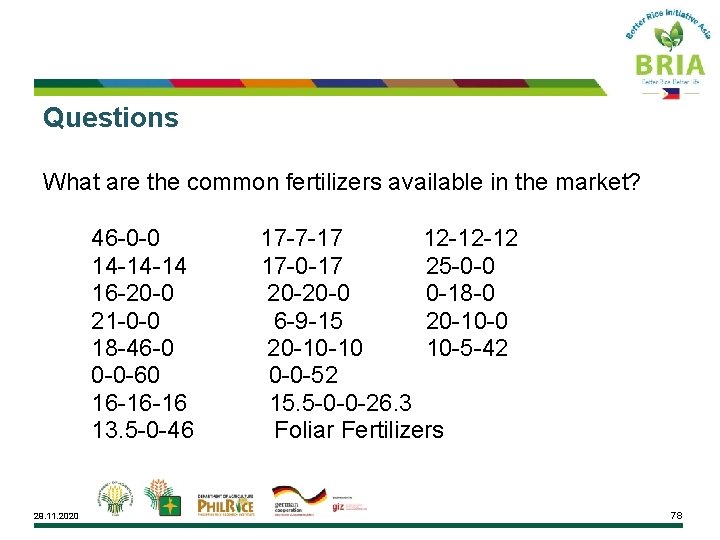
Questions What are the common fertilizers available in the market? 46 -0 -0 17 -7 -17 12 -12 -12 14 -14 -14 17 -0 -17 25 -0 -0 16 -20 -0 20 -20 -0 0 -18 -0 21 -0 -0 6 -9 -15 20 -10 -0 18 -46 -0 20 -10 -10 10 -5 -42 0 -0 -60 0 -0 -52 16 -16 -16 15. 5 -0 -0 -26. 3 13. 5 -0 -46 Foliar Fertilizers 29. 11. 2020 78
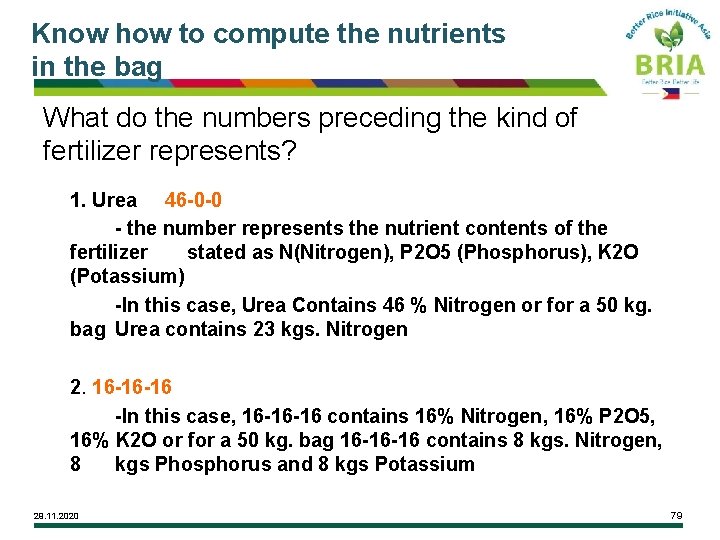
Know how to compute the nutrients in the bag What do the numbers preceding the kind of fertilizer represents? 1. Urea 46 -0 -0 - the number represents the nutrient contents of the fertilizer stated as N(Nitrogen), P 2 O 5 (Phosphorus), K 2 O (Potassium) -In this case, Urea Contains 46 % Nitrogen or for a 50 kg. bag Urea contains 23 kgs. Nitrogen 2. 16 -16 -16 -In this case, 16 -16 -16 contains 16% Nitrogen, 16% P 2 O 5, 16% K 2 O or for a 50 kg. bag 16 -16 -16 contains 8 kgs. Nitrogen, 8 kgs Phosphorus and 8 kgs Potassium 29. 11. 2020 79
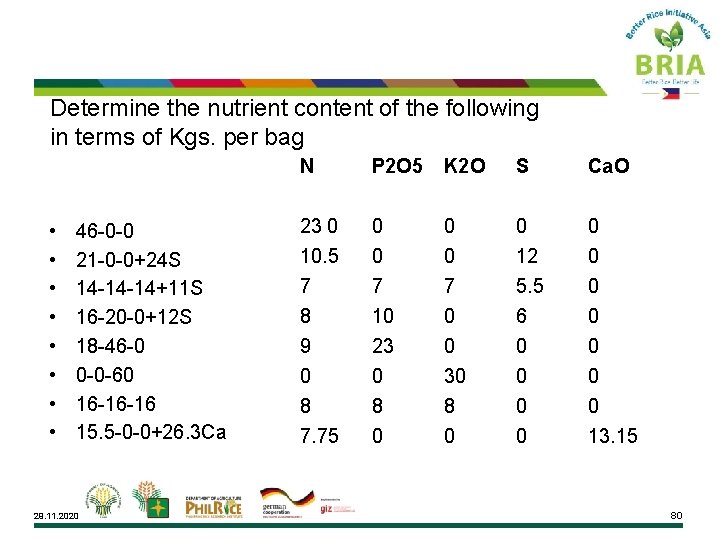
Determine the nutrient content of the following in terms of Kgs. per bag • • 46 -0 -0 21 -0 -0+24 S 14 -14 -14+11 S 16 -20 -0+12 S 18 -46 -0 0 -0 -60 16 -16 -16 15. 5 -0 -0+26. 3 Ca 29. 11. 2020 N P 2 O 5 K 2 O S Ca. O 23 0 10. 5 7 8 9 0 0 0 7 10 23 0 0 0 7 0 0 30 0 12 5. 5 6 0 0 0 0 8 7. 75 8 0 0 0 0 13. 15 80
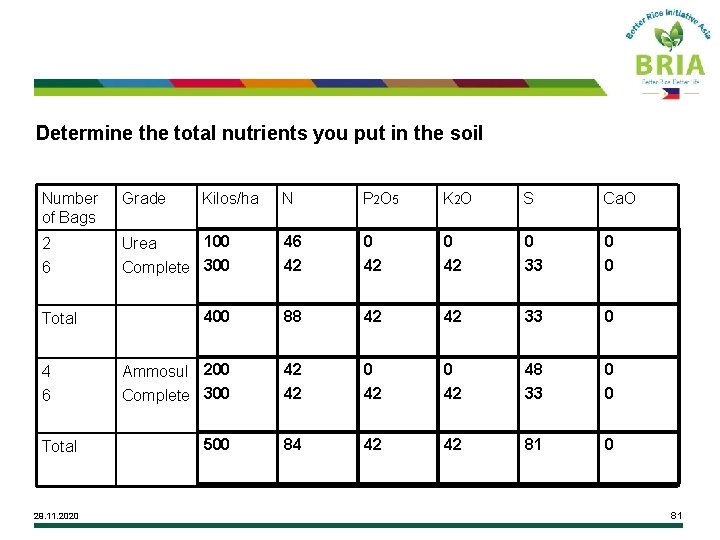
Determine the total nutrients you put in the soil Number of Bags Grade 2 6 Total 4 6 Total 29. 11. 2020 Kilos/ha N P 2 O 5 K 2 O S Ca. O 100 Urea Complete 300 46 42 0 33 0 0 400 88 42 42 33 0 Ammosul 200 Complete 300 42 42 0 42 48 33 0 0 500 84 42 42 81 0 81
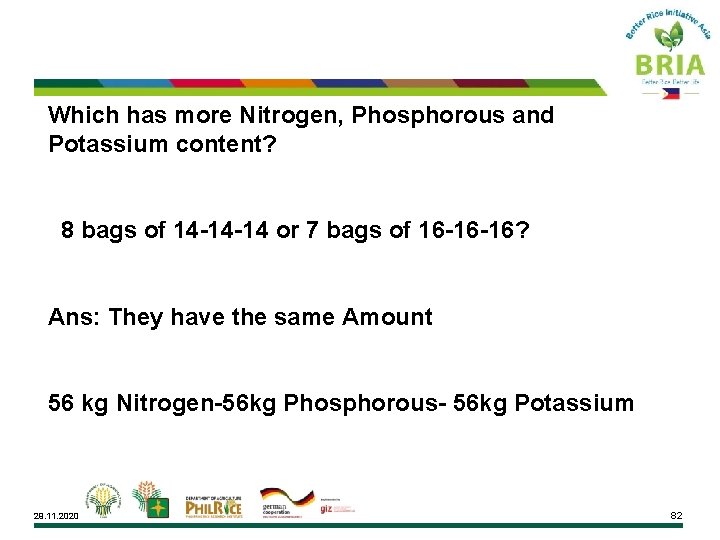
Which has more Nitrogen, Phosphorous and Potassium content? 8 bags of 14 -14 -14 or 7 bags of 16 -16 -16? Ans: They have the same Amount 56 kg Nitrogen-56 kg Phosphorous- 56 kg Potassium 29. 11. 2020 82
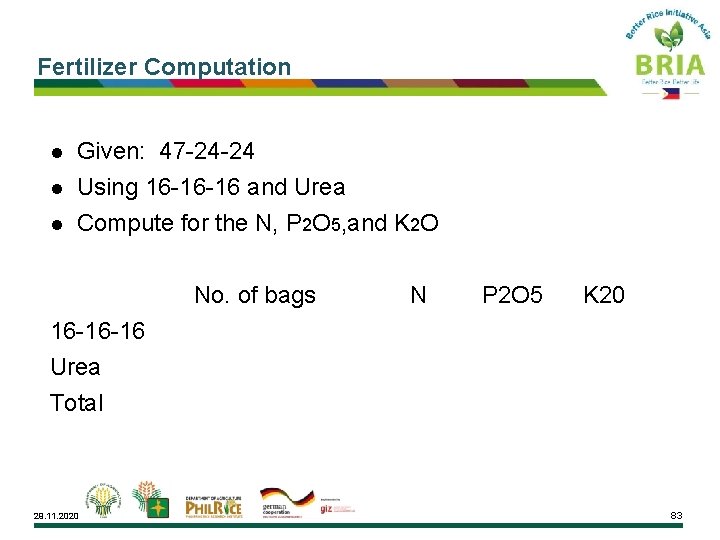
Fertilizer Computation l Given: 47 -24 -24 Using 16 -16 -16 and Urea l Compute for the N, P 2 O 5, and K 2 O l No. of bags N P 2 O 5 K 20 16 -16 -16 Urea Total 29. 11. 2020 83
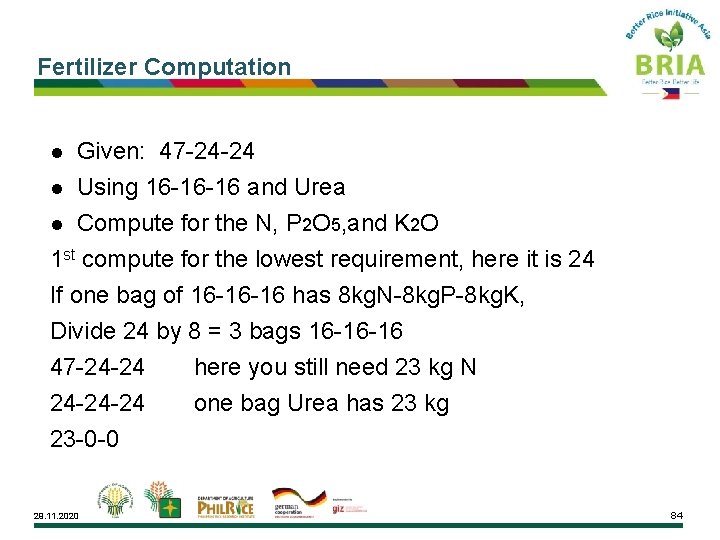
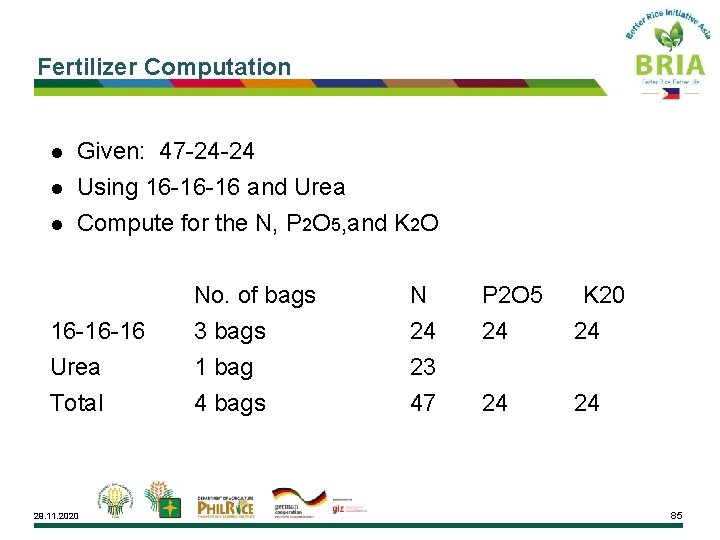
Fertilizer Computation l l Given: 47 -24 -24 Using 16 -16 -16 and Urea Compute for the N, P 2 O 5, and K 2 O 1 st compute for the lowest requirement, here it is 24 If one bag of 16 -16 -16 has 8 kg. N-8 kg. P-8 kg. K, Divide 24 by 8 = 3 bags 16 -16 -16 47 -24 -24 here you still need 23 kg N 24 -24 -24 one bag Urea has 23 kg l 23 -0 -0 29. 11. 2020 84
Fertilizer Computation l Given: 47 -24 -24 Using 16 -16 -16 and Urea l Compute for the N, P 2 O 5, and K 2 O l 16 -16 -16 Urea Total 29. 11. 2020 No. of bags 3 bags 1 bag 4 bags N 24 23 47 P 2 O 5 K 20 24 24 24 85
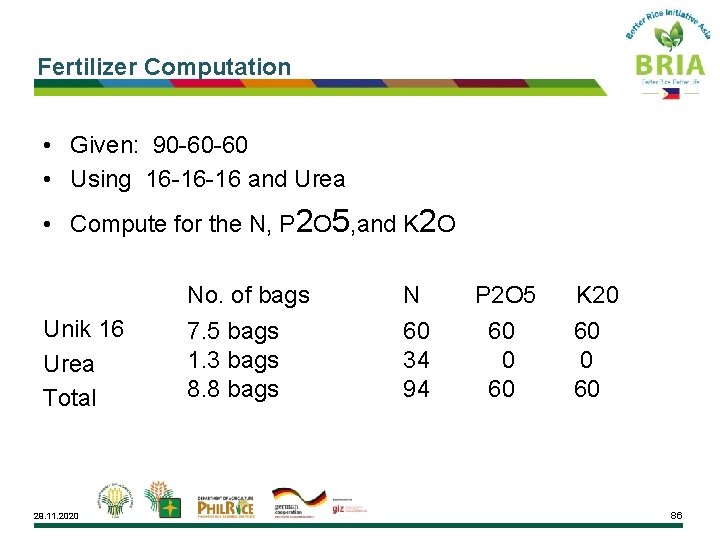
Fertilizer Computation • Given: 90 -60 -60 • Using 16 -16 -16 and Urea • Compute for the N, P 2 O 5, and K 2 O No. of bags Unik 16 7. 5 bags Urea 1. 3 bags 8. 8 bags Total 29. 11. 2020 N P 2 O 5 K 20 60 34 94 60 0 60 60 86
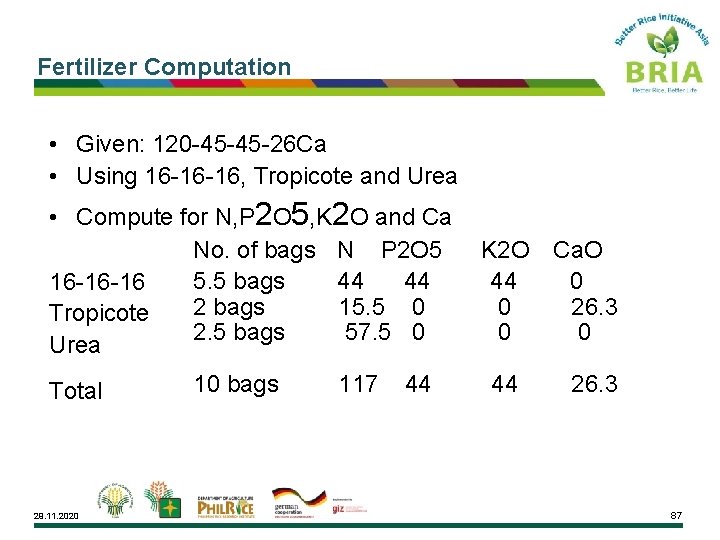
Fertilizer Computation • Given: 120 -45 -45 -26 Ca • Using 16 -16 -16, Tropicote and Urea • Compute for N, P 2 O 5, K 2 O and Ca No. of bags N P 2 O 5 K 2 O Ca. O 5. 5 bags 44 44 0 16 -16 -16 2 bags 15. 5 0 0 26. 3 Tropicote 2. 5 bags 57. 5 0 0 Urea 10 bags 117 44 26. 3 Total 29. 11. 2020 87
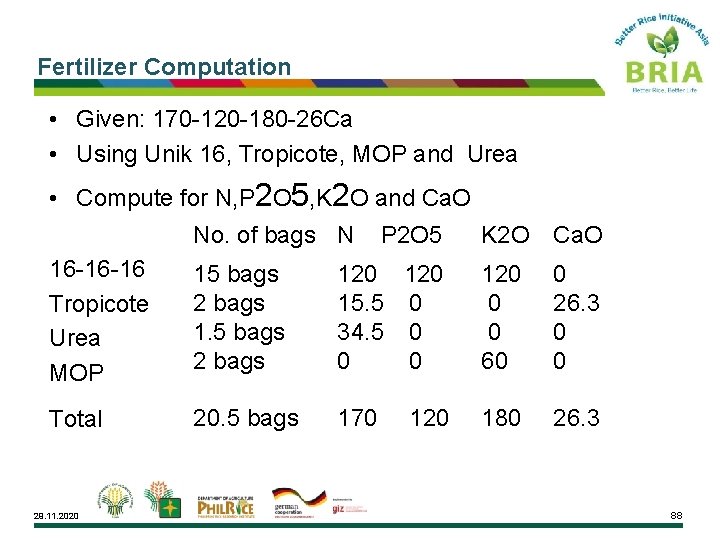
Fertilizer Computation • Given: 170 -120 -180 -26 Ca • Using Unik 16, Tropicote, MOP and Urea • Compute for N, P 2 O 5, K 2 O and Ca. O No. of bags N P 2 O 5 16 -16 -16 15 bags 120 2 bags 15. 5 0 Tropicote 1. 5 bags 34. 5 0 Urea 2 bags 0 0 MOP Total 29. 11. 2020 20. 5 bags 170 120 K 2 O Ca. O 120 0 0 60 0 26. 3 0 0 180 26. 3 88
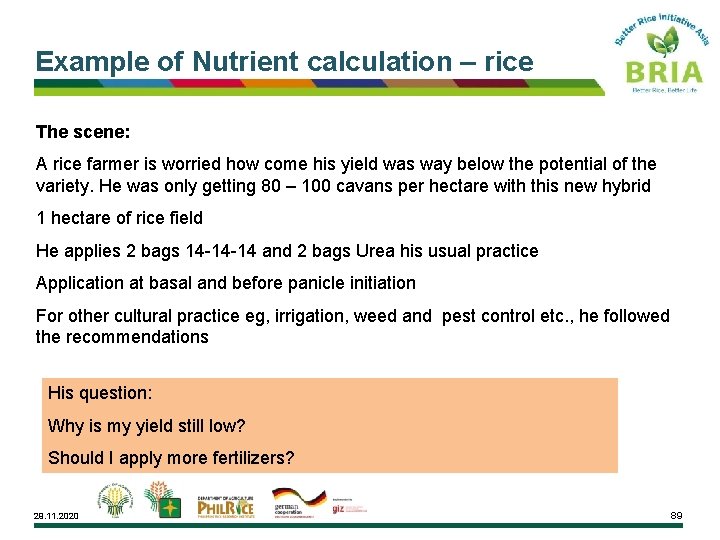
Example of Nutrient calculation – rice The scene: A rice farmer is worried how come his yield was way below the potential of the variety. He was only getting 80 – 100 cavans per hectare with this new hybrid 1 hectare of rice field He applies 2 bags 14 -14 -14 and 2 bags Urea his usual practice Application at basal and before panicle initiation For other cultural practice eg, irrigation, weed and pest control etc. , he followed the recommendations His question: Why is my yield still low? Should I apply more fertilizers? 29. 11. 2020 89
For more information, please contact: Mr. Tomas Quimbo Yara Fertilizer Focal Person – BRIA FARMERS tomas. quimbo@yara. com http: //www. yara. com Mr. Matthias Radek Chief Advisor GIZ Agriculture-DPP Projects matthias. radek@giz. de http: //www. better-rice-initiative-asia. org/ 29. 11. 2020 Credit Yara Fertilizer with support from Phil. Rice 90