Farm production and child diets Role of child

- Slides: 26
Farm production and child diets: Role of child age and household wealth Prajula Mulmi 3, William A. Masters 1, Shibani Ghosh 1, Grace Namirembe 1, Ruchita Rajbhandary 2, Swetha Manohar 2, Binod Shrestha 2, Rolf Klemm 2, 3, Keith P. West, Jr 2, Patrick Webb 1 1 Friedman School of Nutrition Science & Policy, Tufts University 2 Bloomberg School of Public Health, Johns Hopkins University 3 Helen Keller International Selected paper for presentation at the annual meetings of the Agricultural and Applied Economics Association, 1 August 2017 Feed the Future Innovation Lab for Nutrition
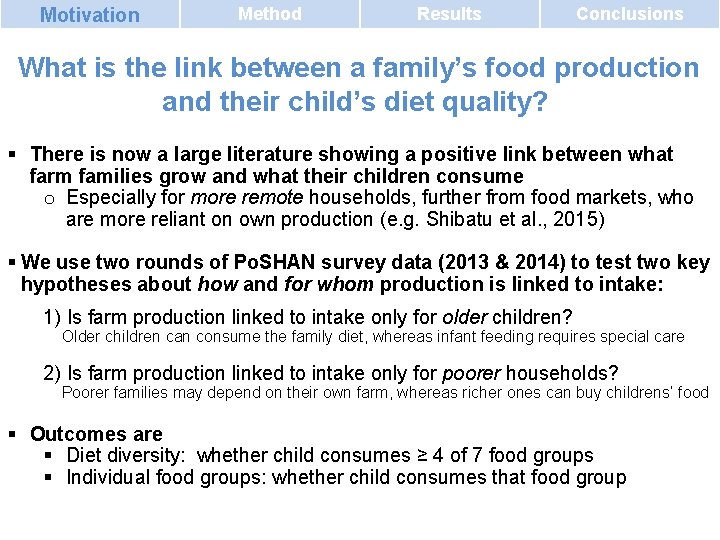
Motivation Method Results Conclusions What is the link between a family’s food production and their child’s diet quality? § There is now a large literature showing a positive link between what farm families grow and what their children consume o Especially for more remote households, further from food markets, who are more reliant on own production (e. g. Shibatu et al. , 2015) § We use two rounds of Po. SHAN survey data (2013 & 2014) to test two key hypotheses about how and for whom production is linked to intake: 1) Is farm production linked to intake only for older children? Older children can consume the family diet, whereas infant feeding requires special care 2) Is farm production linked to intake only for poorer households? Poorer families may depend on their own farm, whereas richer ones can buy childrens’ food § Outcomes are § Diet diversity: whether child consumes ≥ 4 of 7 food groups § Individual food groups: whether child consumes that food group
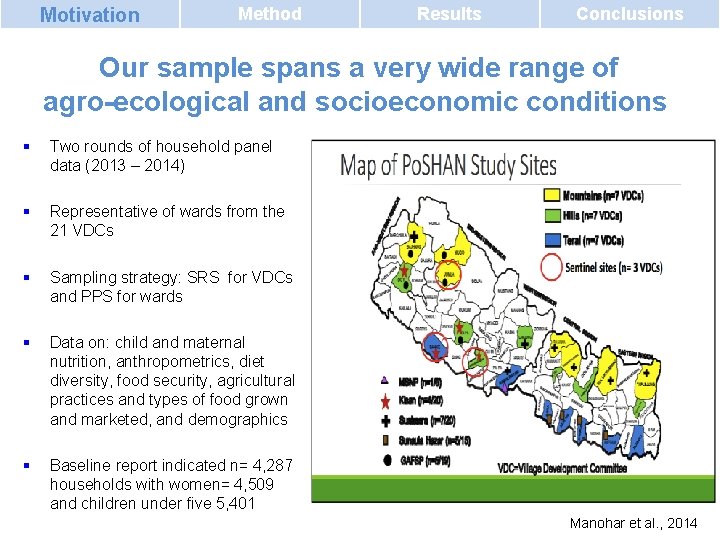
Motivation Method Results Conclusions Our sample spans a very wide range of agro-ecological and socioeconomic conditions § Two rounds of household panel data (2013 – 2014) § Representative of wards from the 21 VDCs § Sampling strategy: SRS for VDCs and PPS for wards § Data on: child and maternal nutrition, anthropometrics, diet diversity, food security, agricultural practices and types of food grown and marketed, and demographics § Baseline report indicated n= 4, 287 households with women= 4, 509 and children under five 5, 401 Manohar et al. , 2014
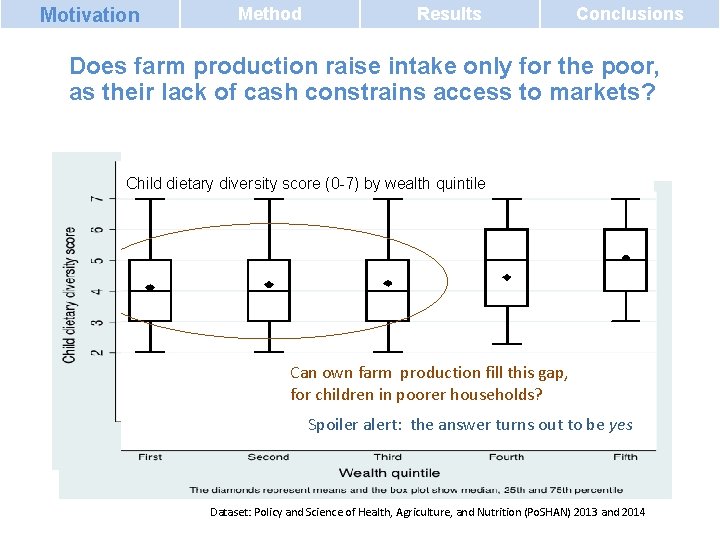
Motivation Method Results Conclusions Does farm production raise intake only for the poor, as their lack of cash constrains access to markets? Child dietary diversity score (0 -7) by wealth quintile Can own farm production fill this gap, for children in poorer households? Spoiler alert: the answer turns out to be yes Dataset: Policy and Science of Health, Agriculture, and Nutrition (Po. SHAN) 2013 and 2014
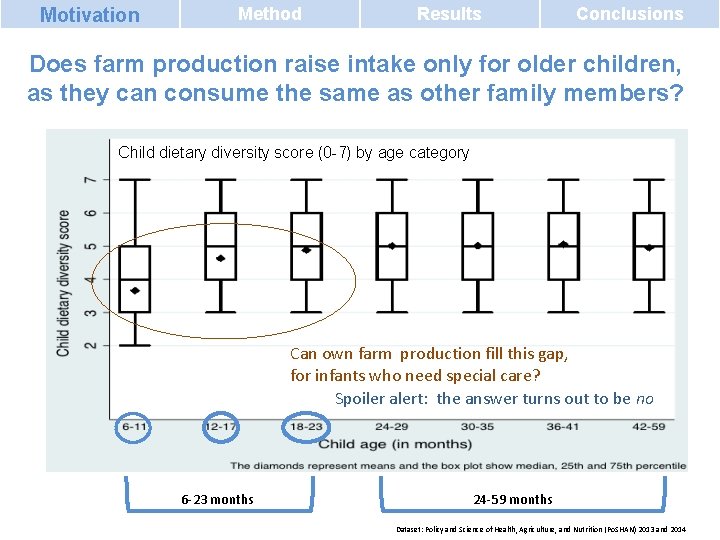
Motivation Method Results Conclusions Does farm production raise intake only for older children, as they can consume the same as other family members? Child dietary diversity score (0 -7) by age category Can own farm production fill this gap, for infants who need special care? Spoiler alert: the answer turns out to be no 6 -23 months 24 -59 months Dataset: Policy and Science of Health, Agriculture, and Nutrition (Po. SHAN) 2013 and 2014
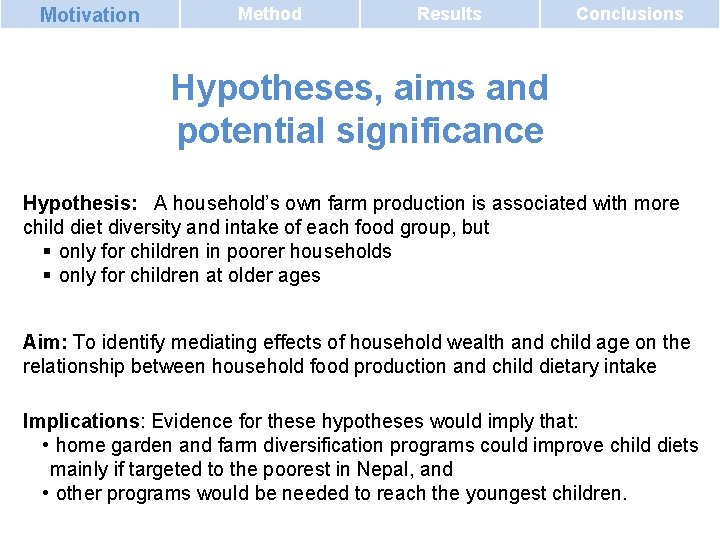
Motivation Method Results Conclusions Hypotheses, aims and potential significance Hypothesis: A household’s own farm production is associated with more child diet diversity and intake of each food group, but § only for children in poorer households § only for children at older ages Aim: To identify mediating effects of household wealth and child age on the relationship between household food production and child dietary intake Implications: Evidence for these hypotheses would imply that: • home garden and farm diversification programs could improve child diets mainly if targeted to the poorest in Nepal, and • other programs would be needed to reach the youngest children.
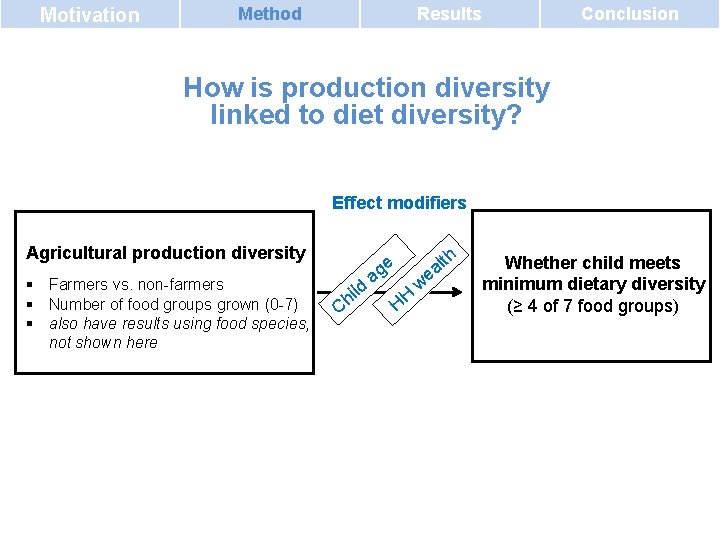
Motivation Method Results Conclusion How is production diversity linked to diet diversity? Effect modifiers Agricultural production diversity § Farmers vs. non-farmers § Number of food groups grown (0 -7) § also have results using food species, not shown here ild h C a ge th H H al e w Whether child meets minimum dietary diversity (≥ 4 of 7 food groups)
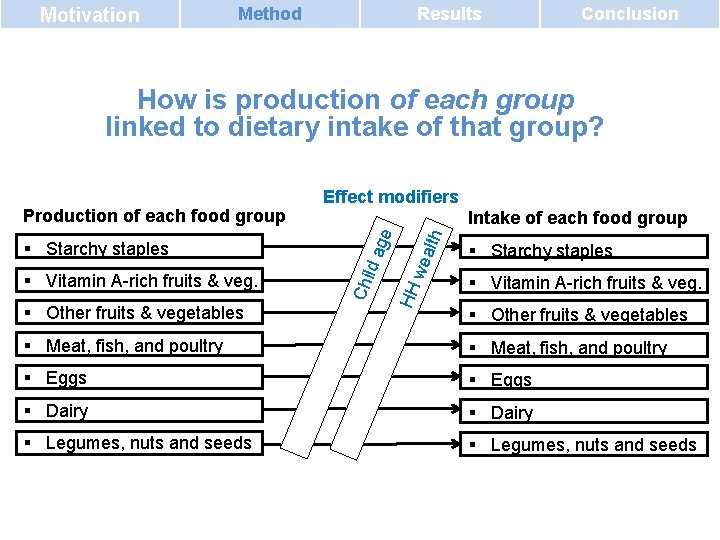
Motivation Method Results Conclusion How is production of each group linked to dietary intake of that group? § Other fruits & vegetables lth we a ge HH § Vitamin A-rich fruits & veg. ild a § Starchy staples Intake of each food group Ch Production of each food group Effect modifiers § Starchy staples § Vitamin A-rich fruits & veg. § Other fruits & vegetables § Meat, fish, and poultry § Eggs § Dairy § Legumes, nuts and seeds
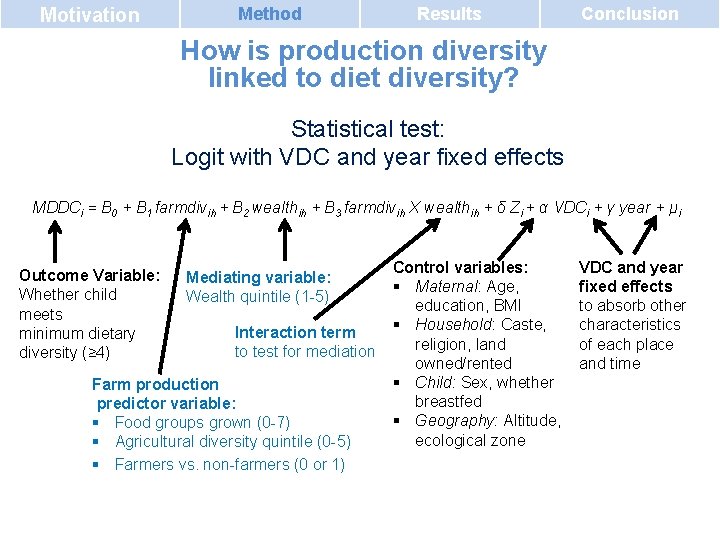
Motivation Method Results Conclusion How is production diversity linked to diet diversity? Statistical test: Logit with VDC and year fixed effects MDDCi = B 0 + B 1 farmdivih + B 2 wealthih + B 3 farmdivih X wealthih + δ Zi + α VDCi + γ year + μi Outcome Variable: Whether child meets minimum dietary diversity (≥ 4) Mediating variable: Wealth quintile (1 -5) Interaction term to test for mediation Farm production predictor variable: § Food groups grown (0 -7) § Agricultural diversity quintile (0 -5) § Farmers vs. non-farmers (0 or 1) Control variables: § Maternal: Age, education, BMI § Household: Caste, religion, land owned/rented § Child: Sex, whether breastfed § Geography: Altitude, ecological zone VDC and year fixed effects to absorb other characteristics of each place and time
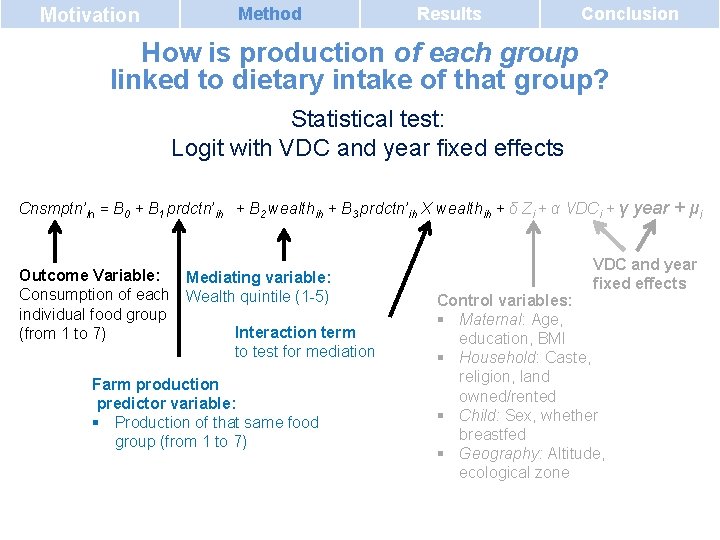
Motivation Method Results Conclusion How is production of each group linked to dietary intake of that group? Statistical test: Logit with VDC and year fixed effects Cnsmptn’ih = B 0 + B 1 prdctn’ih + B 2 wealthih + B 3 prdctn’ih X wealthih + δ Zi + α VDCi + γ year + μi Outcome Variable: Mediating variable: Consumption of each Wealth quintile (1 -5) individual food group Interaction term (from 1 to 7) to test for mediation Farm production predictor variable: § Production of that same food group (from 1 to 7) VDC and year fixed effects Control variables: § Maternal: Age, education, BMI § Household: Caste, religion, land owned/rented § Child: Sex, whether breastfed § Geography: Altitude, ecological zone
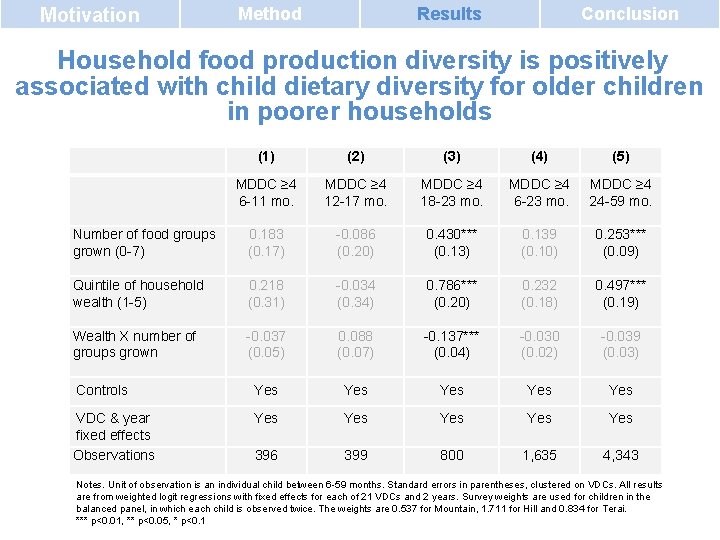
Motivation Method Results Conclusion Household food production diversity is positively associated with child dietary diversity for older children in poorer households (1) (2) (3) (4) (5) MDDC ≥ 4 6 -11 mo. MDDC ≥ 4 12 -17 mo. MDDC ≥ 4 18 -23 mo. MDDC ≥ 4 6 -23 mo. MDDC ≥ 4 24 -59 mo. Number of food groups grown (0 -7) 0. 183 (0. 17) -0. 086 (0. 20) 0. 430*** (0. 13) 0. 139 (0. 10) 0. 253*** (0. 09) Quintile of household wealth (1 -5) 0. 218 (0. 31) -0. 034 (0. 34) 0. 786*** (0. 20) 0. 232 (0. 18) 0. 497*** (0. 19) Wealth X number of groups grown -0. 037 (0. 05) 0. 088 (0. 07) -0. 137*** (0. 04) -0. 030 (0. 02) -0. 039 (0. 03) Controls Yes Yes Yes VDC & year fixed effects Observations Yes Yes Yes 396 399 800 1, 635 4, 343 Notes. Unit of observation is an individual child between 6 -59 months. Standard errors in parentheses, clustered on VDCs. All results are from weighted logit regressions with fixed effects for each of 21 VDCs and 2 years. Survey weights are used for children in the balanced panel, in which each child is observed twice. The weights are 0. 537 for Mountain, 1. 711 for Hill and 0. 834 for Terai. *** p<0. 01, ** p<0. 05, * p<0. 1
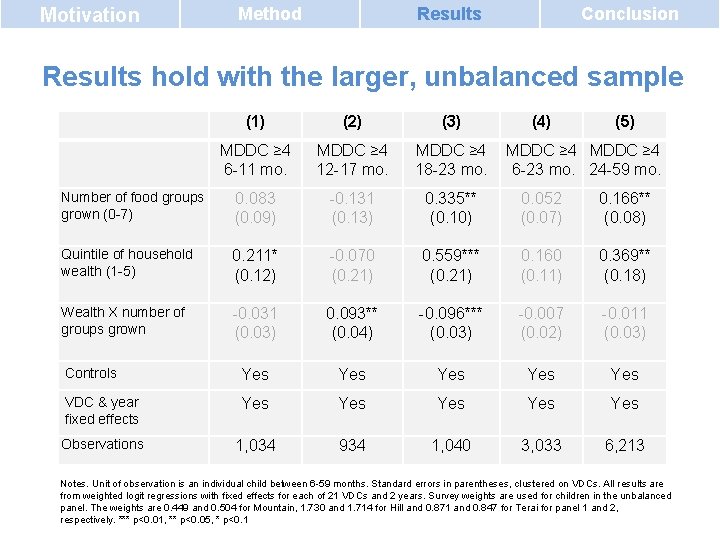
Motivation Method Results Conclusion Results hold with the larger, unbalanced sample (1) (2) (3) (4) (5) MDDC ≥ 4 6 -11 mo. MDDC ≥ 4 12 -17 mo. Number of food groups grown (0 -7) 0. 083 (0. 09) -0. 131 (0. 13) 0. 335** (0. 10) 0. 052 (0. 07) 0. 166** (0. 08) Quintile of household wealth (1 -5) 0. 211* (0. 12) -0. 070 (0. 21) 0. 559*** (0. 21) 0. 160 (0. 11) 0. 369** (0. 18) Wealth X number of groups grown -0. 031 (0. 03) 0. 093** (0. 04) -0. 096*** (0. 03) -0. 007 (0. 02) -0. 011 (0. 03) Controls Yes Yes Yes VDC & year fixed effects Yes Yes Yes Observations 1, 034 934 1, 040 3, 033 6, 213 MDDC ≥ 4 18 -23 mo. 6 -23 mo. 24 -59 mo. Notes. Unit of observation is an individual child between 6 -59 months. Standard errors in parentheses, clustered on VDCs. All results are from weighted logit regressions with fixed effects for each of 21 VDCs and 2 years. Survey weights are used for children in the unbalanced panel. The weights are 0. 449 and 0. 504 for Mountain, 1. 730 and 1. 714 for Hill and 0. 871 and 0. 847 for Terai for panel 1 and 2, respectively. *** p<0. 01, ** p<0. 05, * p<0. 1
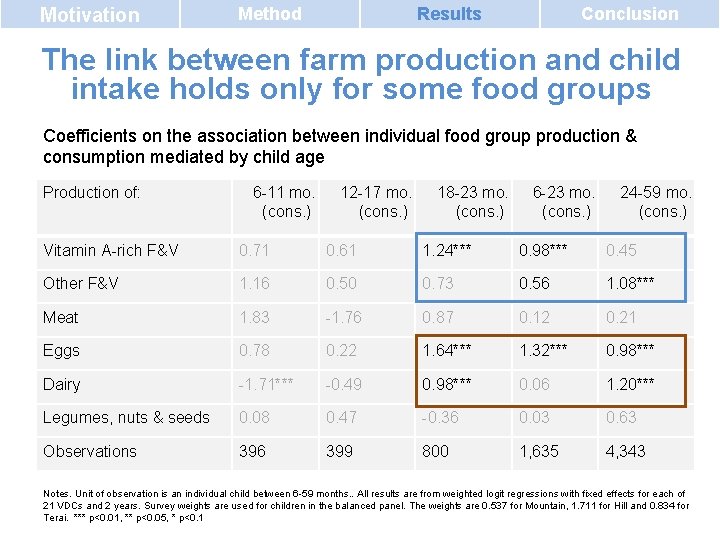
Motivation Method Results Conclusion The link between farm production and child intake holds only for some food groups Coefficients on the association between individual food group production & consumption mediated by child age Production of: 6 -11 mo. (cons. ) 12 -17 mo. (cons. ) 18 -23 mo. (cons. ) 6 -23 mo. (cons. ) 24 -59 mo. (cons. ) Vitamin A-rich F&V 0. 71 0. 61 1. 24*** 0. 98*** 0. 45 Other F&V 1. 16 0. 50 0. 73 0. 56 1. 08*** Meat 1. 83 -1. 76 0. 87 0. 12 0. 21 Eggs 0. 78 0. 22 1. 64*** 1. 32*** 0. 98*** Dairy -1. 71*** -0. 49 0. 98*** 0. 06 1. 20*** Legumes, nuts & seeds 0. 08 0. 47 -0. 36 0. 03 0. 63 Observations 396 399 800 1, 635 4, 343 Notes. Unit of observation is an individual child between 6 -59 months. . All results are from weighted logit regressions with fixed effects for each of 21 VDCs and 2 years. Survey weights are used for children in the balanced panel. The weights are 0. 537 for Mountain, 1. 711 for Hill and 0. 834 for Terai. *** p<0. 01, ** p<0. 05, * p<0. 1
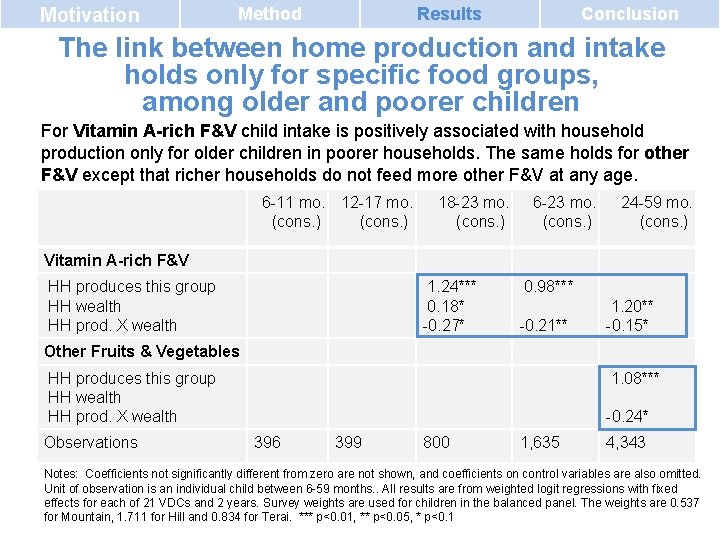
Motivation Method Results Conclusion The link between home production and intake holds only for specific food groups, among older and poorer children For Vitamin A-rich F&V child intake is positively associated with household production only for older children in poorer households. The same holds for other F&V except that richer households do not feed more other F&V at any age. 6 -11 mo. 12 -17 mo. (cons. ) 18 -23 mo. (cons. ) 6 -23 mo. (cons. ) 24 -59 mo. (cons. ) Vitamin A-rich F&V HH produces this group HH wealth HH prod. X wealth 1. 24*** 0. 18* -0. 27* 0. 98*** -0. 21** 1. 20** -0. 15* Other Fruits & Vegetables HH produces this group HH wealth HH prod. X wealth Observations 1. 08*** -0. 24* 396 399 800 1, 635 4, 343 Notes: Coefficients not significantly different from zero are not shown, and coefficients on control variables are also omitted. Unit of observation is an individual child between 6 -59 months. . All results are from weighted logit regressions with fixed effects for each of 21 VDCs and 2 years. Survey weights are used for children in the balanced panel. The weights are 0. 537 for Mountain, 1. 711 for Hill and 0. 834 for Terai. *** p<0. 01, ** p<0. 05, * p<0. 1
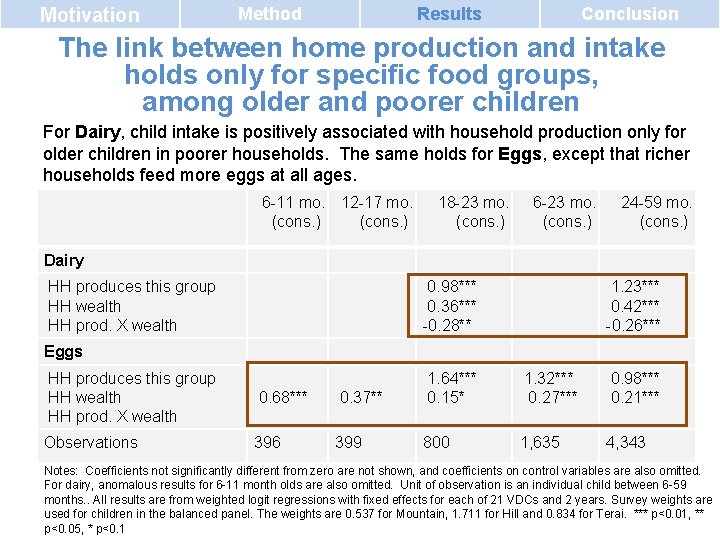
Motivation Method Results Conclusion The link between home production and intake holds only for specific food groups, among older and poorer children For Dairy, child intake is positively associated with household production only for older children in poorer households. The same holds for Eggs, except that richer households feed more eggs at all ages. 6 -11 mo. 12 -17 mo. (cons. ) 18 -23 mo. (cons. ) 6 -23 mo. (cons. ) 24 -59 mo. (cons. ) Dairy HH produces this group HH wealth HH prod. X wealth 0. 98*** 0. 36*** -0. 28** 1. 23*** 0. 42*** -0. 26*** Eggs HH produces this group HH wealth HH prod. X wealth 0. 68*** Observations 396 0. 37** 1. 64*** 0. 15* 1. 32*** 0. 27*** 0. 98*** 0. 21*** 399 800 1, 635 4, 343 Notes: Coefficients not significantly different from zero are not shown, and coefficients on control variables are also omitted. For dairy, anomalous results for 6 -11 month olds are also omitted. Unit of observation is an individual child between 6 -59 months. . All results are from weighted logit regressions with fixed effects for each of 21 VDCs and 2 years. Survey weights are used for children in the balanced panel. The weights are 0. 537 for Mountain, 1. 711 for Hill and 0. 834 for Terai. *** p<0. 01, ** p<0. 05, * p<0. 1
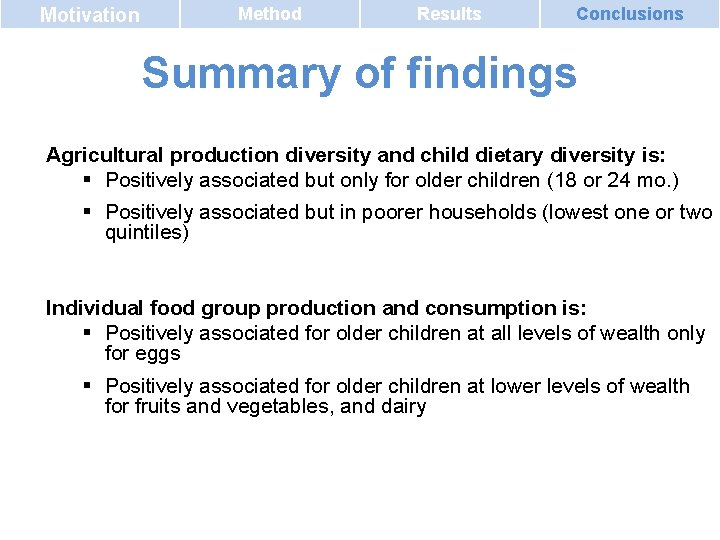
Motivation Method Results Conclusions Summary of findings Agricultural production diversity and child dietary diversity is: § Positively associated but only for older children (18 or 24 mo. ) § Positively associated but in poorer households (lowest one or two quintiles) Individual food group production and consumption is: § Positively associated for older children at all levels of wealth only for eggs § Positively associated for older children at lower levels of wealth for fruits and vegetables, and dairy
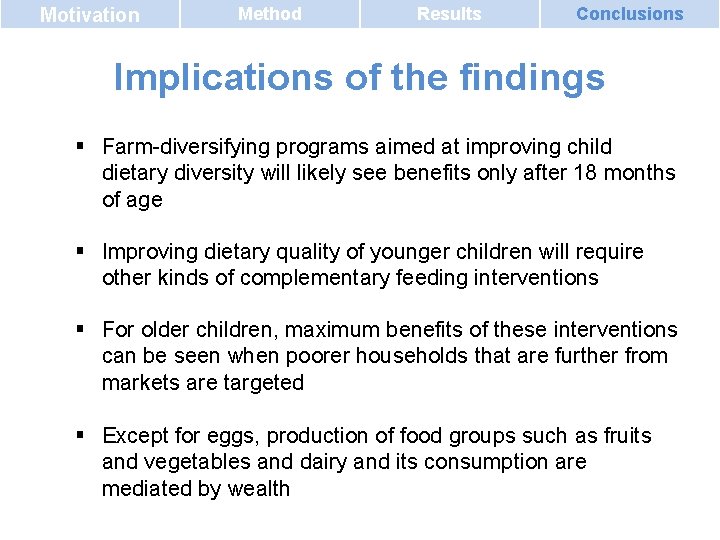
Motivation Method Results Conclusions Implications of the findings § Farm-diversifying programs aimed at improving child dietary diversity will likely see benefits only after 18 months of age § Improving dietary quality of younger children will require other kinds of complementary feeding interventions § For older children, maximum benefits of these interventions can be seen when poorer households that are further from markets are targeted § Except for eggs, production of food groups such as fruits and vegetables and dairy and its consumption are mediated by wealth
Appendix
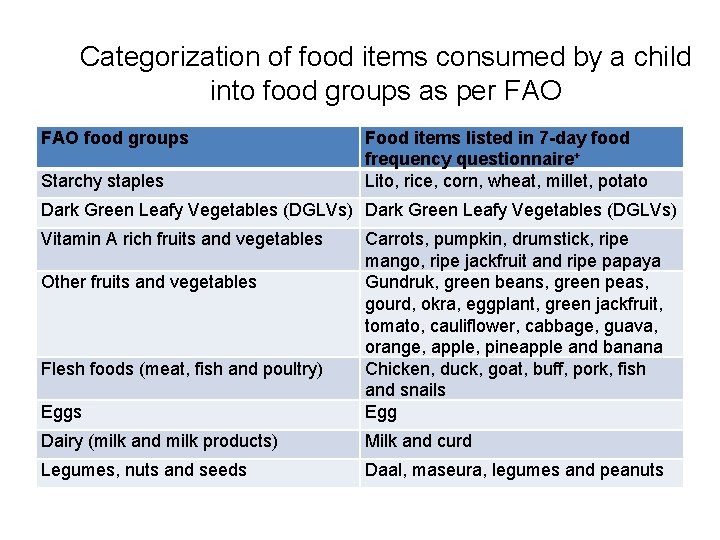
Categorization of food items consumed by a child into food groups as per FAO food groups Starchy staples Food items listed in 7 -day food frequency questionnaire+ Lito, rice, corn, wheat, millet, potato Dark Green Leafy Vegetables (DGLVs) Vitamin A rich fruits and vegetables Eggs Carrots, pumpkin, drumstick, ripe mango, ripe jackfruit and ripe papaya Gundruk, green beans, green peas, gourd, okra, eggplant, green jackfruit, tomato, cauliflower, cabbage, guava, orange, apple, pineapple and banana Chicken, duck, goat, buff, pork, fish and snails Egg Dairy (milk and milk products) Milk and curd Legumes, nuts and seeds Daal, maseura, legumes and peanuts Other fruits and vegetables Flesh foods (meat, fish and poultry)
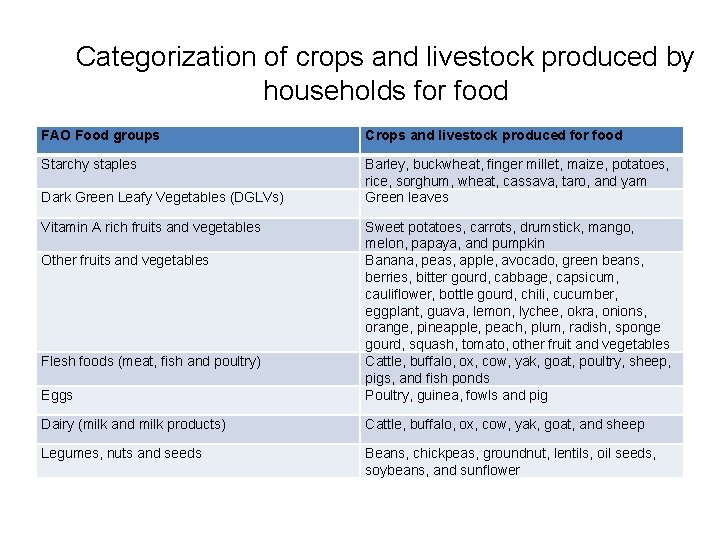
Categorization of crops and livestock produced by households for food FAO Food groups Crops and livestock produced for food Starchy staples Barley, buckwheat, finger millet, maize, potatoes, rice, sorghum, wheat, cassava, taro, and yam Green leaves Dark Green Leafy Vegetables (DGLVs) Vitamin A rich fruits and vegetables Eggs Sweet potatoes, carrots, drumstick, mango, melon, papaya, and pumpkin Banana, peas, apple, avocado, green beans, berries, bitter gourd, cabbage, capsicum, cauliflower, bottle gourd, chili, cucumber, eggplant, guava, lemon, lychee, okra, onions, orange, pineapple, peach, plum, radish, sponge gourd, squash, tomato, other fruit and vegetables Cattle, buffalo, ox, cow, yak, goat, poultry, sheep, pigs, and fish ponds Poultry, guinea, fowls and pig Dairy (milk and milk products) Cattle, buffalo, ox, cow, yak, goat, and sheep Legumes, nuts and seeds Beans, chickpeas, groundnut, lentils, oil seeds, soybeans, and sunflower Other fruits and vegetables Flesh foods (meat, fish and poultry)
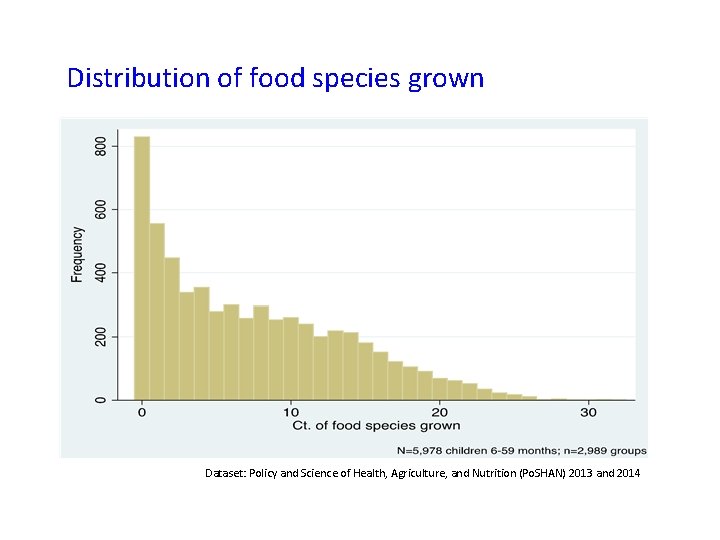
Distribution of food species grown Dataset: Policy and Science of Health, Agriculture, and Nutrition (Po. SHAN) 2013 and 2014
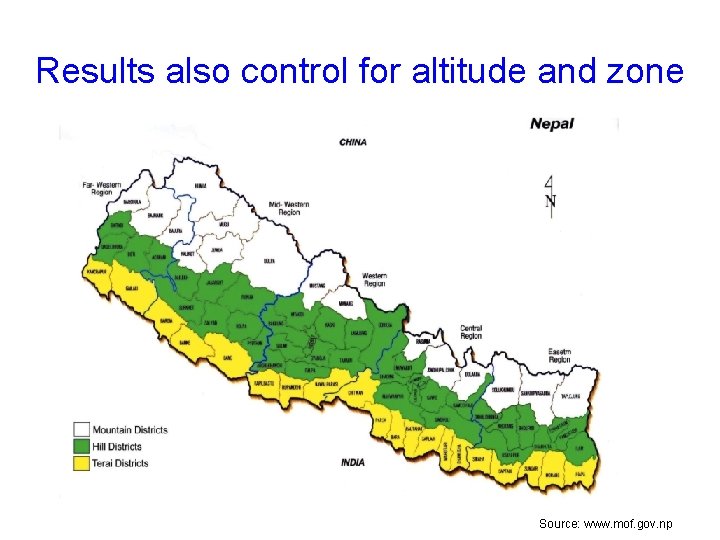
Results also control for altitude and zone Source: www. mof. gov. np
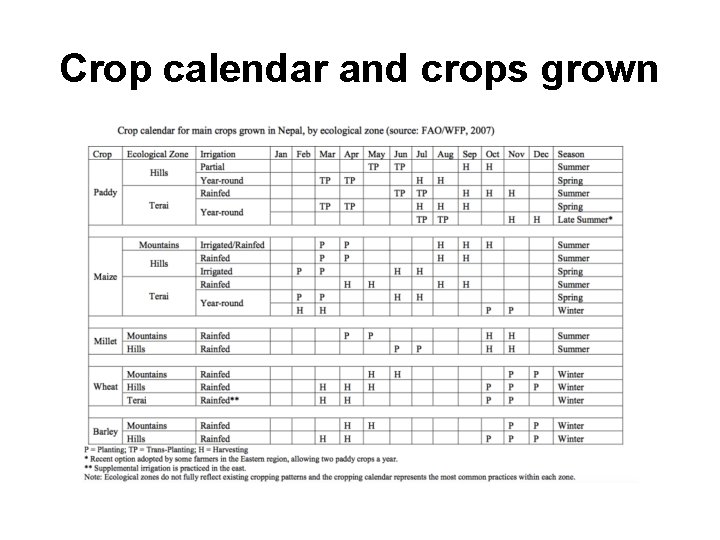
Crop calendar and crops grown
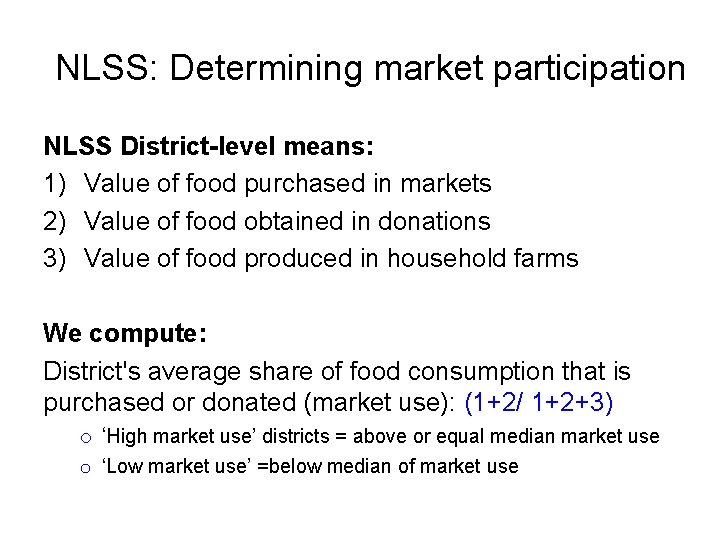
NLSS: Determining market participation NLSS District-level means: 1) Value of food purchased in markets 2) Value of food obtained in donations 3) Value of food produced in household farms We compute: District's average share of food consumption that is purchased or donated (market use): (1+2/ 1+2+3) o ‘High market use’ districts = above or equal median market use o ‘Low market use’ =below median of market use
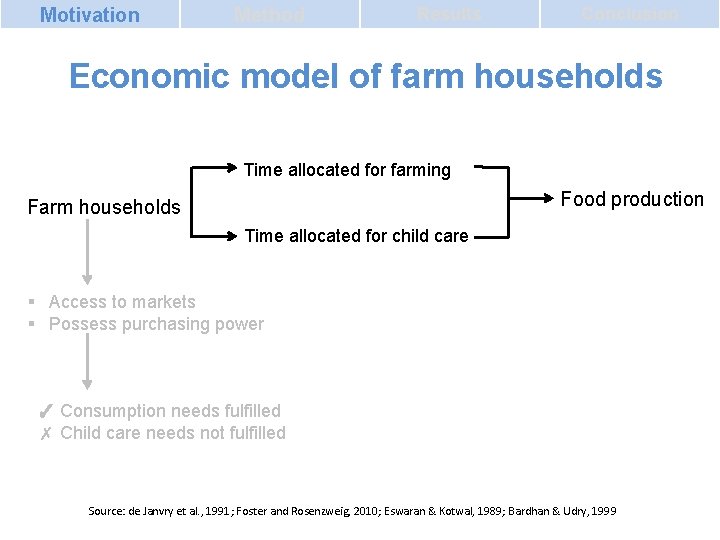
Motivation Method Results Conclusion Economic model of farm households Time allocated for farming Food production Farm households Time allocated for child care § Access to markets § Possess purchasing power ✓ Consumption needs fulfilled ✗ Child care needs not fulfilled Source: de Janvry et al. , 1991; Foster and Rosenzweig, 2010; Eswaran & Kotwal, 1989; Bardhan & Udry, 1999
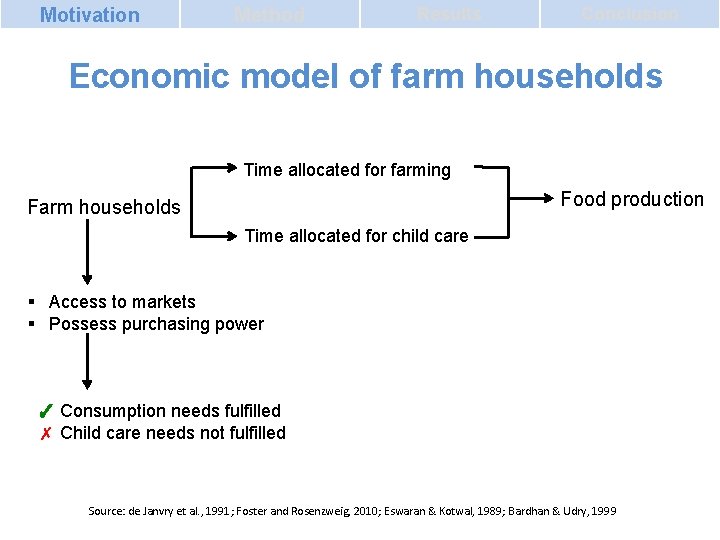
Motivation Method Results Conclusion Economic model of farm households Time allocated for farming Food production Farm households Time allocated for child care § Access to markets § Possess purchasing power ✓ Consumption needs fulfilled ✗ Child care needs not fulfilled Source: de Janvry et al. , 1991; Foster and Rosenzweig, 2010; Eswaran & Kotwal, 1989; Bardhan & Udry, 1999