Crop Spec A Collaborative Partnership A real time

Crop Spec, A Collaborative Partnership A real time integrated plant nutrient monitoring and application system for Agricultural equipment

• Founded 1905 • World’s Largest Manufacture of Fertilizer • 2008 • Founded 1932 • World Leading Company in Optical and Positioning Technologies • 2008 $ 1 Bil in Sales – $ 7+ Bil in Sales • PA business since 2007, – 20+ Bil tonnes • 20+ years experience in • Research on N uptake Ag Applications, Rate dating to 1960’s Control, VRA, Consoles

The Challenge • Nutrient supply within a field can be highly variable • Soil Ability to exchange nutrients can vary • Uniform Blanket application of nitrogen fertilizer can result in over- and underfertilization • Measure the current local nitrogen supply • Adapt Application Rate to Meet Crop Requirement

Yara Electronic Products , 1995 - Present

The measurement principle The N-Tester measures the total chlorophyll content of the leaf which is closely related to the nitrogen concentration in the leaf. 3, 5 r² = 0. 88 N % in leaves 3 2, 5 2 1, 5 250 300 350 400 450 N-Tester readings Objective: To decide on a N fertilizer requirement based on N-Tester reading Date: 2006 -01 -31 - Page: 5 500 550 600

Plant Nutrition, Based upon Crop Need “Just In Time” Plant Nutrition Measurement Calculation of N fertilizer demand N application

® Yara N-Sensor adoption Number of units by countries as of spring 2009: 800+

Interaction of Light with Leaves Sensing Chlorophyll in the Plant Specular Reflectance Diffuse Reflectance Chlorophyll pigments Absorption Cells Bottom layer

Crop. Spec - Sensing Head TM Multiple transmitters, one receiver • Modulated light source => Pulse Laser Diodes • 2 spectral channels • Temperature control Pulse Laser Diode (1 W) 10 k. Hz temperature controlled optics Modulation control unit Demodulation Photo Diode High Pass Filter

Waveband to Chlorophyll relationship The basis for getting meaningful crop information • accurate measurements in various crops and over a wide range of crop densities • based on know-how and extensive field trial work by Yara • 730 -740 nm & 800 -810 nm Source: Reusch, 2005

Impact of different N supply on the reflectance spectra of winter wheat Reflectance 0, 6 N Supply Increase due to increased biomass 0, 5 200 kg/ha 120 kg/ha 0, 4 60 kg/ha 0, 3 0, 2 0, 1 0 450 N response trail, 1994 Decrease due to increased chlorophyll content IR 500 550 600 650 700 750 800 850 Wavelenght, nm IR è N status of crops can be measured by analysing reflectance spetral data => nondestructive, non-contacting Date: 2006 -01 -31 - Page: 11

System testing

Crop. Spec. TM – specifications Environment IP 67 compliant Laser safety Class 1 or Class 1 M Physical Dimensions 200 mm x 80 mm Mounting height 2 - 4 meters Viewing angle 45°- 55° Temperature 0 - 60°Celsius Operational wavebands 730 -740 nm and 800 -810 nm Supply voltage 10 -32 VDC Supply current 5 A

Sensor Viewing geometry d/2 v 50° 16° h x 1 x 2 sensed area H X 1 X 2 Footprint (width) 2 m 0. 89 m + d/2 2. 97 m + d/2 2. 08 m 3 m 1. 34 m + d/2 4. 45 m + d/2 3. 11 m 4 m 1. 78 m + d/2 5. 93 m + d/2 4. 15 m

Large Sensor Footprint 3 m

Cab Mounted Sensors • Geometry provides largest footprint per sensor in the industry • Sensing Larger % of Area to be Applied – Redundancy in Left and Right viewing areas • Safety and Stability of Sensors – Less potential for damage • Viewing crop at an angle, rather than from 90 degrees directly above – Minimize affects of shadowing, crop movement, etc. • Light Source and Detector at Uniform Angle to Crop – Minimize affects of crop movement, weak crop stands.

Crop Spec System Diagram RS 232 Topcon X 20 CANBUS Implement with Liquid or Granular Application

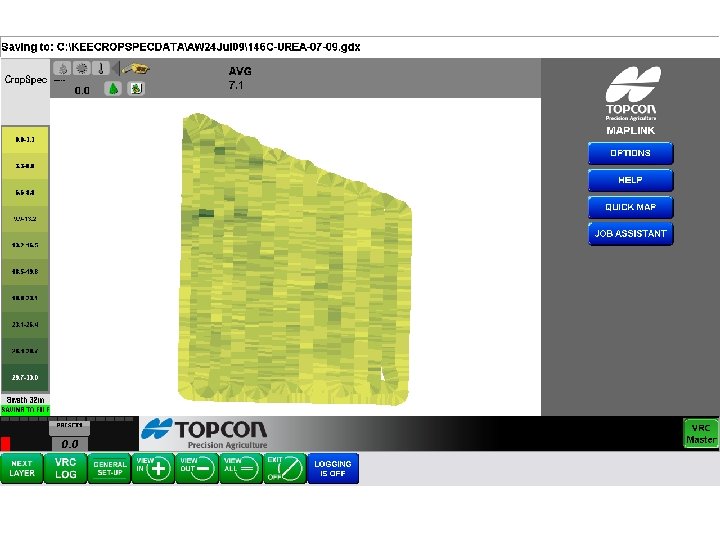
X 20 as Controller and Data Collector

Biomass map N application map Field size: 60. 6 ha Minimum: 0 kg/ha Average: 62 kg/ha Maximum: 110 kg/ha

Reliable measurements day and night

Designed to facilitate Accuracy and Repeatability

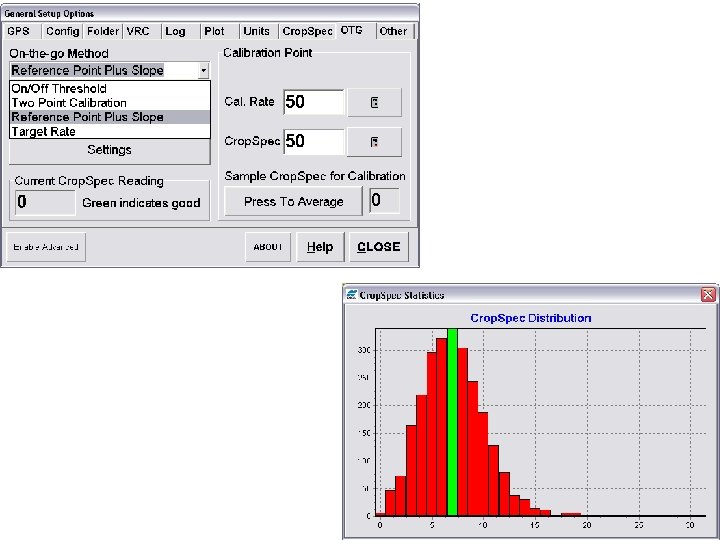
Crop. Spec Operational Modes • Read and Record – allows the user to collect and store data for offline analysis and creation of prescription maps – Use of various tools to develop prescription • User Determined Rate Control – 2 point Calibration, User sets High and Low – Field Observation point and use existing algorithm – “On the Go” Averaging with User determined target rate • “On-the-Go” Application using Yara Agronomics – uses Yara’s crop specific algorithms to determine optimum amounts of fertilizer for real time variable rate application

Achievable Yield Advantage 1999 -2002, 160 Yara N-Sensor trials Average: 1. 8 dt/ha = 2. 3 %

Advantages of N-Sensor Controlled Nitrogen Application • Yield increase 2 -3% • Easier and better harvesting • More homogeneous grain quality • Lower risk of lodging • Better nitrogen use efficiency Achievable profit: 30 – 100 €/ha • Full documentation of the fertilizer application
 Research Centre Hanninghof")
Relationship between reflectance measurements and N uptake active measurement (N-Sensor ALS) Research Centre Hanninghof - JJa - Date: 2006 -07 -20 - Page: 25

Preliminary research results
- Slides: 28