Methods of Social Network Analysis explained with help


,")


 contacts among the COLLNET-members at the")
 contacts (joint projects or papers")


 of COLLNET Sample Set The bibliographies data of the 64")
 we have : -")


 Otte and Rousseau (2002) recently showed that social network analysis (SNA) can")
 Network")


:")

 A B C D")


 is an indicator for the level")


")

 that pass through")


=6 BCU (b)=4 BCUs (a)=1 BCUs (b)=0. 67")
)/max value possible can be applied for determining degree, closeness")
 GDC= ------------- (V-1)(V-2) DCmax=")


 are related to Wassermann")


: Two years later in September 2000, in conjunction with the")
: Future strategies were discussed at the 4 th COLLNET Meeting")

. Co-authorship, rational Erdös numbers, and")
, Elite researchers in ophthalmology: Aspects of publishing")
. Not Just a Matter of Time: Field")
, Collaboration patterns in Indian and Bulgarian epidemiology of")
. What is the link doing here? Beginning a fine-grained process of")

- Slides: 80
Methods of Social Network Analysis explained with help of Collaboration Networks in COLLNET Hildrun Kretschmer Department of Library and Information Science, Humboldt-University of Berlin, Germany E-mail: kretschmer. h@onlinehome. de
Abstract • There is a rapid increase of network analysis in several scientific disciplines beginning some decades ago. The social network analysis (SNA) is developed especially in sociology and in social psychology in collaboration with mathematics, statistics and computer science. Social network analysis (SNA) can also be used successfully in the information sciences, as well as in studies of collaboration in science. Several methods of social network analysis will be explained with help of collaboration networks in COLLNET.
The growing importance of collaboration in research and the still underdeveloped state-of-the-art of research on collaboration have encouraged scientists from more than 20 countries to establish in 2000 a global interdisciplinary research network under the title “Collaboration in Science and in Technology” (COLLNET) with Berlin as its virtual centre. The intention is to work together in co-operation both on theoretical and applied aspects. Since September 2000 seven COLLNET conferences were organized in six countries. The 8 th COLLNET Meeting will be held in March 2007 in New Delhi, India.
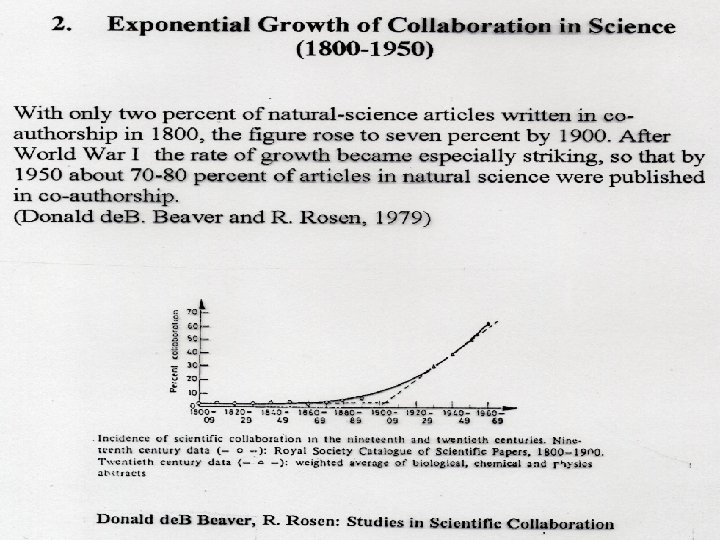
Introduction The increase in scientific-technical collaboration in the course of history has been vividly documented through a number of analytical studies. For example, it has been shown that between 1650 and 1800 not more than 2. 2% of scientific papers were published in coauthorship. By contrast, the second half of the 20 th century is characterized the world over by teamwork and coauthorships in the natural sciences and in medicine, i. e. about 60 -70% of the scientific papers were published during this period in co-authorship. (De. B. Beaver & Rosen 1978; 1979 a & b).
With the importance of collaboration in research and technology growing world-wide, it has become necessary to examine the processes involved in order to become aware of the implications for the future organization of research as well as those for science and technology policy. This has led to an increase in the number of scientific studies of this topic internationally. (Glanzel 2002, Borgman, C. L. & Furner, J. 2002). The outstanding works of Donald de. B. Beaver (1978), Derek John de Solla Price (1963) and others on the topic of collaboration in science have, over a number of years, encouraged a number of scientists working in the field of quantitative scientific research to concentrate their research in this field.
This has led both to an increase in the number of relevant publications concerning this topic in international magazines, and to an increase in the number of lectures in international conferences (Basu 2001, Braun et. al. 2001, Davis 2001, Havemann 2001, Wagner-Döbler 2001, Kundra & Tomov 2001).
By all accounts, this field of research is required to be a comprehensive and diversified area ranging from small-group research in social psychology/sociology to large network analyses conducted into international co-authorship or citation networks, including the concomitant observation of informal communication via interviews or interrogative surveys on bibliometrical analyses. A common bibliometric method for measuring the cooperation is the analysis of co-authorship networks. A suitable webometric method has to be developed in the future.
There are various references to the positive effect of "multiauthored papers" in the co-authorship network: for example several studies show that international cooperation is linked with a higher `citation impact' (Glänzel 2002). The investigation of these processes can be made by analyses at the micro level (individuals), at the meso level (institutions) or at the macro level (countries) (Glänzel 2002). In the field of science studies one most frequently comes across investigations on international cooperation in science, followed by cooperation relationships between institutions.
The last few years have seen an ascendancy in how to treat these international issues. However, this trend has still failed to provide a concept on a fundamental and interrelated theory regarding theme entitled ´Collaboration in science and in technology´. The different approaches taken so far have revealed the shortcomings of integration. On account of the diversity of these issues it is possible to obtain promising results only against the backdrop of an interdisciplinary approach and from an intercultural viewpoint. Both aspects are of basic importance in COLLNET.
In summary: The rise in collaboration in science and technology experienced world-wide at national and international level, has assumed such an overriding importance that there is now an urgent need perceptible to study such processes with a view to acquiring fundamental knowledge for organizing future research and its application to science and technology policies.
Foundation of COLLNET Therefore in the year 2000 the time had come in the meantime to create a global interdisciplinary research network COLLNET on the topic "Collaboration in Science and in Technology" with 64 members from 20 countries of all continents. The members intended to work in cooperation on both theoretical and applied aspects on the topic "Collaboration in Science and in Technology". The focus of this group is to examine the phenomena of collaboration in science, its effect on productivity, innovation and quality, and the benefits and outcomes accruing to individuals, institutions and nations of collaborative work and co-authorship in science.
Web site: www. collnet. de Journal: Journal of Information Management and Scientometrics (Incorporating the COLLNET Journal) COLLNET Meetings (2000 -2006): - First COLLNET Meeting, September 2000, Berlin, Germany - Second COLLNET Meeting, February 2001, New Delhi, India - Third COLLNET Meeting, July 2001, Sydney, Australia - Fourth COLLNET Meeting, August 2003, Beijing, China - Fifth COLLNET Meeting, March 2004, Roorkee, India - Sixth COLLNET Meeting, July 2005, Stockholm, Sweden - Seventh COLLNET Meeting, May 2006, Nancy, France Papers in Co-authorship between COLLNET Members: 223 co-authored papers (lifetime, starting before official foundation of COLLNET)
The establishment of COLLNET has been reported in a special issue of the international journal Scientometrics. In this report, the work of both the first and second meetings were outlined (Kretschmer, H. , L. Liang and R. Kundra, 2001). The history and subsequent development of COLLNET is described in the following sections. The areas of expertise represented by member scientists in COLLNET are varied: mathematics, physics, chemistry, biology, medicine, history of science, social sciences and psychology. The team includes many senior scientists such as directors and/or deputy directors of large establishments, organizers and/or deputy organizers of world conferences in the field of scientometrics and informetrics as well as winners of the Derek John de Solla Price Medal.
Among these are board members of the International Society for Scientometrics and Informetrics (ISSI), members of the German Society for Psychology and advisors to the international journal, Scientometrics. Current principal investigators, mainly from the field of quantitative scientific research (scientometrics and informetrics), engage in teamwork on the nature, characteristics, growth and policy relevance of collaboration and co-author networks. It is proposed to include in future more experts from other fields of scientific research and particularly from the social sciences, such as psychology and sociology.
COLLNET has been an important catalyst for research on collaboration and has provided opportunities for members to meet face to face at various international conferences such as at ISSI conferences (held every two years since 1987). However, neither of these international conferences is focussed solely on issues relating to collaboration or collaborative networks, thus establishment of COLLNET in 2000 has opened an important forum in which ideas and work on these issues is exchanged. Closer personal contact between members inevitably leads to formal and informal agreements on collaborative projects on these crucial issues in research production.
Growth of Collaboration/Communication Structures in COLLNET Since 2000 Two studies are presented: - Development of informal and formal contacts between COLLNET members - Development of the co-authorship network
Development of Informal and Formal Contacts Between COLLNET Members The questionnaire distributed to all of the COLLNET members asked for the following details: Names of those COLLNET members with whom informal (loose) contacts exist in some form (either as e-mail or exchange of reprints). - Names of those with whom formal (intensive) contacts exist in the form of discussions on common projects with definitive titles or in the form of co-authorship of joint papers. The development of collaborative growth within the framework of COLLNET has been illustrated in Figures 2, 3 and 4.
Fig. 2 shows the number of informal (loose) contacts among the COLLNET-members at the time of the Second COLLNET Meeting in February 2001. All the COLLNET members are compiled country-wise. 16 countries participated in COLLNET in the month of February. The line joining the front corner of Fig. 2: (1/1) to the opposite rear corner (16/16) represents the main diagonal in which the contacts among COLLNET members of the same country have been plotted. As seen from Fig. 2, February 2001 witnessed the maximum number of informal (loose) contacts among COLLNET members within Germany (1/1) and between Germany and India (1/2). Informal contacts between other countries can also be observed.
Fig. 3 shows the number of the formal (intensive) contacts (joint projects or papers with definitive titles) as on the date of establishment of COLLNET, viz. 1 st January 2000.
Fig. 4 shows the increase in these formal contacts over the one and a half years preceding the 3 rd COLLNET Meeting.
Fig. 2 Fig. 3 Fig. 4 It can be seen from the main diagonal in Fig. 3 that at the time when COLLNET was established, almost all the formal (intensive) contacts existed only among members belonging to the same country of origin. However, Fig. 4 shows that during the subsequent period, the intensive contacts had expanded across the different countries. Fig. 4 resembles Fig. 2 in the graphical structural representation of informal (loose) contact.
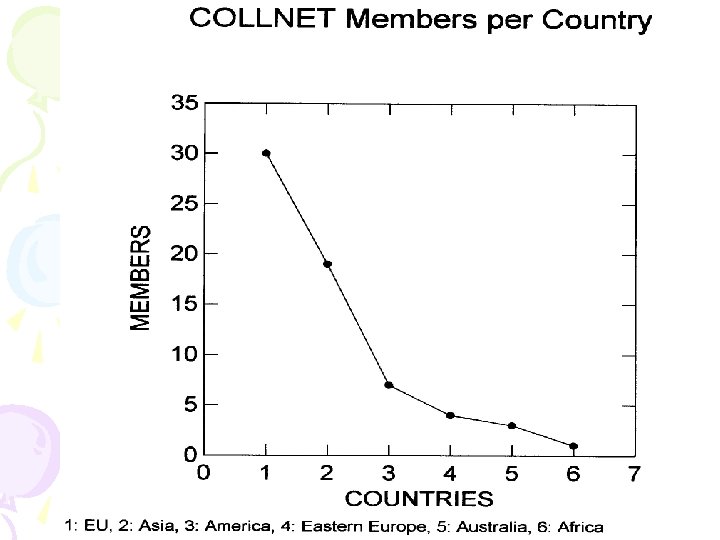
Social Network Analysis (SNA) of COLLNET Sample Set The bibliographies data of the 64 COLLNET members were examined, under them: - - 26 female and 38 male scientists 30 members from the European Union (EU) and 34 from non-European Union countries (N)
From the 34 members from the non-European Union countries (N) we have : - - - 3 from Australia 7 from America (4 of them from North America) 19 from Asia 4 from Eastern Europe 1 from South Africa The last COLLNET data are from June 2003.
Data Assuming that the reflection of collaboration is not limited to articles in SCI- or other data bases, a request was made to all the 64 COLLNET members for their complete bibliographies, independently of the type of the publications and independently from the date of appearance of these publications.
From these bibliographies all publications were selected that appeared in co-authorship between at least two COLLNET members. Thus, it concerns 223 bibliographic multi-authored publications. From this, the respective number of common publications between two members was determined as the basis for the analysis of the co-authorship network (SNA). The co-authorship network developed according to this method covers the entire lifetime collaboration between the COLLNET members.
Developmental and structural formation processes in the bibliographic networks are studied. For information and brief overview the classification of the 223 bibliographic multi-authored publications according to their type is shown: CATEGORIES 1. Articles in Scientometrics 2. Articles in JASIS 13 3. Papers in monographs 68 4. Papers from conference proceedings 77 5. Books NUMBER 55 Total Sum 223 10
Methods (SNA) Otte and Rousseau (2002) recently showed that social network analysis (SNA) can be used successfully in the information sciences, as well as in studies of collaboration in science. The authors showed interesting results by the way of an example of the co-authorship network of those scientists who work in the area of social network analysis. Otte and Rousseau refer in their paper to the variety of the application possibilities of SNA, as well as to the applicability of SNA to the analysis of social networks in the Internet (webometrics, cybermetrics).
Introduction to SNA (copied partly from the paper by Otte and Rousseau, 2002) Network studies are a topic that has gained increasing importance in recent years. The fact that the Internet is one large network is not foreign to this. Social network theory directly influences the way researchers nowadays think and formulate ideas on the Web and other network structures such as those shown in enterprise interactions. Even within the field of sociology or social psychology network studies are becoming increasingly important. In their article Otte and Rousseau are going to study social network analysis and show this topic may be linked to the information sciences. It goes without saying that also Internet studies are to be mentioned, as the WWW represents a social network of a scale unprecedented in history.
Interest in networks, and in particular in social network analysis, has only recently bloomed in sociology and in social psychology. There are, however, many related disciplines where networks play an important role. Examples are computer science and artificial intelligence (neural networks), recent theories concerning the Web and free market economy, geography and transport networks. In informetrics researchers study citation networks, collaboration structures and other forms of social interaction networks.
What is social network analysis? (copied partly from the paper by Otte and Rousseau, 2002) Social network analysis (SNA), sometimes also referred to as ‘structural analysis’, is not a formal theory, but rather a broad strategy of methods for investigating social structures. The traditional individualistic social theory and data analysis considers individual actors making choices without taking the behaviour of others into consideration. This traditional individualistic approach ignores the social context of the actor. One could say that properties of actors are the prime concern here. In SNA, however, the relations between actors become the first priority, and individual properties are only secondary.
Social network analysis conceptualises social structure as a network with ties connecting members and focuses on the characteristics of ties rather than on the characteristics of the individual members. One distinguishes two main forms of SNA: the ego-network analysis, and the global network analysis. In ‘ego’ studies the network of one person is analysed. An example in the information sciences is White’s description of the research network centred on Eugene Garfield. In global network analyses one tries to find all relations between the participants in the network. Growth in the number of published articles in the field of SNA The Fig. below clearly shows the fast growth of the field in recent years. More specifically, the real growth began around 1981, and there is no sign of decline.
Growth of social network analysis by Otte and Rousseau
Some notions from graph theory (copied partly from papers by Otte and Rousseau, 2002): Directed and undirected graphs: A directed graph G, in short: digraph, consists of a set of nodes, denoted as N(G), and a set of links (also called arcs or edges), denoted as L(G). In this text the words ‘network’ and ‘graph’ are synonymous. In sociological research nodes are often referred to as ‘actors’. A link e, is an ordered pair (X, Y) representing a connection from node X to node Y. Node X is called the initial node of link e, X = init(e), and node Y is called the final node of the link: Y = fin(e). If the direction of a link is not important, or equivalently, if existence of a link between nodes X and Y necessarily implies the existence of a link from Y to X we say that this network is an undirected graph.
A path from node X to node Y is a sequence of distinct links (X, u 1), (u 1, u 2), … , (uk, Y). A B C D The length of this path is the number of links. The length of the path from A to D can be 1 or 2 or 3. In this article we only use undirected graphs. Consequently, the following definitions are only formulated for that case. A co-authorship network is an example of an undirected graph: if author A co-authored an article with author B, automatically author B co-authored an article with A. An undirected graph can be represented by a symmetric matrix M = (m. XY), where m. XY is equal to 1 if there is an edge between nodes X and Y, and m. XY is zero if there is no direct link between nodes X and Y.
A B C D Symmetric matrix M = (m. XY) A B C D A 1 B 1 C 1 D 1 Asymmetric matrix M = (m. XY) A B C D A B C 1 D 1
Components: A component of a graph is a subset with the characteristic that there is a path between any node and any other one of this subset. If the whole graph forms one component it is said to be totally connected. A B C D E F There are 2 components above. Next we define some indicators describing the structure (cohesion) of networks and the role played by particular nodes. Many more are described in the literature, but we will restrict ourselves to these elementary ones.
Cliques A clique in a graph is a subgraph in which any node is directly connected to any other node of the subgraph Example: A B C D
Indicators The density of a co-authorship network (D) is an indicator for the level of connectedness of this network: D = Number L of edges divided by the maximum number Lmax of edges in the network. It is a relative measure with values between 0 and 1. Lmax=V (V-1)/2 with V=number of nodes D = 2 L / V(V-1) A B C D D = 2*2 / 4*3=0. 33
In addition, we shall also focus on some selected indicators of centrality describing the structure of networks and the role played by particular nodes (In analogy to Otte and Rousseau 2002, Wassermann & Faust 1994), Centrality measures: *Degree Centrality *Closeness *Betweenness • Degree Centrality of a node A is equal to the number of nodes (or edges) that are adjacent to A: DCA=EA A B C D DCA=3
The Degree Centrality of a node A is equal to the number of his/her collaborators or co-authors. An actor (node) with a high degree centrality is active in collaboration. He/she has collaborated with many scientists. The Degree Centrality in a V-node network can be standardised by dividing by V-1: DCAs=DCA/(V-1) Example above: DCAs=3/3=1 Mean Degree Centrality (MDC) of the network is the ratio of the sum of the Degree Centralities of all the nodes in the network to the total number of nodes: MDC=2 L/V Example above: MDC=2*3/4=1. 5
Closeness Centrality of a node is equal to the total distance (in the graph) of this node from all other nodes. CA= ΣYd. AY where d. AY is the number of ties in a shortest path from node A to node Y. A B C D The length of the path from A to D can be 1 or 2 or 3. d. AD=1; d. AC=1; d. AB=1 CA=3
Closeness is an inverse measure of centrality in that a larger value indicates a more central actor. For this reason the standardised closenenss is defined as CAs= (V-1)/ CA making it again a direct measure of centrality. CAs= (4 -1)/ 3=1 The Closeness Centrality can be calculated only in connected graphs or in connected subgraphs because the shortest path between two nodes of disconnected graphs is infinite (∞), for example the shortest path between B and E. A B C D E F
Betweenness Centrality BCA is the number of shortest paths (distance dxy) that pass through A. Otte and Rousseau mention actors (nodes) with a high betweenness play the role of connecting different groups or are ´middlemen´. Wasserman and Faust (1994, p. 188) mention: ´Interactions between two nonadjacent actors might depend on the other actors in the set of actors who lie on the paths between the two. These “other” actors potentially might have some control over the interactions between the two nonadjacent actors. ´ A particular “other” actor in the middle, the one between the others, has some control over paths in the network.
BCA=ΣX, Y GXAY/ GXY GXAY is the number of shortest paths from node X to node Y passing through node A. GXY is the number of shortest paths from node X to node Y (X, Y≠A). A B C D shortest path from node B to node C: d. BC=1 B to C: GBC=1; (not passing through node A), GBAC=0; GBAC/ GBC=0 B to D: d. BD=2; GBAD=1; G BAD/ GBD=1/2=0. 5 C to D: d. CD=1; GCAD=0; G CAD/ GCD=0 BCA=0. 5
It can be shown that for an V-node network the maximum value for BCA is (V²-3 V+2)/2. Hence the standardised betweenness centrality is: BCAs= 2* BCA/(V²-3 V+2) In the example above: BCAs= 2*0. 5/(42 -3*4+2)=1/6=0. 17
Example: BCU=ΣX, Y GXUY/ GXY BCU (a)=6 BCU (b)=4 BCUs (a)=1 BCUs (b)=0. 67 BCU (c)=4 BCUs (c)=0. 67
The general formula: CNETWORK=(ΣX (Cmax-CX))/max value possible can be applied for determining degree, closeness or betweenness centrality for the whole network. These measures are relative measures with values between 0 and 1. Example: Group Degree Centralization Σ vi=1 (DCmax - DCX) GDC= ------------(V-1)(V-2) The DCX in the numerator are the V Degree Centralities of the nodes and DCmax is the largest observed value. This index reaches its maximum value of 1 when one actor (node) has collaborated with all other V-1 actor, and the other actors interact only with this one, central actor. This is exactly the case in a star graph. The index attains its minimum value of 0 when all degrees are equal
A C E B D Σ vi=1 (DCmax - DCX) GDC= ------------- (V-1)(V-2) DCmax= DCE=4 DCX= DCA= DCB= DCC = DCD=1 DCmax – DCX=4 -1=3 GDC=3*4/(5 -1)(5 -2)=1
Example: An SNA co-authorship network (partly copied from the paper by Otte and Rousseau, 2002): In this section Otte and Rousseau perform a network analysis of authors in the field of social network analysis. We will point out the central players and the underlying collaborative relationships between authors. Co-authorship, a (strong) form of collaboration, is not the only way to describe relations between scientific authors. Citation network, for instance, could reveal other relations, but these are not studied in this article.
In the 1601 articles dealing with SNA there were 133 authors occurring three times or more. Forming an undirected co-authorship graph (of these 133 authors) led to a big connected component of 57 authors, 2 components of 4 authors, 2 components of 3 authors, 7 small components consisting of two authors and 48 singletons. We will further concentrate on the central cluster of 57 authors. Most important scientists in the field belong to this cluster. Network analysis was performed using UCInet while the map was drawn with Pajek (Package for Large Network Analysis). The Fig. below shows the network of network analysts (central cluster of 57 authors).
The network of network analysts by Otte and Rousseau
Legend 1. D. D. Brewer 2. E. J. Bienenstock 3. S. D. Berkowitz 4. M. Gulia 5. P. Bonacich 6. H. R. Bernard 7. V. Batagelj 8. K. Carley 9. K. E. Campbell 10. P. Doreian 11. J. S. Erger 12. L. C. Freeman 13. K. Faust 14. A. Ferligoj 15. N. E. Friedkin 16. T. J. Fararo 17. J. Galaskiewicz 18. J. S. Hurlbert 19. C. Haythornthwaite 20. V. A. Haines 21. N. P. Hummon 22. I. Jansson 23. E. C. Johnsen 24. D. Krackhardt 25. P. D. Killworth 26. M. J. Lovaglia 27. B. A. Lee 28. P. V. Marsden 29. B. Markovsky 30. M. S. Mizruchi 31. D. L. Morgan 32. C. Mc. Carthy 33. M. Oliver 34. S. Potter 35. B. Potts 36. T. Patton 37. D. Ruan 38. J. Skvoretz 39. J. W. Salaff 40. T. A. B. Snijders 41. J. J. Suitor 42. F. N. Stokman 43. G. A. Shelley 44. M. Spreen 45. J. Szmatka 46. S. R. Thye 47. M. A. J. Van Duijn 48. G. G. Van de Bunt 49. B. Wellman 50. C. Webster 51. S. Wasserman 52. D. Willer 53. E. P. H. Zeggelink 54. K. L. Woodard 55. S. L. Wong 56. N. S. Wortley 57. S. Robinson
The density for the central network of network analysts is 0. 05. So this network is clearly not dense at all, but very loose. The author with the highest degree centrality is Barry Wellman (University of Toronto), who has a degree centrality of 9. The degree-centrality of the whole network is 11%, indicating that many authors are not connected. Another way of studying centrality is using the closeness indicator. This indicator is more general than the previous one, because it takes the structural position of actors in the whole network into account. A high closeness for an actor means that he or she is related to all others through a small number of paths. The most central author in this sense is Patrick Doreian (University of Pittsburgh). The closeness of the whole network is 14%.
Betweenness is based on the number of shortest paths passing through an actor. Actors with a high betweenness play the role of connecting different groups, are ‘middlemen’ and so on. Again Patrick Doreian has the highest betweenness. The betweenness of the whole network is 47%. UCInet found 16 cliques, this means: 16 subgraphs consisting of three or more nodes. The largest one consists of 6 authors: Bernard, Johnsen, Killworth, Mc. Carty, Shelley and Robinson. The second largest one consists of the five authors: Erger, Lovaglia, Markovsky, Skvoretz and Willer. Bibliometric analysis The most prolific authors in SNA (highest number of papers) show also a central role in the SNA network.
Results: Collaboration Networks in COLLNET (partly copied from the paper by Kretschmer, H. & Aguillo, I. ) In analogy to the study of the network analysts by Otte and Rousseau this paper examined the COLLNET collaboration network. Additionally, the development of the bibliographic COLLNET co-authorship network is examined over a specific time period. Thus, the social network analysis (SNA) is applied to structure formation processes in bibliographic networks. The results of the Web network (Reflection of the bibliographic network in the Web) are presented in a separate paper as well as Gender studies in the network. First let us have a view at the collaboration network obtained from the bibliographies in 2003 including all of the life time papers.
1. Isidro Aguillo 2. Petra Ahrweiler 3. R. Ambuja 4. Elise Bassecoulard 5. Aparna Basu 6. Donald de. B. Beaver 7. Sujit Bhattacharya 8. Maria Bordons 9. Martina Brandt 10. Mari Davis 11. Leo C. J. Egghe 12. Isabel Gomez 13. Ulla Grosse 14. Brij Mohan Gupta 15. Frank Hartmann 16. Frank Havemann 17. William W. Hood 18. Margriet Jansz 19. Karisiddappa 20. Sylvan Katz 21. Ved Prakash Kharbanda 22. Hildrun Kretschmer 23. Ramesh Kundra 24. Loet Leydesdorff 25. Liming Liang 26. Sofía Liberman 27. Zeyuan Liu 28. Valentina Markusova 29. Martin Meyer 30. Yoshiko Okubo 31. Farideh Osareh 32. Koti S. Raghavan 33. Ravichandra Rao 34. Ronald Rousseau 35. Jane Russell 36. Shivappa Sangam 37. Andrea Scharnhorst 38. Annedore Schulze 39. Dimiter Tomov 40. Rainer Voss 41. Caroline Wagner 42. Roland Wagner-Döbler 43. Yan Wang 44. Vera Wenzel 45. Concepcion S. Wilson 46. Paul Wouters 47. Yishan Wu 48. Michel Zitt 49. -64. are singletons up to June 2003. These 16 singletons are not included in the figure.
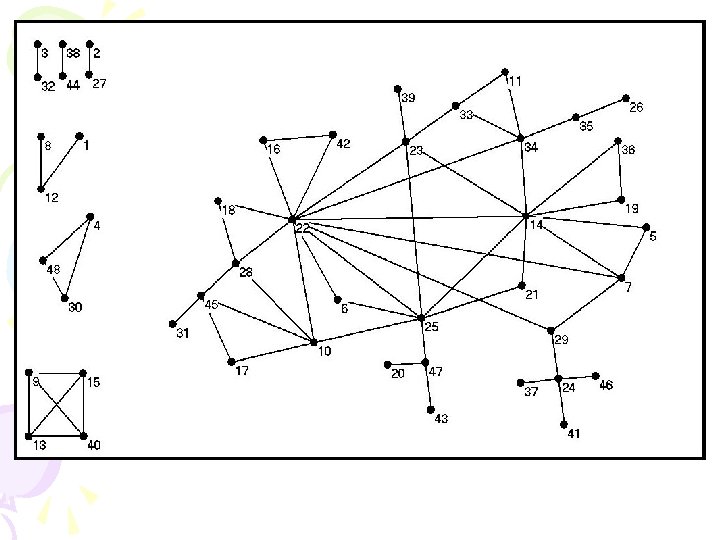
Bibliographic Co-authorship Network The methods of social network analysis (SNA) are related to Wassermann & Faust (1994) and to Otte & Rousseau (2002). There are 64 "nodes" (= 64 COLLNET members) in the network above (network from 2003) - 48 of these COLLNET members (= 75%) have published in co-authorship at least once with at least one of the other COLLNET members. That means, at least 1"edge" is adjacent to each of these 48 "nodes". - Differently expressed: Between two COLLNET members A and B, there exists an edge if both have published at least one publication in co-authorship. The members A and B are called "pair of collaborators” (A, B). There are LB=63 edges between the nodes or in other words 63 different pairs of collaborators respectively.
- A path from node X to node Y is a sequence of distinct edges between pairs of collaborators: (X, A 1), (A 1, A 2), …, (Aj, Y) The length of the path is equal to the number of distinct edges. The shortest path from X to Y is called distance d. XY. - The co-authorship structure of COLLNET is a "disconnected graph", i. e. , there is not a ''path'' between each pair of nodes X and Y. However the COLLNET members can be divided into several "connected subsets". A path also exists between all pairs of nodes in a "connected subset". The "connected subsets" are denoted as "components'' or ''cluster".
- However between a pair of nodes from different components there exists no path. The COLLNET co-authorship network consists of 23 components: *1 large central component of 32 members (57 by Otte and Rousseau) *1 component of 4 members (2 by O. & R. ) *2 components of 3 members (2 by O. & R. ) *3 components of 2 members (7 by O. & R. ) *16 singletons (48 by O. & R. ) The largest cluster covers 50% of the COLLNET members (43% in the network by Otte and Rousseau). In addition there are 22 small and very small (singletons) clusters (59 by O. & R. ). This structure of clusters, which contain a single very large cluster and also a large number of small clusters, is in agreement with the existing findings in the literature (Newman 2001, Genest & Thibault 2001, Kretschmer 2003, Otte & Rosseau 2002). It is possible this could denote a general rule in a special type of coauthorship network (? ).
The studied bibliographic co-authorship network in 2003 is a network with low density of DB=0. 031 (similar to the network of network analysts, studied by Otte and Rousseau: D=0. 05). However because of intended development studies the COLLNET results refer to the whole network but the results by O. & R. to the largest component only. Therefore, maybe the density value by O. & R. is higher than the other. The indicators density, mean degree centrality and betweenness centrality are applied in analyses of the bibliographic coauthorship network. The general formula is applied for Betweenness. Furthermore, the development of number of edges, number of components, number of singletons and the size of largest component (number of nodes in the largest component) are studied (Table 2).
Development of COLLNET Four stages are considered in the development of COLLNET: • Until 1997: Collaboration of the future COLLNET members before 1998 (preliminary stage) • Until 1999: Collaboration until 1999 (cumulative, including collaboration until 1997, i. e. preliminary stage and first step of COLLNET development) • Until 2001: Collaboration until 2001 (cumulative, including collaboration until 1997, i. e. preliminary stage, first and second steps of COLLNET development) • Until 2003: Collaboration until 2003 (cumulative, including collaboration until 1997, i. e. preliminary stage, first, second and third steps of COLLNET development)
Collaboration until 1997 Collaboration until 1999 Collaboration until 2001 Collaboration until 2003.
Table 2: Development of Bibliographic Networks 1997 1999 2001 2003 Number of edges or of pairs of collaborators 16 25 47 63 Number of components 48 44 30 23 Number of singletons 39 36 22 16 Size of largest 7 component 11 23 32 Density . 008 . 012 . 023 . 031 Mean degree centrality of the network MDC . 53 . 78 1. 47 1. 97 Betweenness . 008 . 028 . 101 . 22
The values of the indicators describing the structure of networks (density, mean degree centrality and betweenness) increase from 1997 to 2003 with a particular rise from 1999 to 2001 (cf. Figure). The growth in the number of pairs of collaborators (edges) is in correspondence with the growth of density. The probability is high that both the foundation of COLLNET and first COLLNET meeting in 2000 maybe the reasons for this increase.
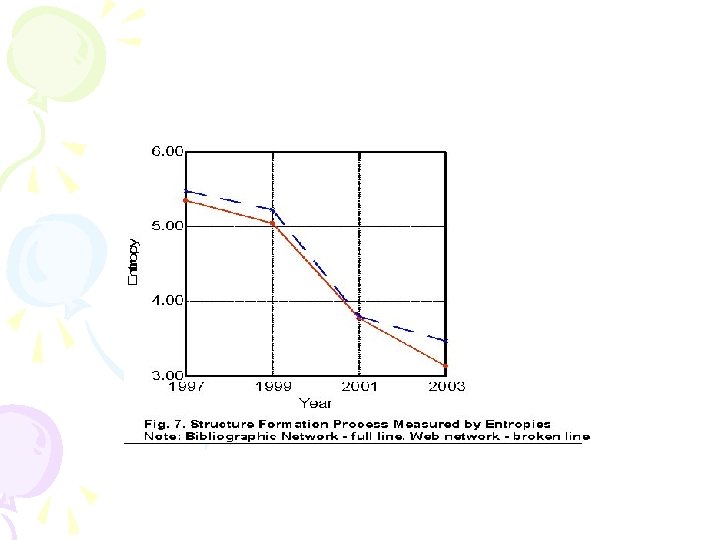
• Structure Formation Process Measured by Entropies • Whereas the size of the largest component grows, the number of components and the number of singletons diminish (cf. Table 2). This kind of structure formation processes in both the bibliographic and the Web networks can be measured by entropies H: • There is a series of numbers Kf(f=1, 2, …z), Kf ≠ 0 • z • h f =Kf / Σ Kf • f=1 • z • H = - Σ hf · lg 2 hf • f=1 • Kf is the size of a component f. The number of components in the network is called z.
• The structure formation process is characterized by the growth of the number of edges (pairs of collaborators), the decreasing number of clusters, the growth of the large cluster and the decreasing number of singletons (Table 2). • The entropy H is decreasing with increasing size of the components and with decreasing number of components. • The maximum entropy H is reached in a network under the condition there are singletons only. The minimum entropy is reached under the condition where there is one large cluster only and there are not any other components. • The structure formation processes in the bibliographic network is shown in the figure above.
Some Details of the Development of COLLNET Networks First step of the development of COLLNET (1998 -1999): An important trigger to the creation of COLLNET was the first Berlin Workshop on Scientometrics and Informetrics/Collaboration in Science, Berlin, August 1998. This workshop was organized by the Association of Science Studies (Gesellschaft fuer Wissenschaftsforschung e. V. , Berlin), and supported by the Free University Berlin, and DFG.
Second step (2000 -2001): Two years later in September 2000, in conjunction with the Second Berlin Workshop on Scientometrics and Informetrics/Collaboration in Science and in Technology, the first COLLNET meeting was held at the Free University Berlin. From this time on, COLLNET meetings have been regularly held regularly: the Second COLLNET Meeting at the National Institute of Science, Technology and Development Studies (NISTADS) in February 2001 in New Delhi (India). Again, COLLNET used the synergy of conjoint activity with the “International Workshop on Emerging Trends in Science and in Technology Indicators: Aspects of Collaboration”. A third COLLNET Meeting took place in July 2001 in Sydney (Australia) in conjunction with the 8 th International Conference on Scientometrics and Informetrics.
Third step (2002 -2003): Future strategies were discussed at the 4 th COLLNET Meeting which took place on Agust 29 th, 2003, in Beijing in conjucntion with the 9 th ISSI Conference (ISSI - International Society for Scientometrics and Informetrics). At this time, further measures of the effectiveness of collaborative engagements among members and productivity in the field of ‘collaboration in science and in technology’ were discussed. Thus, these 3 steps, along with the additional inclusion of the preliminary stage, will be incorporated to show the development of the bibliographic COLLNET co-authorship network in 4 stages:
Four stages derived from the 3 steps: • Until 1997: Collaboration of the future COLLNET members before 1998 (preliminary stage) • Until 1999: Collaboration until 1999 (cumulative, including collaboration until 1997, i. e. preliminary stage and first step of COLLNET development) • Until 2001: Collaboration until 2001 (cumulative, including collaboration until 1997, i. e. preliminary stage, first and second steps of COLLNET development) • Until 2003: Collaboration until 2003 (cumulative, including collaboration until 1997, i. e. preliminary stage, first, second and third steps of COLLNET development)
References Balaban, A. T. & Klein, D. J. (2002). Co-authorship, rational Erdös numbers, and resistance distances in graphs, Scientometrics, 55, 59 -70 Basu, A. & R. Aggarwal (2001). International collaboration in science in India and its impact on international performance, Scientometrics, 52, 379 -394 Batagelj, V. , Ferligoj, A. , and Doreian, P. (1992). Direct and indirect methods for structural equivalence, Social Networks, 14, 63 -90 Beaver, D. de. B. & Rosen, R. (1978). Studies in Scientific Collaboration. Part III. Professionalization and the Natural History of Modern Scientific Co. Authorship. Scientometrics, 3, 231 -245 Borgman, C. L. , & Furner, J. (2002). Scholarly communication and bibliometrics. In B. Cronin (Ed. ), Annual review of information science and technology: Vol. 36 (pp. 3 -72). Medford, NJ: Information Today. Braun, T. , Glänzel, W. & Schubert, A. (2001). Publication and cooperation patterns of the authors of neuroscience journals. Scientometrics, 51, 499510
Davis, M. & C. S. Wilson (2002), Elite researchers in ophthalmology: Aspects of publishing strategies, collaboration and multi-disciplinarity. Scientometrics, 52, 395 -410 Glänzel, W. (2002). Coauthorship patterns and trends in the sciences (19801998): A bibliometric study with implications for database indexing and search strategies. Library Trends, 50, 461 -473 Genest, C. & Thibault, C. (2001). Investigating the concentration within a research community using joint publications and co-authorship via intermediaries. Scientometrics, 51, 429 -440 Havemann, F. (2001): Collaboration behaviour of Berlin life science researchers in the last two decades of the twentieth century as reflected in the Science Citation Index, Scientometrics, 52, 435 -444 Herring, S. C. (2002). Computer-Mediated Communication on the Internet. In: Cronin, B. (ed. ), Annual Review of Information Science and Technology 36, Medford, NJ: Information Today Inc. , pp. 109 -168. Ingwersen, P. (1998). The calculation of Web Impact Factors. Journal of Documentation, 54(2), 236 -243.
Kling, R. & Mc. Kim, G. (2000). Not Just a Matter of Time: Field Differences in the Shaping of Electronic Media in Supporting Scientific Communication. Journal of the American Society for Information Science, 51(14), 1306 -1320. Kretschmer, H. , L. Liang & R. Kundra (2001); Foundation of a global interdisciplinary research network (COLLNET) with Berlin as the virtual center, Scientometrics, 52, 531 -538 Kretschmer, H. & M. Thelwall (2004): From Librametry to Webometrics. Journal of Information Management and Scientometrics. Vol. 1, No. 1, (2004), 1 -7 Kretschmer. H. (2004). Author productivity and Erdös distances in coauthorship and in Web networks. Scientometrics. Vol. 60, No. 3, 409 -420
Kundra, R. & D. Tomov (2001), Collaboration patterns in Indian and Bulgarian epidemiology of neoplasms in Medline for 1966 -1999 Newman, M. (2001). The structure of scientific collaboration networks. Proc. Natl. Sci. USA, 98, 404 -409 Otte, E. & Rousseau, R. (2002). Social network analysis: a powerful strategy, also for the information sciences. Journal of Information Science, 28, 443455 Price, D. J. de Solla. (1963). Little Science, Big Science. New York: Columbia University Press. (dt. 1974. Little Science, Big Science. Von der Studierstube zur Großforschung. Frankfurt am Main: Suhrkamp Verlag Schubert, A. (2002)The Web of Scientometrics. A statistical overview of the first 50 volumes of the journal. Scientometrics, 53, 3 -20 Terveen, L. G and Hill, W. C. Evaluating Emergent Collaboration on the Web, in Proceedings of CSCW 1998 (Seattle WA, November 1998), ACM Press, 355 -362.
Thelwall, M. (2003). What is the link doing here? Beginning a fine-grained process of identifying reasons for academic hyperlink creation. Information Research, 8, Vaughan, L. and Shaw, D. (2003) Bibliographic and Web Citations: What Is the Difference? Journal of the American Society for Information Science and Technology, 54(14), 1313 -1322. Wagner-Dobler, R. (2001), Continuity and discontinuity of collaboration behaviour since 1800 - from a bibliometric point of view, Scientometrics, 52, 503 -518 Wasserman, S. & Faust, K. (1994). Social network analysis. Methods and applications. Cambridge: Cambridge University Press 1994 Wilkinson, D. , Harries, G. , Thelwall, M. & Price, L. (2003). Motivation for academic web site interlinking: evidence for the web as a novel source of information on informal scholarly communication. Journal of Information Science, 29, 59 -66
Thank You!