MATLAB Help 1 v Help Help topicname MATLAB

MATLAB의 Help 사용하기 1 v Help 사용법 >> Help topic_name

MATLAB의 Help 사용하기 2
 ans = 3 >> a(1, 1: 3)")
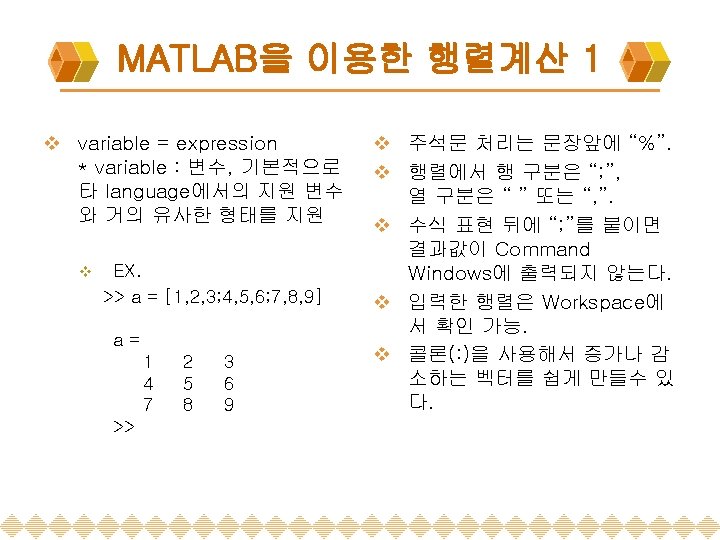
MATLAB을 이용한 행렬계산 2 >> a(1, 3) ans = 3 >> a(1, 1: 3) ans = 1 2 4 >> a(1, 3)=4 a= 1 2 4 4 5 6 7 8 9 >> a(1, : ) ans = 1 2 4 >> a(: , : ) ans = 1 2 4 5 7 8 4 6 9 >> a(1: 2, 3) ans = 4 6 >> i = 0: 0. 1: 0. 5 i= 0 0. 1000 0. 2000 0. 4000 0. 5000 0. 3000
![MATLAB을 이용한 행렬계산 4 >> A = [ 1 2 ; 3 4 ]](http://slidetodoc.com/presentation_image_h/dcb3c78dd06a03b41e60f5bb3533e30e/image-12.jpg "MATLAB을 이용한 행렬계산 4 >> A = [ 1 2 ; 3 4 ]")
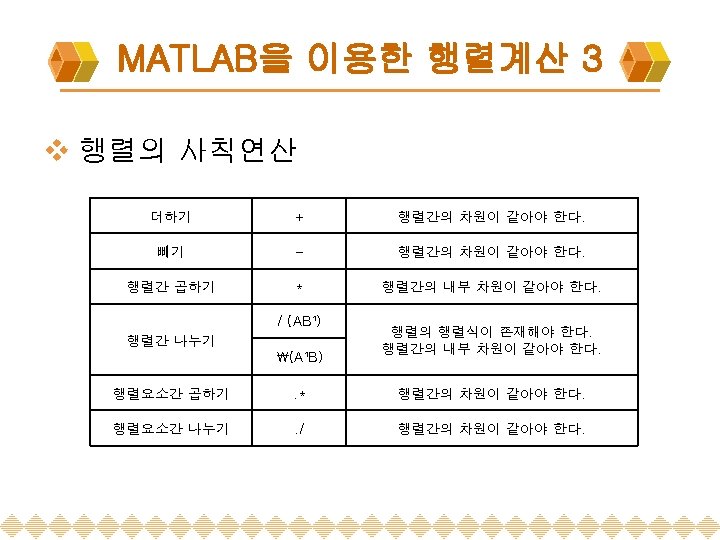
MATLAB을 이용한 행렬계산 4 >> A = [ 1 2 ; 3 4 ] A= 1 3 2 4 >> B = [ 3 4 ; 5 6 ] B= 3 5 4 6 >> A+B ans = 4 8 6 10 8 24 >> A/B ans = 2 1 -1 0 -1. 0000 -2. 0000 3. 0000 >> inv(A)*B ans = -2 -2 >> A*B ans = 13 29 3 15 >> AB ans = >> A-B ans = -2 -2 >> A. *B ans = -1. 0000 -2. 0000 3. 0000 >> B/A ans = 16 36 0 -1 1 2
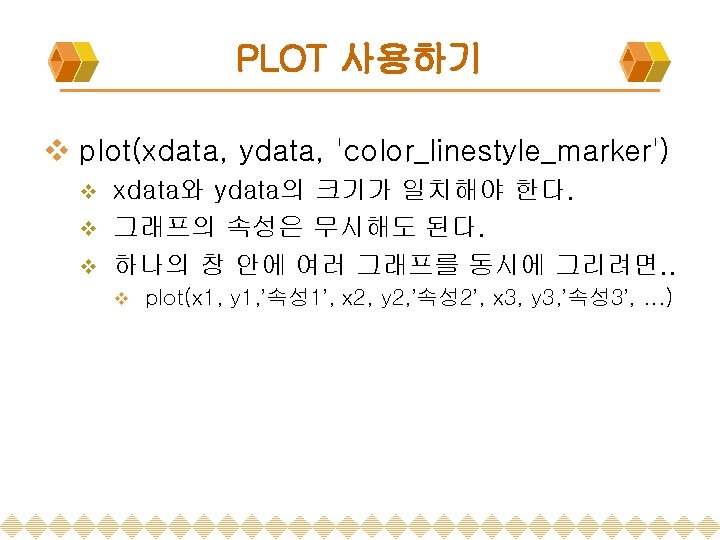
 or subplot(M, N, I) v M(행의 갯수), N(열의")
Multi graphic 객체 사용하기 v subplot(MNI) or subplot(M, N, I) v M(행의 갯수), N(열의 갯수), I(하부영역의 순서) >> subplot(221) >> subplot(222) >> subplot(212) subplot(221) subplot(222) subplot(212)

그래프의 속성 가능한 선의 Color 가능한 선의 marker Matlab Symbol Color Matlab Symbol Marker Style c 하늘 g 초록 + + ^ △ m 자주 b 파랑 o o v ▽ y 노랑 w 흰색 * * > ▷ r 빨강 k 검은색 . ● < ◁ x × pentagra m ☆ 가능한 선의 Style Matlab Symbol Style Square □ hexagram ¤ - Solid line : Dotted line Diamond ◇ none No marker (default) -- Dashed line -. Dash-dot line none No Line

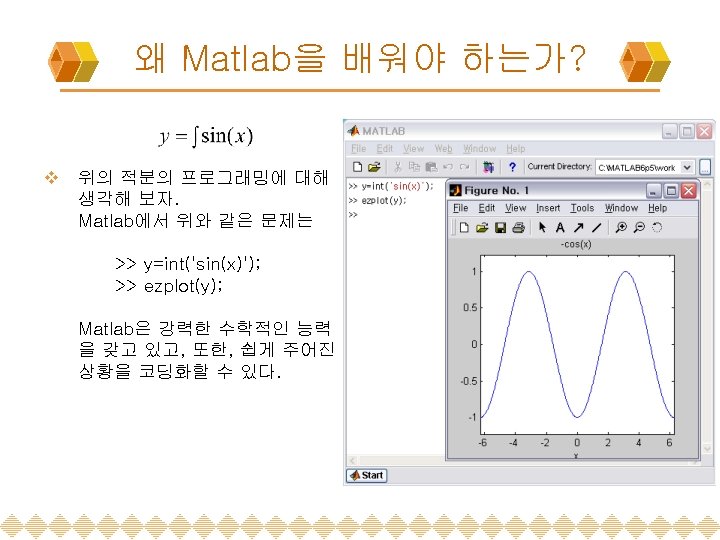
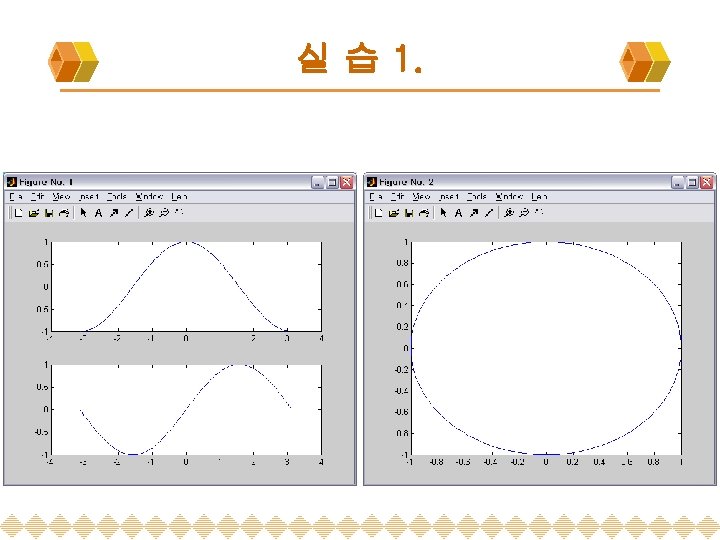
실 습 1. v -pi < x < pi 일 때(단 x의 스텝은 0. 05), v figure(1)의 subplot(211)에 X축에 x, Y축에 a=cos(x)를 plot 하라. v figure(1)의 subplot(212)에 X축에 x, Y축에 b=sin(x)를 plot 하라. v figure(2)의 X축에 a, Y축에 b를 plot하라
; b=sin(x); figure(1); subplot(211); plot(x, a);")
% 실습 1. x= -pi: 0. 05: pi; a=cos(x); b=sin(x); figure(1); subplot(211); plot(x, a); subplot(212); plot(x, b); figure(2) plot(a, b);
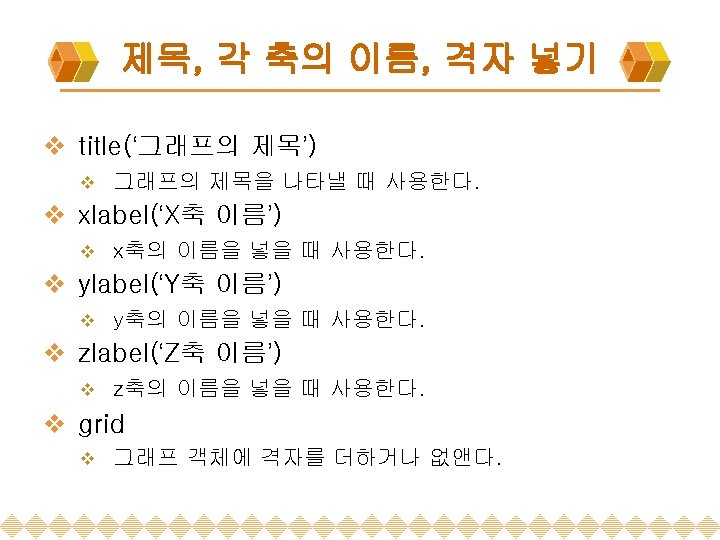
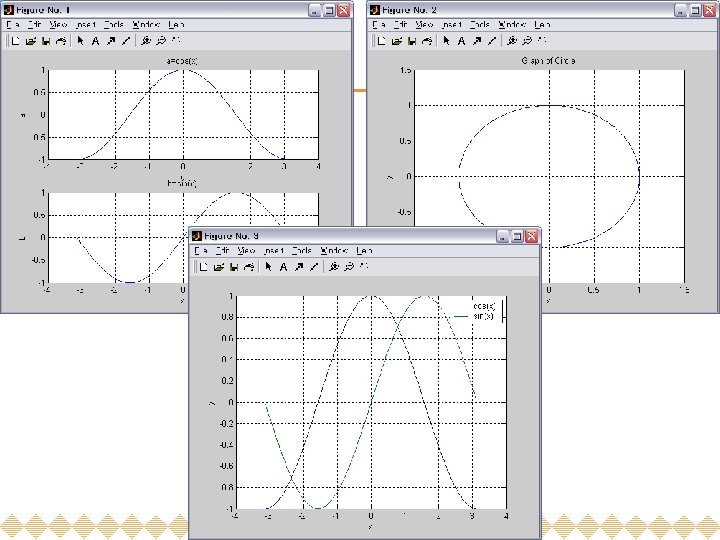
 subplot(211) xlabel('x'); ylabel('a'); title('a=cos(x)'); grid on; subplot(212) xlabel('x'); ylabel('b'); title('b=sin(x)');")
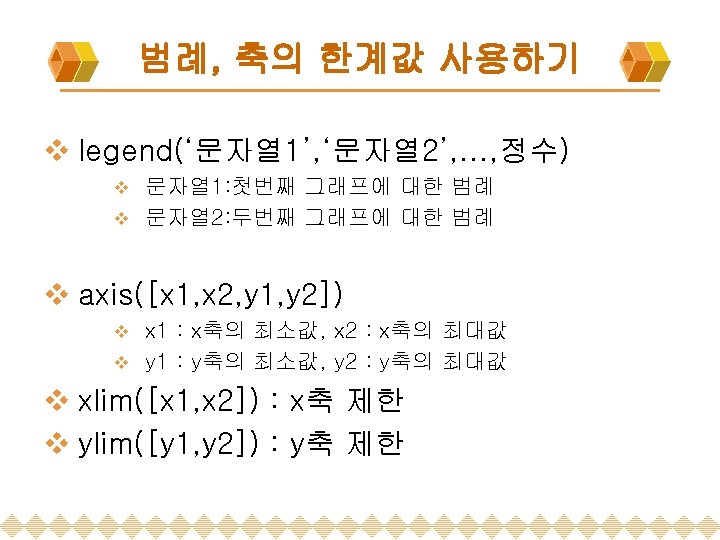
% 실습 2. figure(1) subplot(211) xlabel('x'); ylabel('a'); title('a=cos(x)'); grid on; subplot(212) xlabel('x'); ylabel('b'); title('b=sin(x)'); grid on; figure(2) xlabel('x'); ylabel('y'); axis([-2, 2, -2, 2]); title('Graph of Circle'); grid on; figure(3) plot(x, a, x, b); legend('cos(x)', 'sin(x)'); xlabel('x'); ylabel('y'); grid on;

SIMULINK

Simulink 시작하기
")
Simulink 실행하기 Simulation → Simulation Parameters. . . ▶ ( 실행 )

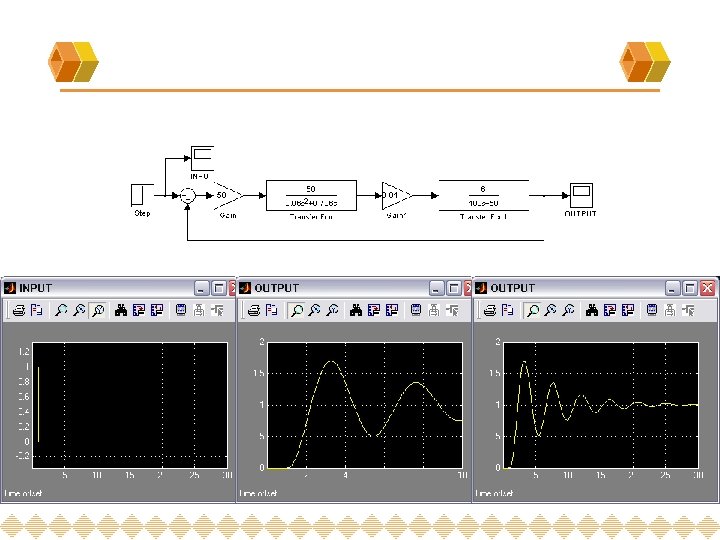
실습 3 v 자동제어 교재 연습문제 6 -14 Ka=50, Kl=50, Kb=0. 0706, Ki=10, Ko=50 v Ra=10, J=0. 006, n=0. 01 v A = 100, N=1. 5 v
- Slides: 40