LINEAR REGRESSION CSC 576 Data Science Today Statistical


")


")


 – Mean Squared Error: measuring the “quality of")


 Prediction for Y based on the ith value of")
: Least Squares: chooses and to minimize the")
 � Using some Calculus, can show:")


: � Predictor: x")
![Advertising Dataset Scatter plot visualization for TV and Sales with Linear Model. plt. scatter(advertising['TV'],](https://slidetodoc.com/presentation_image/c64bedbf9d44b0b332a8ddcb10312004/image-34.jpg "Advertising Dataset Scatter plot visualization for TV and Sales with Linear Model. plt. scatter(advertising['TV'],")


- Slides: 43
LINEAR REGRESSION CSC 576: Data Science
Today Statistical Learning Preliminaries Statistical Estimation and Prediction Measuring Standard Error, Confidence Intervals Simple Linear Regression Evaluating LM using Testing Set
Statistical Learning (from a Math/Stat view)
Statistical Learning – General Form In general, assuming we have: 1. 2. 3. Observation of quantitative (numerical) response Y Observation of p different predictors {X 1, X 2, …, X p} A relationship between Y and X = {X 1, X 2, …, Xp} We can capture this relationship in the very general form:
Statistical Learning – General Form f is unknown function of X = {X 1, X 2, …, Xp} f may involve more than one input variable ε is a random error term Independent of X Has mean equal to zero f represents information that X provides about Y Statistical learning refers to a set of approaches for estimating f
Why estimate f? Two usual objectives: 1. 2. Prediction Inference / Descriptive
Estimating f - Inference Rather than predicting Y based on observations of X, Goal is to understand the way that Y is affected as X = {X 1, X 2, …, Xp} changes Understand the relationship between X and Y not treated as “black box” anymore, we need to know its exact form
Estimating f - Inference May be interested in answering the following questions: 1. “Which predictors are associated with the response? ” Often the case that only small fraction of the available predictors are associated with Y Identifying the few, important predictors
Estimating f - Inference 2. “What is the relationship between the response and each predictor? ” Some predictors may have a positive relationship with Y (or vice versa, a negative relationship) Increasing the predictor is associated with increasing values of Y
Estimating f - Inference
How do we estimate f? Most statistical learning methods classified as: 1. 2. Parametric Non-parametric
Parametric Methods Assume that the functional form, or shape, of f in linear in X This is a linear model, for p predictors X = {X 1, X 2, …, Xp} Model fitting involves estimating the parameters β 0, β 1, …, βp Only need to estimate p+1 coefficients, � Rather than an entirely arbitrary p-dimensional function f(X) Parametric: reduces the problem of estimating f down to estimating a set of parameters
Non-parametric Methods Do not make explicit assumptions about the functional form of f (such that it is linear)
Parametric Methods Assumption of linear model Possible that functional estimate is very different from the true f Non-parametric Methods � If so, won’t fit data well Only need to estimate set of parameters Potential to accurately fit a wider range of possible shapes for f Many, many more observations needed Complex models
Trade-Off Between Model Flexibility and Model Interpretability Some statistical models (e. g. linear models) are less flexible and more restrictive. Q: Why would be ever choose to use a more restrictive method instead of a very flexible approach? A: When inference is the goal, the restrictive models are much more interpretable. � In linear model, it is easy to understand relationship between Y and X 1, X 2, … For prediction, we might only be interested in accuracy and not the interpretability of the model
High Linear Models Decision Trees Support Vector Machines Low Model Interpretability Trade-Off Between Model Flexibility and Model Interpretability Low High Model Flexibility
Trade-Off Between Model Flexibility and Model Interpretability A concluding thought: Even for prediction, where we might only care about accuracy, more accurate predictions are sometimes made from the less flexible methods � Reason: overfitting in more complex models
Model Evaluation on Test Set (Regression) – Mean Squared Error: measuring the “quality of fit” � will be small if the predicted responses are very close to the true responses Observations in test set: {(x 1, y 1), …, (xn, yn)} Other types of errors measures as we
Advertising Dataset Toy Dataset: Advertising � Advertising. csv Sales totals for a product in 200 different markets � Advertising budget in each market, broken down into TV, radio, newspaper
https: //www. kaggle. com/sazid 28/advertising. csv Advertising Dataset import pandas as pd advertising = pd. read_csv('. . /datasets/Advertising. csv') advertising. head(5) 0 1 2 3 4 TV 230. 1 44. 5 17. 2 151. 5 180. 8 Radio 37. 8 39. 3 45. 9 41. 3 10. 8 Newspaper 69. 2 45. 1 69. 3 58. 5 58. 4 Sales 22. 1 10. 4 9. 3 18. 5 12. 9
Advertising Dataset Goal: What marketing plan for next year will result in high product sales? Questions: Is there a relationship between advertising budget and sales? How strong is the relationship between advertising budget and sales? 1. 2. Strong relationship: given the advertising budget, we can predict sales with a high level of accuracy Weak relationship: given the advertising budget, our prediction of sales is only slightly better than a random guess
Advertising Dataset Goal: What marketing plan for next year will result in high product sales? Questions: Which media contribute to sales? 3. Need to separate the effects of each medium How accurately can we estimate the effect of each medium on sales? 4. For every dollar spent on advertising in a particular medium, by what amount will sales increase? How accurately can we predict this increase?
Advertising Dataset Goal: What marketing plan for next year will result in high product sales? Questions: Is the relationship linear? 5. If the relationship between advertising budget and sales is a straight-line, then linear regression seems appropriate. If not, all is not lost yet. (Variable Transformation) Is there any interaction effect? (called “synergy” in business) 6. Example: spending 50 k on TV ads + 50 k on radio ads results in more sales than spending 100 k on only TV
Simple Linear Regression Predicting quantitative response Y based on a single predictor variable X Assumes linear relationship between X and Y “we are regressing Y onto X”
Simple Linear Regression Two unknown constants � Also called “model coefficients” or “parameters” β 0 = intercept β 1 = slope Use training data to produce estimates for the model coefficients:
Estimating the Coefficients Goal is to obtain coefficient estimates such that the linear model fits the available data well � To find an intercept and slope such that the resulting line is as close as possible to the data points � Q: How to determine “closeness”? � A: Common approach: least squares
Residual Sum of Squares (RSS) Prediction for Y based on the ith value of X i residual: difference between the ith observed response value and the ith predicted value th Residual Sum of Squares (RSS):
Least Squares Residual Sum of Squares (RSS): Least Squares: chooses and to minimize the RSS
Least Squares (Yikes, math!) � Using some Calculus, can show:
Advertising Dataset What are some ways we can regress sales onto adverting using Simple Linear Regression? One model:
Advertising Dataset Scatter plot visualization for TV and Sales. %matplotlib inline advertising. plot. scatter(x='TV', y='Sales');
Advertising Dataset Simple Linear Model in Python (using pandas and scikit-learn): � Predictor: x � Response: y reg = linear_model. Linear. Regression() reg. fit(advertising['TV']. reshape(-1, 1), advertising['Sales']. reshape(-1, 1)) print('Coefficients: n', reg. coef_) print('Intercept: n', reg. intercept_) Coefficients: [[ 0. 04753664]] Intercept: [ 7. 03259355] Sales = 7. 03259 + 0. 04754 * TV
Advertising Dataset Scatter plot visualization for TV and Sales with Linear Model. plt. scatter(advertising['TV'], advertising['Sales'], color='black') plt. plot(advertising['TV'], reg. predict(advertising['TV']. reshape(-1, 1)), color='blue', linewidth=3)
Simple Linear Model
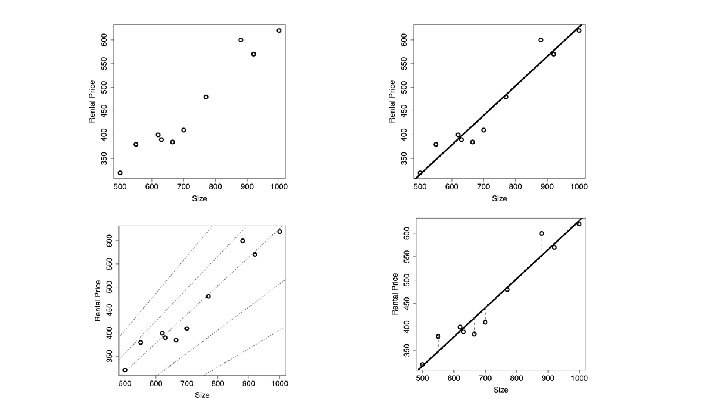
Measuring the Quality of a Regression Model Residual Standard Error • (RSS “Residual Sum of Squares” sometimes called SSE “Sum of Squared Errors • (RSE “Residual Standard Error” sometimes called “Standard Error of the Estimat
Example Advertising Dataset RSE = 3. 2586563 ≈ 3. 25 � “Typical error in predicting sales will be about 3. 25 points. ” � “Estimate of the sales prediction will be within 3. 25 points about two-thirds of the time. ”
Evaluating the LM using a Test Set Given a set of predictions for m new cases, we can evaluate the model’s predictions by: 1. 2. 3. Mean Error (ME) Room Mean Square Error (RMSE) Mean Absolute Percent Error (MAPE)
Mean Error Mean error should be close to zero Mean errors different from zero indicate a bias in the model
Root Mean Square Error Root mean square error expresses the magnitude of the model’s error in the units of the response variable
Mean Absolute Percent Error Mean absolute percent error expresses the model error in percentage terms It should not be used for a response that is close to zero � Unstable when dividing by a small number
References Fundamentals of Machine Learning for Predictive Data Analytics, 1 st Edition, Kelleher et al. Data Science from Scratch, 1 st Edition, Grus Data Mining and Business Analytics in R, 1 st edition, Ledolter An Introduction to Statistical Learning, 1 st edition, James et al. Discovering Knowledge in Data, 2 nd edition, Larose et al. Introduction to Data Mining, 1 st edition, Tam et al.