Inference of Transcriptional Regulation Network with Gene Expression


 By Filkov et al. Focus on improving local similarity detection")
 Group those edges with similar direction Now left with edges")
 Scoring Formula n n n d = agreement of slopes")
 Does not differentiate between the direction of regulation Cannot be")
")
 Must learn the network using observed data Perform a series of")
 Need large sample size for accuracy Representing Time n n Increases")


 Scoring Method for Event Method R C F R S(d. T)")
 R-R matches weighted more than F-F matches n Decreases in m.")


 α and CDC 28 data sets analyzed Data")
 Correlation and edge detection methods: no directionality of")
 Overlapping results among 3 methods (all results) Methods Event + Correlation")
 Overlapping results among 3 methods (true positive results only) Methods Event")
 < 1/3 of results by any 2 methods overlap n Event")
 distribution for top-k results Alpha data set 0 < k < 10,")
 Perform time-shifting experiments and see how score changes Gene")
 Correlation coefficients drop rapidly as time delay is introduced")
 for Event Method α -β Alpha Act.")


 Spellman’s data sets not enough to test the algorithms properly")
 Each data set consists of equal number of gene profiles")
 Avg. No. of True (+) Data Set Correlation Event Constant")

 Limitation of real-world data n n n Obtain data with better")
 Transitive Closure: 1 3 2 n If E 12 and E")
 Improvement of event method n Different number of event types Global")
- Slides: 49
Inference of Transcriptional Regulation Network with Gene Expression Data Andrew Kwon
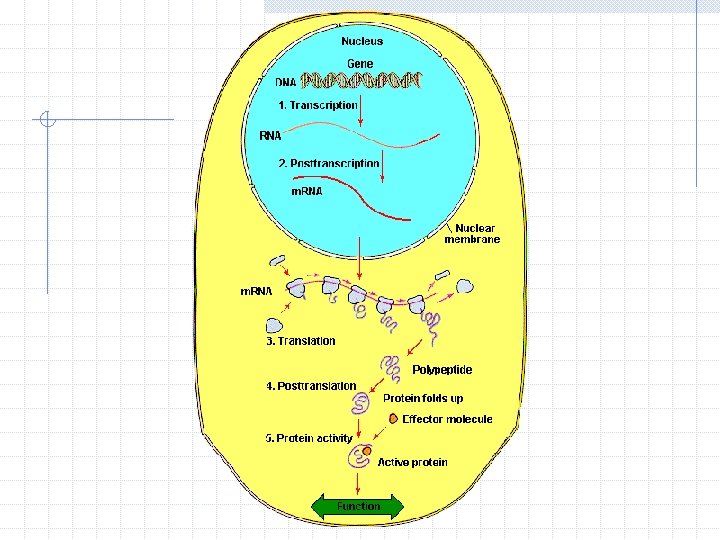
Role of Proteins Both functional and structural Main agents of cellular functions Each protein has a specific function The amount of each protein in the cell must be controlled carefully Elaborate Regulatory Network
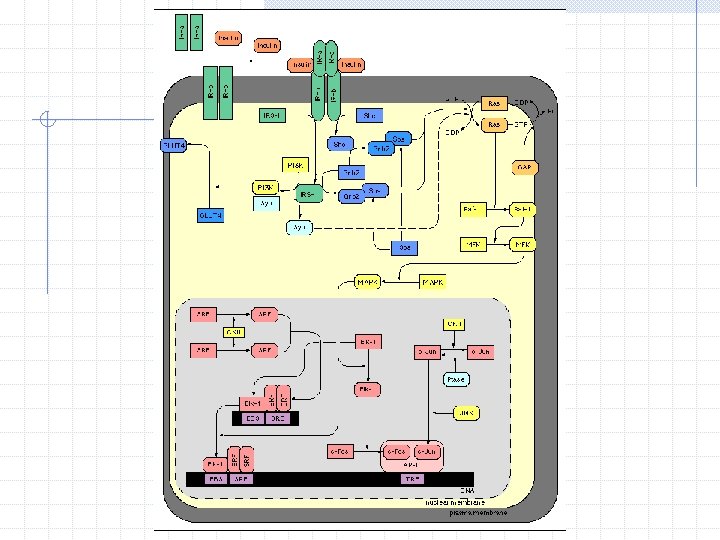
Gene Regulatory Network Fundamental mechanism by which protein production and cellular functions are controlled Complex input-output system made of proteins and genes for controlling cellular functions Important for understanding of many important problems, including medical ones
Cell Cycle After certain amount of growth, cell divides into two identical cells Need to duplicate cellular components and equally divide among progenitors Different regulators act in different parts and stages in concert to control cell cycle
Types of Regulation Activation n Increase in protein A leads to increase in gene B’s transcription Inhibition n Increase in protein A leads to decrease in gene B’s transcription Not a simple binary relationship Many genes could act on a particular gene at once - Complexes Feedback and Self-Regulation
Example of Regulatory Network S phase control in yeast
Microarray Each spot contains a specific probe designed for a single c. DNA When more c. DNA binds to a spot, the red intensity increases Allow study of gene expression in large scale
Which Genes Are Related? Goal: to find out which pairs of genes have direct regulatory relationship
Correlation Method Standard correlation coefficient Widely used method for sequence similarity comparisons Tests for degree of linear relationship between two variables Cannot take into account the time delay involved in gene regulation Strongly favours global over local similarities
Edge Detection Method (1) By Filkov et al. Focus on improving local similarity detection Scan through gene expression curves and determine where major edges occur, and remove spurious edges Construct primary edges using local minima and maxima Filter out those edges whose height does not make the pre-determined threshold
Edge Detection Method (2) Group those edges with similar direction Now left with edges depicting the major features only compare the edge profiles between two genes by summing up closely located edges from two genes with the same direction
Edge Detection Method (3) Scoring Formula n n n d = agreement of slopes of edges (-1 or 1) n = number of edges a, b = two genes being compared = gap between edges max = maximum allowable time difference between two edges
Edge Detection Method (4) Does not differentiate between the direction of regulation Cannot be used to find inhibitory relationships Allows for negative time delays between two corresponding edges on the basis that there is not enough data resolution Detects strong local matches only
Bayesian Networks Consists of two parts n n Directed Acyclic Graph (Structure of GRN) Set of parameters for the DAG (Statistical Hypothesis) DAG represents the causal relations among a set of random variables (gene expression levels) X causes Y if and only if there is a direct edge from X to Y
Bayesian Networks (2) Must learn the network using observed data Perform a series of conditional independence tests and construct the most likely set of DAGs based on the results Assign a score to each DAG based on the sample data, and search for the highest scoring one
Bayesian Networks (3) Need large sample size for accuracy Representing Time n n Increases the number of variables dramatically, if one is to represent the time in the bayesian network Dynamic Bayesian Network High complexity
Event Method Need a method that balances between global and local similarity Need to make use of temporal evidence Need to account for directionality of regulation Need to be computationally efficient
Hypotheses on Regulation Hypothesis 1: A activates B n n Rise in expression of A followed by rise in expression of B Fall in expression of A followed by fall in expression B Hypothesis 2: A inhibits B n n Rise in A followed by fall in B Fall in A followed by rise in A Time delay between 2 corresponding events
Events Directional changes in expression profile State of gene expression at an instant 3 possible states n Rise, Constant, Fall (R, C, F) Event state/type determined by the slope of the expression profile
Event Conversion Microarray data is quite noisy Perform smoothing to reduce noise before calculating slopes Select the ‘flat’ region around slope of 0 Classify into R, C, F based on the slope values n Any value falling in the flat region → C Result: 2 event strings
Event String Alignment Need to best match 2 event strings with noise and time delay in mind Use Needleman-Wunsch’s global sequence alignment algorithm Handling of time delay n n Events that do not occur at the same time may still be related to each other No negative time delay
Scoring Matrix (1) Scoring Method for Event Method R C F R S(d. T) 0 -βS(d. T) C 0 0 0 F -βS(d. T) 0 αS(d. T) 0 < S(d. T) ≤ 1 0 ≤ α ≤ 1, 0 ≤ β ≤ 1 d. T = time delay between two events If d. T < 0, match penalty = ∞
Scoring Matrix (2) R-R matches weighted more than F-F matches n Decreases in m. RNA levels less indicative Any match with C assigned neutral score of 0 n n C = region of uncertainty Could be due to any number of reasons Penalty for R-F matches Scores function of time delay d. T
Example
Event vs. Correlation Event scores high, but correlation scores low n Time delay lowers the correlation coefficient
Event vs. Edge Detection Event scores high, edge detection scores low Bolded edges: what edge detection finds n Only edges A and B are close enough to be added to score
Spellman’s Data Sets Snapshots of yeast cellular m. RNA levels at regular time intervals using c. DNA microarrays 4 separate data sets based on different cell arresting methods used n α-arrest, elutriation, CDC 15, CDC 28 temp. sensitive mutants Yeast genome: ~6200 genes n Too many; need to reduce search space
Selecting Genes to Study Want to restrict to genes related to cellcycle regulation Filkov et al searched for known transcriptional regulation pairs in Yeast Proteome Database 888 transcriptional regulations n n 486 genes 647 activations, 241 inhibitions
Pre-Processing Data Microarray data by Spellman contains many missing points n Experimental errors Use linear interpolation to fill in for the missing points If the ratio of the missing points to valid points is greater than the threshold, ignore the gene data in question
Analysis of the Test Set (1) α and CDC 28 data sets analyzed Data Set α CDC 28 # ORFs 4489 6103 # Genes 348 458 Need to compare each gene with all the others n n >120, 000 comparisons for alpha >200, 000 comparisons for CDC 28
Analysis of the Test Set (2) Correlation and edge detection methods: no directionality of regulation n Only ½ as many comparisons as the event method To make comparison possible, remove directionality aspect from the event method as well
Analysis Results (1) Overlapping results among 3 methods (all results) Methods Event + Correlation Event + Edge Correlation + Edge Alpha 3367 2081 1989 CDC 28 2916 3362 2252 • α=0. 7, -β =0. 3 used for scoring matrix • Top-10, 000 rankings
Analysis Results (2) Overlapping results among 3 methods (true positive results only) Methods Event + Correlation Event + Edge Correlation + Edge Alpha 11 0 0 CDC 28 9 0 0 • α=0. 7, -β =0. 3 used for scoring matrix • Top-10, 000 rankings
Analysis Results (3) < 1/3 of results by any 2 methods overlap n Event method finds significantly different pairs from the other methods Very little overlap between true positives Consistent with the fact the 3 methods employ different search strategies n Local vs. global similarity
True (+) distribution for top-k results Alpha data set 0 < k < 10, 000 CDC 28 data set
Effects of Time Delay (1) Perform time-shifting experiments and see how score changes Gene 1 YDR 225 W Gene 2 Correlation YDR 224 C 0. 94 YDR 224 C-1 0. 46 YDR 224 C-2 -0. 24 Edge 0. 30 0. 05 -0. 46 Event 13. 41 12. 92 11. 98 YMR 199 W YPL 256 C-1 YPL 256 C-2 0. 78 0. 39 -0. 06 8. 92 8. 64 9. 24 0. 82 0. 40 -0. 19
Effects of Time Delay (2) Correlation coefficients drop rapidly as time delay is introduced n Supports assertion that correlation cannot handle time delay gracefully Unexpected drop in edge detection scores n Probably due to problem in finding significant edges to compare
Effects of Scoring Matrix Parameters True (+) for Event Method α -β Alpha Act. Alpha Inh. CDC 28 Act. CDC 28 Inh. 0. 7 62 20 72 20 0. 7 0. 5 62 20 72 20 0. 7 0. 3 71 20 93 24 0. 5 0. 7 62 21 73 26 0. 5 62 21 73 25 0. 3 72 22 92 24 0. 3 0. 7 62 16 72 24 0. 3 0. 5 62 16 72 24 0. 3 71 20 87 21
Problems with Results Many genes shared identical expression curves, incl. unrelated genes n Poor resolution of data Edge detection method n n n Too many scores of 0 Simply cannot find enough edges Significance of scores doubtful
More Notes on Edge Cumulative Distribution Function for Edge Zero scores make up the vertical column
Synthetic Data Sets (1) Spellman’s data sets not enough to test the algorithms properly 4 different data sets n n Constant time delay Irregular time delay Partial matching Differential weighting of events
Synthetic Data Sets (2) Each data set consists of equal number of gene profiles and random profiles n n Gene profiles: genei Random profiles: randomi genei and genei+x related Better match if x is smaller
Synthetic Data Sets (3) Avg. No. of True (+) Data Set Correlation Event Constant Time Delay 31. 6 39. 8 Irregular Time Delay 27. 2 33. 8 Partial Matching 44. 6 40. 6 Differential Weighting 36. 2 45. 0 Event method superior except in partial matching Could not test edge detection method n Could not produce non-zero scores
Summary Event Method: find potential regulatory pairs from gene expression data n n Based on key features of gene expression Computationally efficient Perform comparably to correlation and edge detection methods in finding true (+) from Spellman’s data sets Outperform correlation in synthetic data sets
Future Work (1) Limitation of real-world data n n n Obtain data with better resolution Integrate data with other a priori knowledge Narrow down focus to transcription factors More realistic synthetic data n Realistic modeling of artificial regulatory network
Future Work (2) Transitive Closure: 1 3 2 n If E 12 and E 23 have higher scores than E 13, Node 3 would be only conditionally dependent on Node 1 It would make sense to remove E 13 from the pair rankings in order to accommodate other potential pairs
Future Work (3) Improvement of event method n Different number of event types Global regulatory network n Combine pairings by event method to form potential networks Other uses for event method n n Different types of data, such as proteins Adaptation to other fields may be possible