GIS and Water Quality Modeling for Watershed Management

 n GIS-Based HSPF Models (Detailed")
 Planning Level Model")


 Application of GIS-Based HSPF Model Hydrological Simulation Program - FORTRAN")


 For")


")
 BASINS BETTER ASSESSMENT SCIENCE INTEGRATING POINT AND NONPOINT SOURCES")


 sites and")


 n HSPF (Hydrologic Simulation Program. FORTRAN) u Variable time")


 Sub-Basins")


 NOAA Data u from Reagan")


")


- Slides: 79
GIS and Water Quality Modeling for Watershed Management by Mow-Soung Cheng Prince George’s County, Maryland Chao-Hsien Liaw National Taiwan Ocean University
Four Components n Watershed Protection System (Planning level model) n GIS-Based HSPF Models (Detailed Watershed Simulation) BASINS n Case Study using BASINS n
(1) Planning Level Model
Watershed Protection System Watershed simulation model for Planninglevel analysis n Watershed management methods n Watershed characteristics and Data overlays n Stormwater management practices module n Industrial and commercial facility module n Priority pollutant characteristics n
WATERSHED PROTECTION SYSTEM WATERSHED SIMULATION MODEL SIMULATION RUN WATERSHED BUSINESS WATERSHED MANAGEMENT CHARACTERISTICS AND METHODS INDUSTRY GOAL SETTING LAND USE SOIL WATERSHED NAME & ABBREV. PRIORITIZATION & RANKING RESULTS WINDOW FILE MANAGER SESSION MANAGER PRINT MANAGER SLOPE RIVER ROAD LANDUSE TARGETTING INDUSTRIAL FACILITY I. D. . FACILITY RETRIEVAL WELLS NPDES FACILITIES POTENTIAL BMP’S POLLUTANT SOURCE I. D. . USGS GAGES GNIS DATA WQ STATIONS POLLUTANT FACILITY STORMWATER CONTROL FACILITIES PRIORITY POLLUTANTS COUNTYWIDE CHEMICAL CHARACTERISTICS WATERSHED FATE & TRANSPORT INDUSTRIAL USES GEOGRAPHIC AND TABULAR FORMATS ANALYTICAL METHODS REGULATORY ISSUES TOXICOLOGICAL CHARACTERISTICS
Simulation Methodology n Run SWMM for small individual land use watershed n Adjust model parameters to monitoring data n Run SWMM 9 land uses for 12 pollutants n 8 years of continuous simulation using hourly time step
Land Use Types Simulated Low density residential: >1/2 ac/lot n Medium density residential: 1/2 - 1/8 ac/lot n High density residential: < 1/8 ac/lot n Commercial n Industrial n Open space n Forest n Agriculture n Bare land n
Constituents Simulated n Flows n n Biological Oxygen Demand Chemical oxygen demand n n n Total suspended solids Dissolved suspended solids n n n Total phosphorous Dissolved phosphorus Total nitrogen Ammonia & Organic nitrogen Copper Cadmium Zinc Lead
Flow / Pollutant Hourly Time Series Heavy Metal Residential Land Use
Pollutant Loadings Distribution To Prioritize Watersheds based on Pollutant Loadings
BOD 5 Select indicator 950 to 870 Select ranges Prioritize Watersheds
Structured Watershed Management Approach Level 1 County-wide 1. Goals and assessment 2. Spatial characterization 3. Prioritization and ranking Decision Point Level 2 Within Watershed j=1, m i=1, n 4. Source location and magnitude 5. Management alternatives analyses 6. Strategic solutions ranking Refine solutions Decision Point implement solutions Refine goals
(2) Application of GIS-Based HSPF Model Hydrological Simulation Program - FORTRAN
Detailed Watershed Management Model n Continuous simulation of hydrology and water quality in a watershed n Spatial and temporal variability of flow and pollutant loadings u location, duration and frequency of wet and dry conditions n simulation of alternative management scenarios n Prediction of future condition
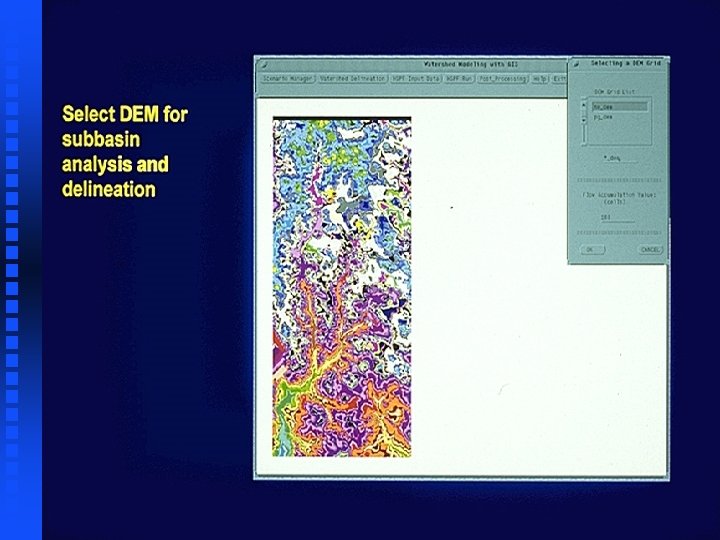
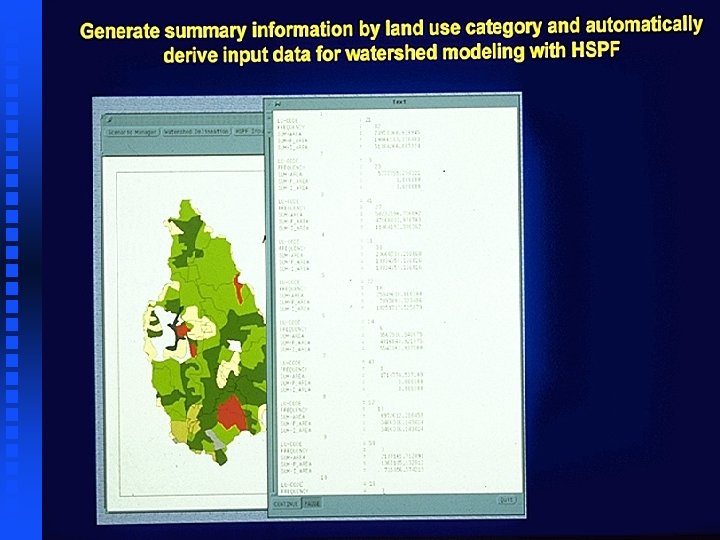
Automatically Delineate Sub. Watershed Boundary
Automatically Determine Land Use Distribution for each Sub-Watershed
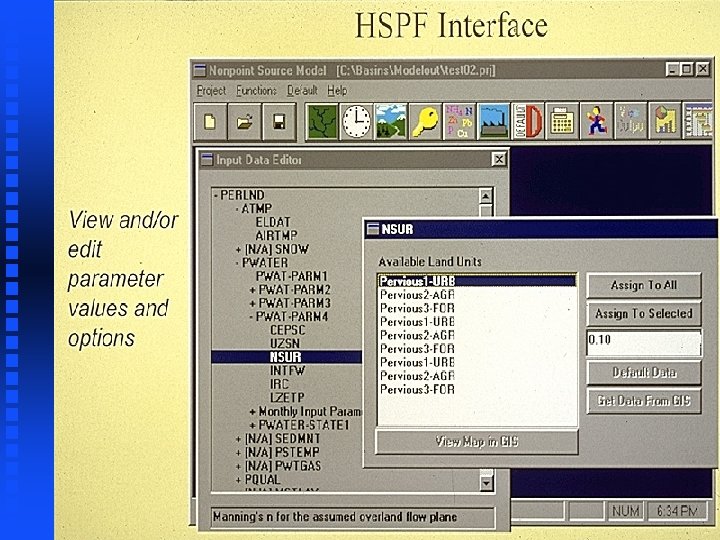
Automatically Assign Hydrologic & Water Quality Parameters (each Land Use in each Sub-Watershed) For Both Pervious and Impervious areas
Provide Point Sources Data, if Any
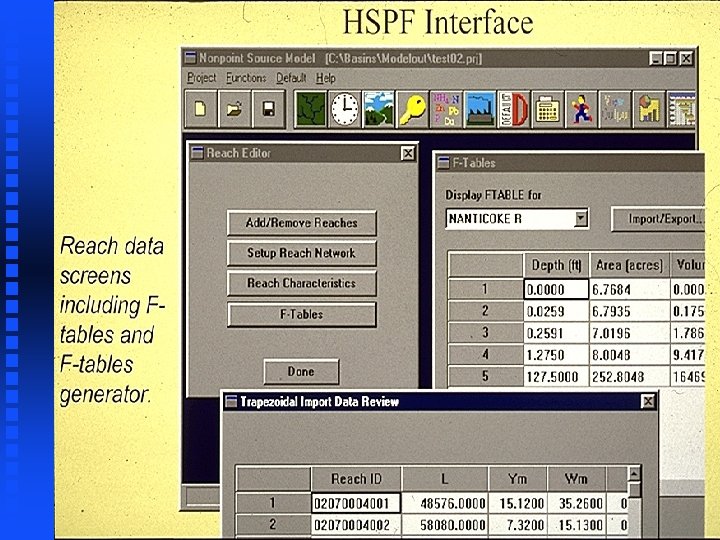
Automatically Generate REACH Data, Network and F-Tables
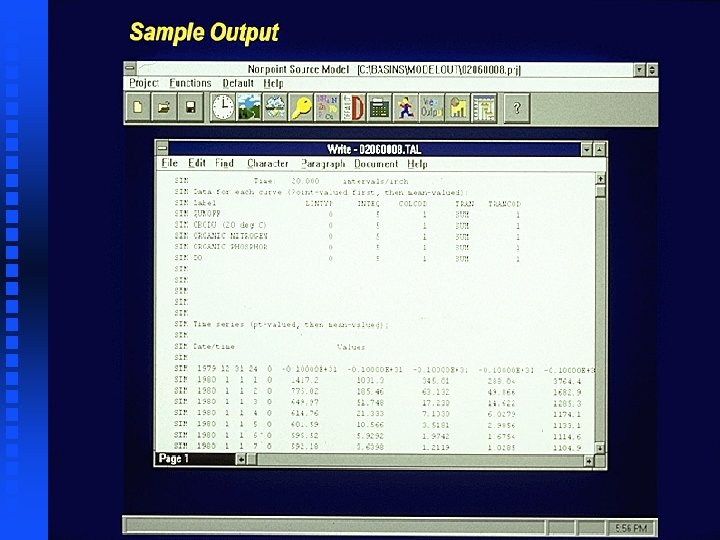
HSPF Outputs
Why Use GIS As a Modeling Platform Save time and cost n Offer a wide range of modeling options n Allow a wide range of analysis n * Various scale, complexity and application domain Replicable results … defensible analysis n Flexibility and iterations n * Evaluation of a wide range of alternatives Communicate to public and decision makers n Ease of Integration of complex models n
Cost and Time Savings with GIS (Conduct 3 Watershed Studies)
(3) BASINS BETTER ASSESSMENT SCIENCE INTEGRATING POINT AND NONPOINT SOURCES
What Is BASINS? Better Assessment Science Integrating Point and Nonpoint Sources Integrated GIS, data analysis and modeling system designed to support watershed-based analysis and TMDL development u Data: national data sets with options to import local data u Tools: provide quick access to analysis techniques for watershed assessment u Models: provide more detailed analysis and predictive evaluations to support studies
BASINS Facts and Requirements for Use n U. S. EPA Product - Office of Science and Technology (OST) Available for every state in the continental U. S. n Hardware and Software Requirements: n u Arc. View GIS Version 3. 0 a or 3. 1 u Windows 95, 98, or NT u 133 -MHz Pentium processor (at minimum) u 250 mb hard disk space (at minimum) u 32 mb of RAM u CD-ROM and color monitor
BASINS Applicability n Multi-purpose support system u Watershed management and basin planning u TMDL program u Source water protection u Pollutant trading n Multiple users u National assessment u Regional assessment u States u Local governments u Private
Spatial Dataa BASINS Overview Assessment Toolsa Land Use/ Land Cover TMDL Watersheds Source water protection ·TARGET Surface Waters ·ASSESS Roads Boundaries Monitoring Dataa ·Data Mining ·Ws Delineation ·Reporting ·Import local data Decisions WQ Monitoring Bacteria NSI Sources of Pollutiona PCS TRI Superfund Watershed and Water Quality Modeling ·NPSMb ·TOXIROUTE ·QUAL 2 Ec a BASINS GIS Environment Windows-based Interface c Windows Shell w/FORTRAN b
BASINS Data Products Spatial Data u u u u Land use and land cover Urbanized areas Populated place locations Reach file 1 Reach file 3 Major roads USGS hydrologic unit boundaries (accounting and catalog units) u u u u u GIS u Landscape Sources Monitoring Drinking water supply sites Dam sites EPA region boundaries State boundaries County boundaries DEM Ecoregions NAQWA study unit boundaries Managed area database (Federal and Indian Lands) Soil (STATSGO)
BASINS Data Products Sources of Pollution n n Permit Compliance System (PCS) sites and computed annual loadings Industrial facility sites Toxic Release Inventory (TRI) sites (annual releases) Superfund national priority list sites Hazardous and solid waste sites GIS Landscape Sources Monitoring
BASINS Data Products Environmental Monitoring Data n n n Weather station sites USGS gauging stations Dam sites Classified shellfish area 1996 Clean water needs survey GIS Landscape Sources Monitoring
Assessment Tools included with BASINS : Broad-based evaluation of n Target watershed water quality and point source loadings. : v n Assess Watershed-based evaluation of specific water quality stations and/or dischargers and their proximity to waterbodies. Mining: Dynamic link of data elements using a combination of tables and maps. Allows for visual interpretation of geographic and historical data. n Data Reporting: Automated summary report system. Allows users to select types of information to be included. Automated generation of associated graphics and tables. n Watershed Target el e L l a n io g e R W l. Assess ed L sh er t a e ev DM l a St it on ve e L
BASINS Modeling Capabilities n Models to address multiple objectives u Source assessment u Receiving water evaluation n Models which operate on various scales u Local scale u Watersheds u Basins n Models which can be applied at various levels of complexity u Screening u Detailed
What Constitutes a Model? Data Time series Rainfall Streamflow WQ sampling Spatial/Landscape Soils Topo Cover streams Lakes Kinetics data Pollutant charact. Fate & transport Algorithms Watershed Models Hydrology Buildup Washoff Erosion Overland transport. Fate & transport Waterbody Models Hydraulics Hydrodynamic Fate & transport Scour & deposition Algal growth Output Time series Summary statistics % change/Improvement Violations Classification maps Impact maps
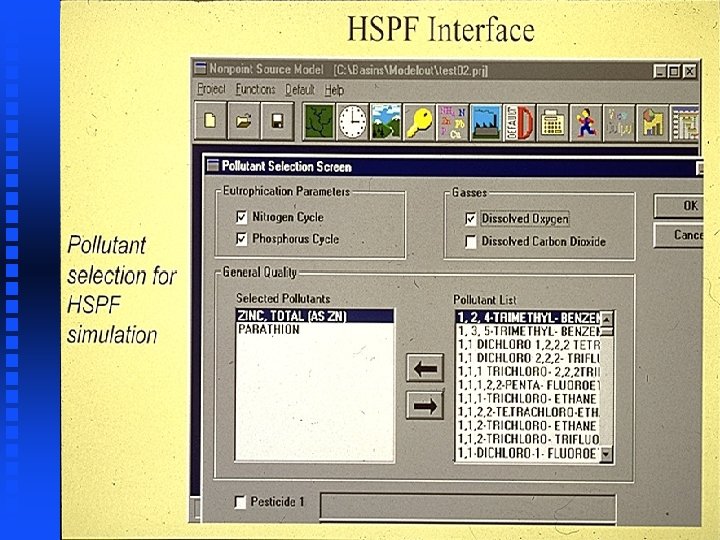
BASINS Nonpoint Source Model (NPSM) n HSPF (Hydrologic Simulation Program. FORTRAN) u Variable time step continuous simulation model u Predicts loadings in mixed land use settings for: Watershed Model F Nutrients Waterbody Model F Bacteria F Toxics F Sediment u Considers point source and nonpoint source loadings
How NPSM fits into BASINS C A BASINS - GIS D Meteorological Data B Landuse and pollutant specific Data NPSM Windows interface Point Sources E Core Model Land Use Data HSPF Stream Data F Post Processing
BASINS Stream Water Quality n Qual 2 e Models u Steady state, one-dimensional river model u Provides more detailed, process oriented river Watershed Model Waterbody Model modeling u Models up to 15 constituents u Uses streeter-phelps for D. O. Modeling u Eutrophication and nutrient processes
BASINS Water Quality Models n Toxiroute u Steady state, design flow u Evaluates instream concentrations for stream Watershed Model Waterbody Model networks with multiple discharges u Incorporates nonpoint source loadings u Chemical fate is estimated by first order decay rate (half life)
GIS Modeling Limitations n Data * Availability * Scale * Accuracy Data
Modeling the Lower Beaverdam Creek Using BASINS
Lower Beaverdam Creek Watershed n n Watershed area: 9, 753 acres (15. 24 Sq. Miles) 16. 0 miles of EPA Reach File Predominantly residential and industrial. Also contains some commercial, forested, and open areas. Primarily soil type: u u u n deep, well drained, highly erodible soils low permeability primarily clay with a thin mantle of silt, sand, or loam Significant impervious area results in high runoff potential
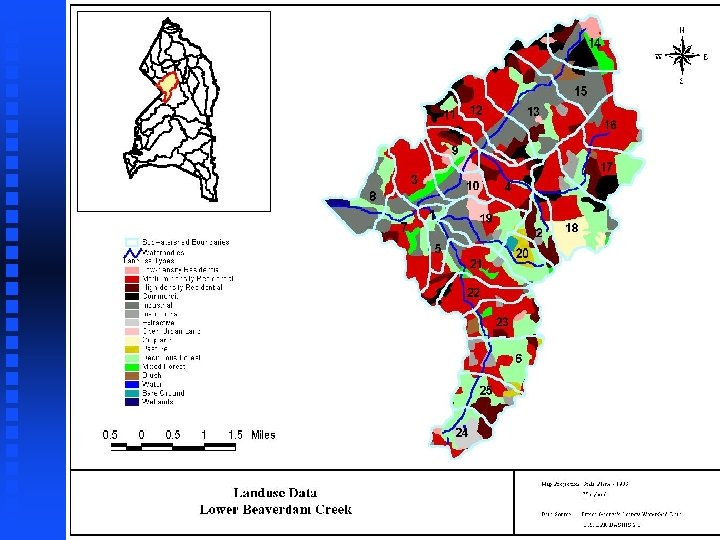
Landuse n Grouped the County landuses into 8 categories: u u n Low-density Residential (urban) Medium-density Residential (urban) High-density Residential (urban) Commercial (urban) u u Industrial (urban) Other Urban (urban) Agricultural (rural) Forested (rural) Rationale for grouping: u u Primarily urban and forested land Calibration sites used to develop the County Default Dataset represent residential, commercial, industrial, agricultural, and forested landusespecific areas Forest 22% Agriculture 3% Other 2% Urban 74%
Modeling Tasks and Requirements n Data processing and model setup n Calibration of the model for flow and water quality n Model execution and development of flow and pollutant loads
Key Data Used n BASINS data u Weather station data u Reach File, version 3. 0 stream networks u Digital Elevation Model (DEM) n Prince George’s County data u Landuse/land cover u Contours u Stream networks u Transportation/urban data u Watershed boundaries u Soil data
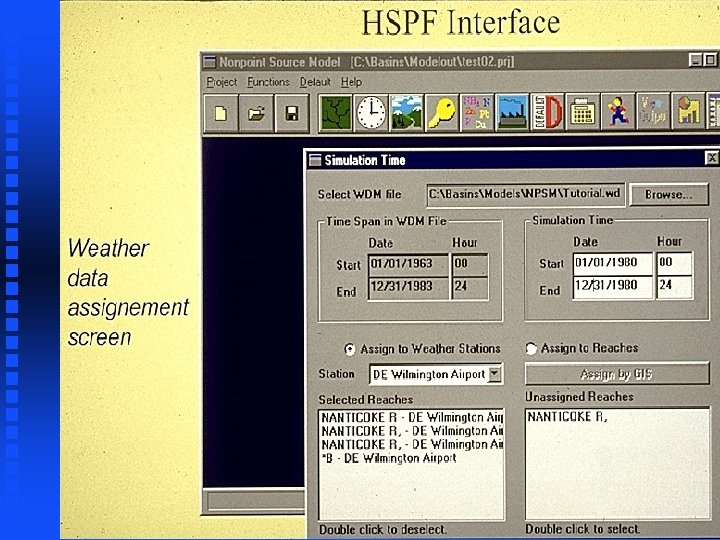
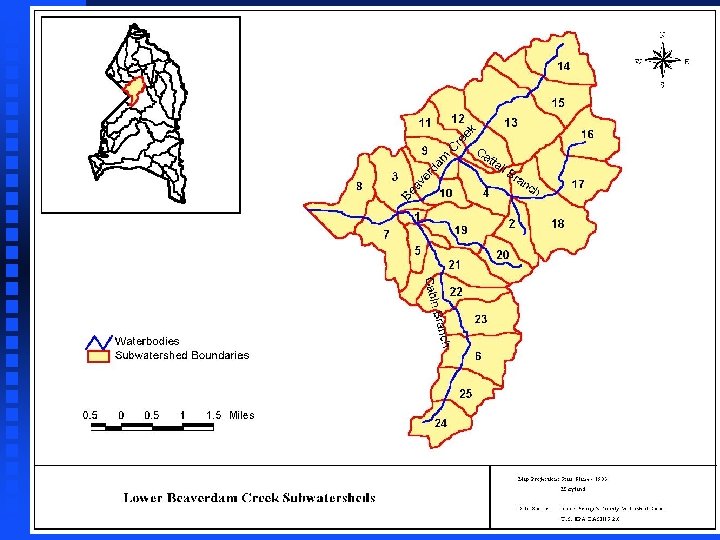
Model Setup n The Lower Beaverdam Creek watershed was segmented into 11 subwatersheds. u Delineations were based on County contour and stream network data n n n County landuse data were used to represent the subwatersheds. A WDM file containing meteorological data representative of the watershed was developed. Stream data were compiled and F-Tables (rating curves) developed.
Twenty Five (25) Sub-Basins
Lower Beaverdam Creek Watershed
Landuse Representation in the Model n Assigned impervious percentages to individual County landuse types n Used these percentages to divide landuse areas into separate pervious and impervious units
Development of a WDM File for Meteorological Data (1) NOAA Data u from Reagan National Airport: Air temperature F Dew point F Wind movement F Solar radiation F Cloud cover F Evapotranspiration F (2) County data Hourly precipitation data from the Lottsford Road weather station * *National Airport Lottsford road station
Compilation of Stream Data and Development of F-Tables n Compiled stream dimensions and characteristics for development of HSPF F-tables. Used the following data and methods to represent each stream segment: u Field observations u Detailed county topography data u HEC-2 & TR-20 outputs
Sampling Program Four years sampling data n Sample at 8 stations n u 5 land-use specific sites u 3 in-stream stations n Dry weather monitoring u Four baseflow samplings at 8 stations n Wet weather monitoring u Eight or more storm samplings every year at 8 stations
Monitoring Parameters Flow measurements n p. H and temperature n Four trace metals n Nutrients (Nitrogen and Phosphorus) n Conventional pollutants (BOD, TSS) n Oil and Grease n Fecal coliform n
Sampling Watersheds
Beaverdam Creek Land use specific basins Residential Commercial Industrial In-stream stations Beaverdam Creek
Western Branch Land use specific basins Forest Agriculture In-stream stations Western Branch Collington Branch
Hydrology Calibration n Overall water balance u u n High-flow low-flow distribution u n Compared observed and modeled peak flows and baseflows Storm flows u u n Compared annual modeled flow to observed flow at basin and subbasin outlets Calculated watershed runoff coefficients as a ratio of flow to precipitation Analyzed storm flow volumes and hydrograph shapes Considered distribution between surface runoff and interflow Seasonal variations u Analyzed seasonal variations in the flow regime
Annual water budget error: 11. 6 % Error in peak flows (highest 10 % of flows): 1. 5 % Hydrology Calibration Results n Annual Budget n Selected Storms
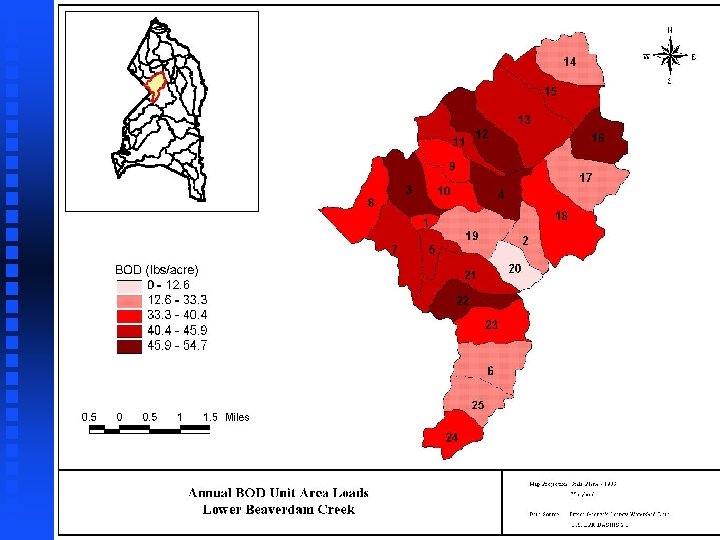
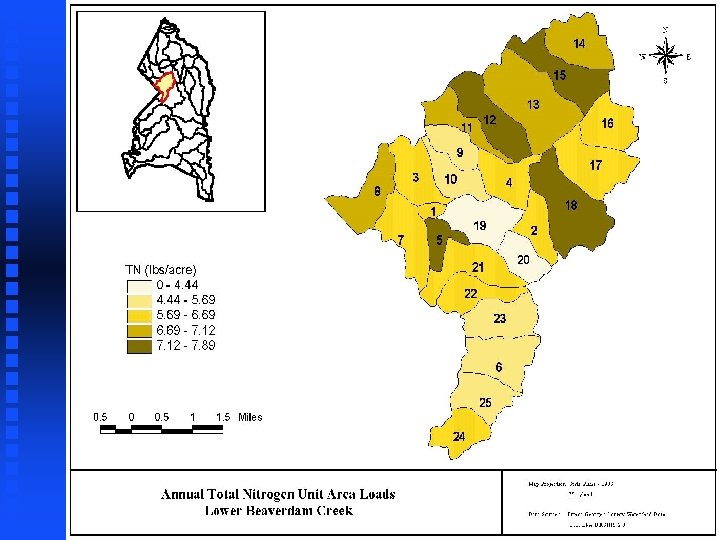
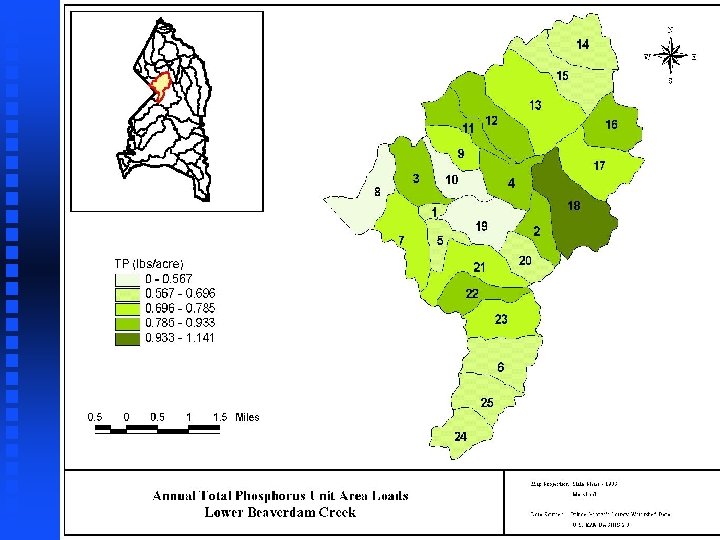
Water Quality Calibration n Performed for the following pollutants: u BOD-5 Total Nitrogen (TN) Total Phosphorus (TP) u Zinc u u n n n Compared hourly concentrations to observed concentrations (from monitoring data) Adjusted key HSPF model parameters within a reasonable range to achieve an acceptable calibration Assessed annual pollutant loads
TN BOD 5 TN TP Zinc
Simulated Pollutant Loadings
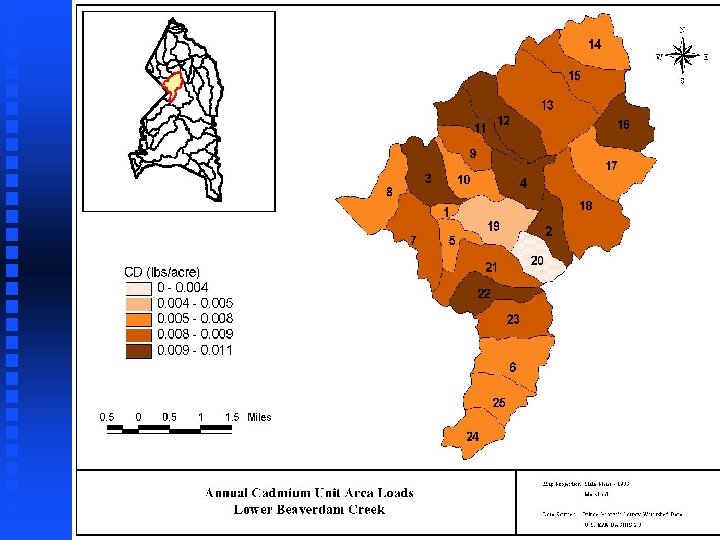
Cadmium
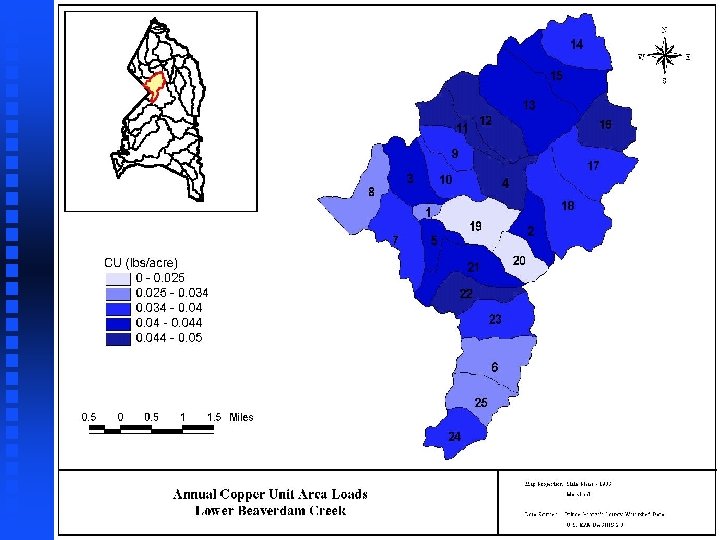
Copper
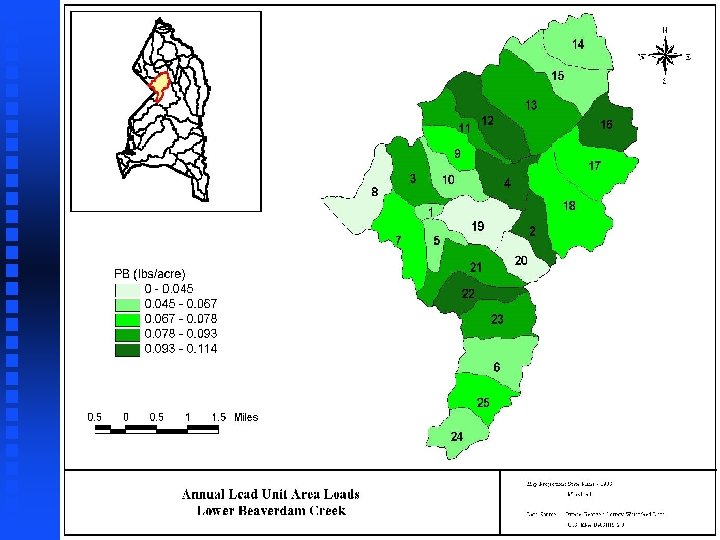
Lead
Zinc