Clustering Outline microarray data analysis Gene expression Microarrays


")


 Human lung carcinomas m. RNA expression profiling reveals distinct adenocarcinoma")

- Slides: 39
Clustering
Outline: microarray data analysis Gene expression Microarrays Preprocessing normalization scatter plots Inferential statistics t-test ANOVA Exploratory (descriptive) statistics distances clustering principal components analysis (PCA)
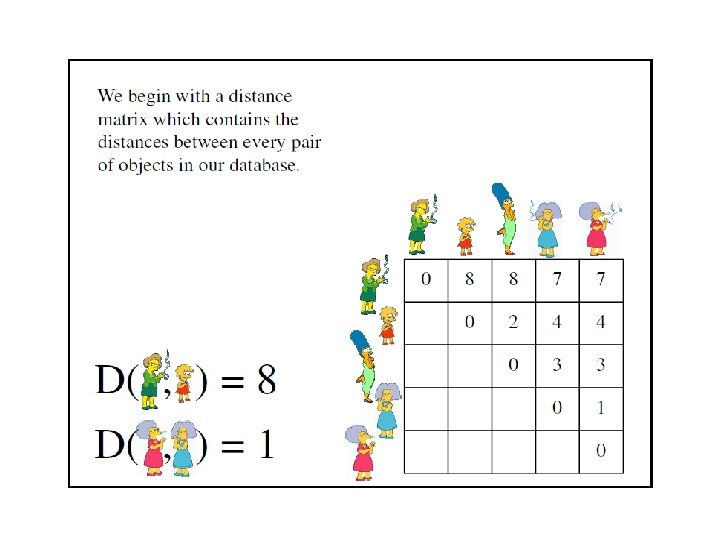
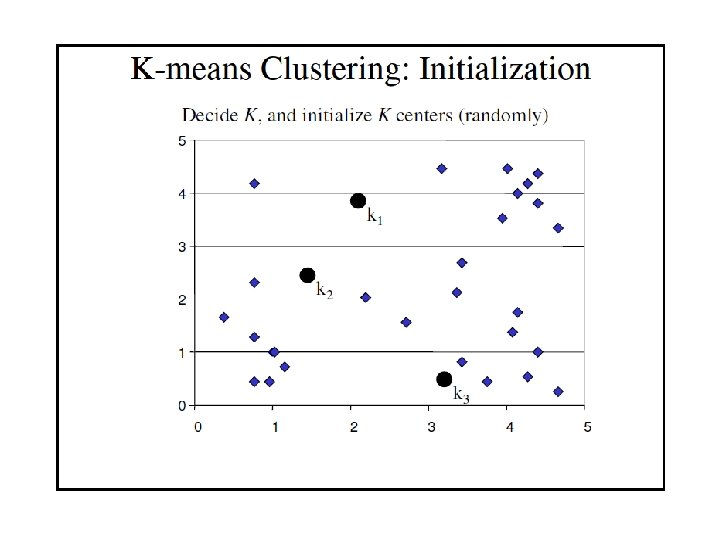
Descriptive statistics Microarray data are highly dimensional: there are many thousands of measurements made from a small number of samples. Descriptive (exploratory) statistics help you to find meaningful patterns in the data. A first step is to arrange the data in a matrix. Next, use a distance metric to define the relatedness of the different data points. Two commonly used distance metrics are: -- Euclidean distance -- Pearson coefficient of correlation Page 203
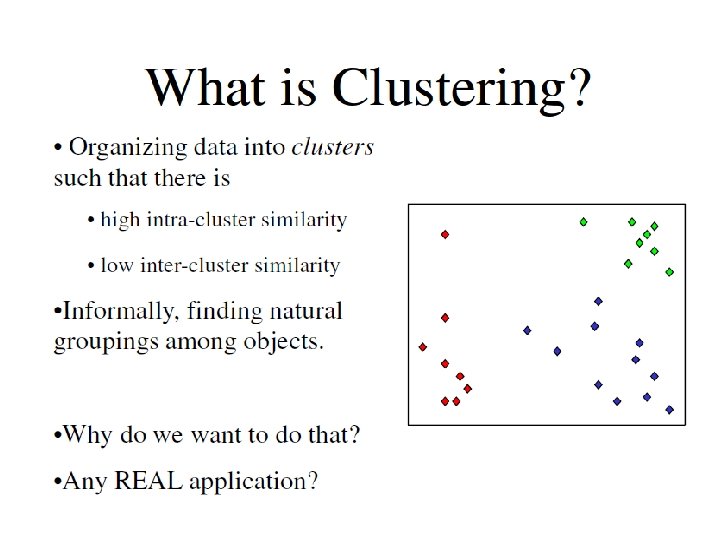
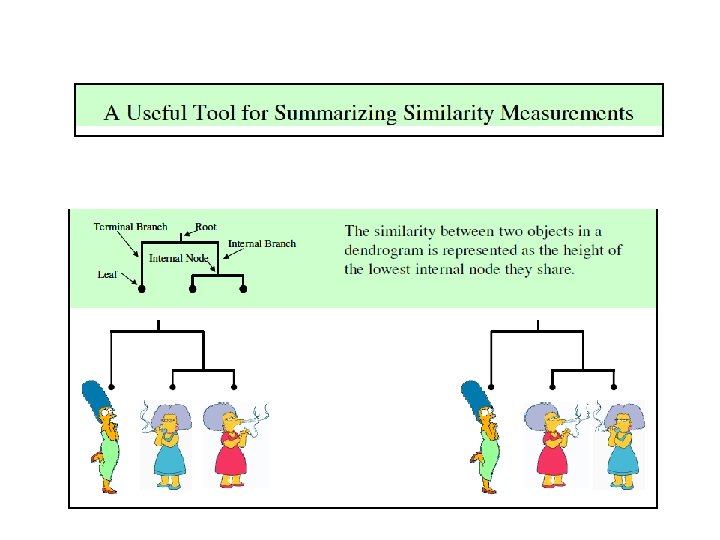
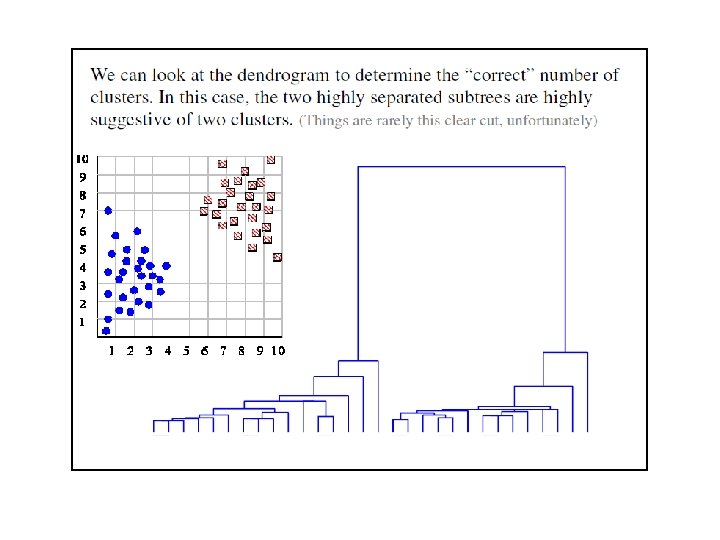
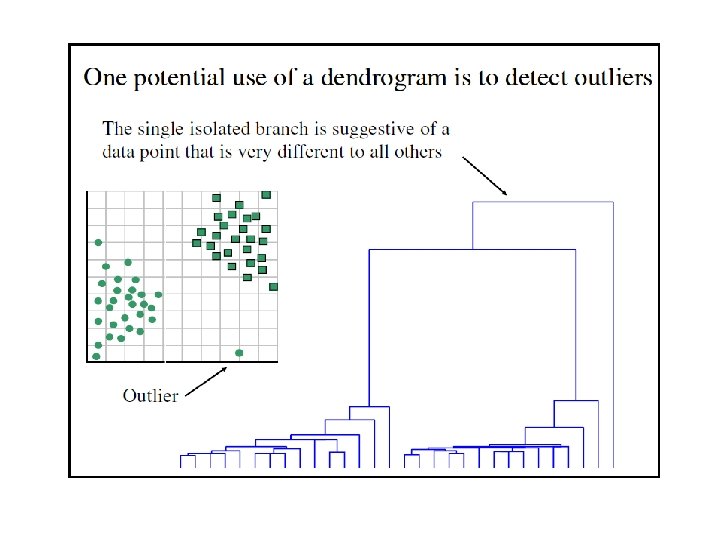
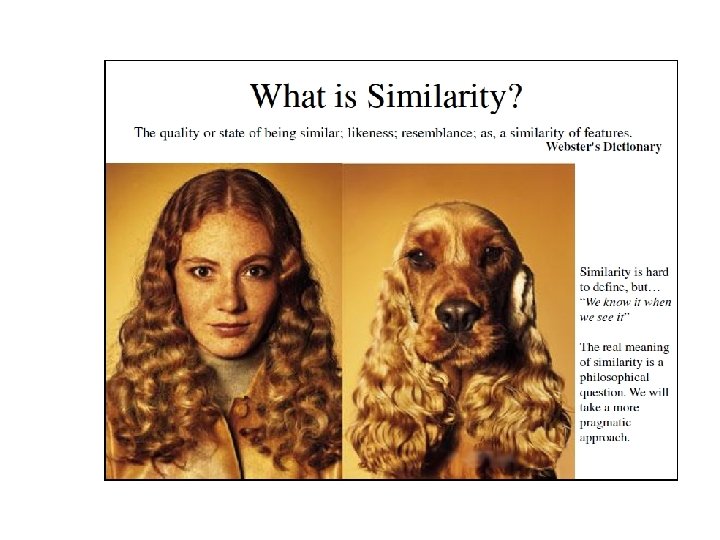
What is a cluster? A cluster is a group that has homogeneity (internal cohesion) and separation (external isolation). The relationships between objects being studied are assessed by similarity or dissimilarity measures.
Background § Clustering is one of the most important unsupervised learning processes that organizing objects into groups whose members are similar in some way. § Clustering finds structures in a collection of unlabeled data. § A cluster is a collection of objects which are similar between them and are dissimilar to the objects belonging to other clusters.
Motivation I • Microarray data quality checking – Does replicates cluster together? – Does similar conditions, time points, tissue types cluster together?
Motivation II • Cluster genes Prediction of functions of unknown genes by known ones
Functional significant gene clusters Two-way clustering Sample clusters Gene clusters
Motivation II • Cluster genes Prediction of functions of unknown genes by known ones • Cluster samples Discover clinical characteristics (e. g. survival, marker status) shared by samples.
Bhattacharjee et al. (2001) Human lung carcinomas m. RNA expression profiling reveals distinct adenocarcinoma subclasses. Proc. Natl. Acad. Sci. USA, Vol. 98, 1379013795.
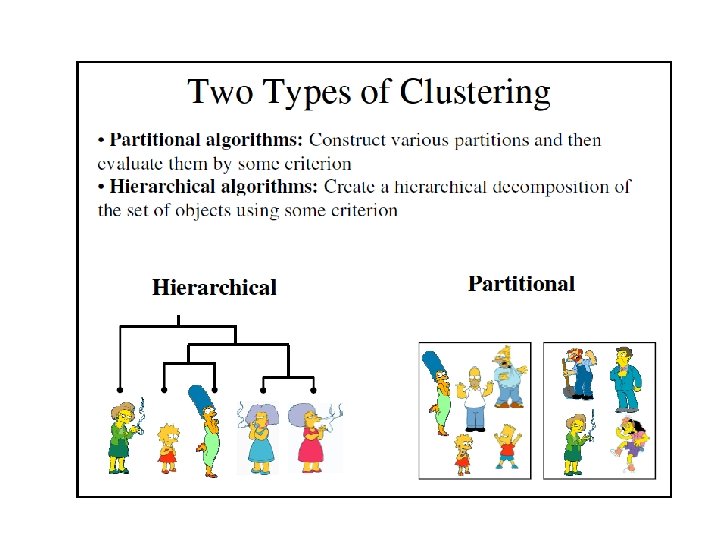
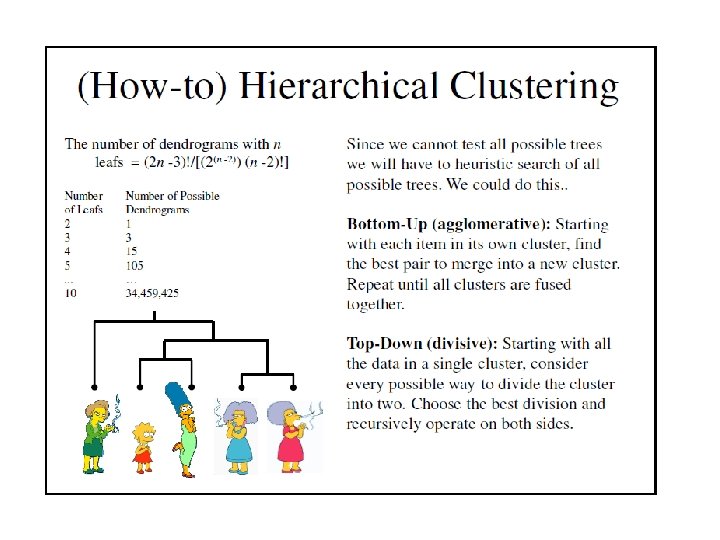
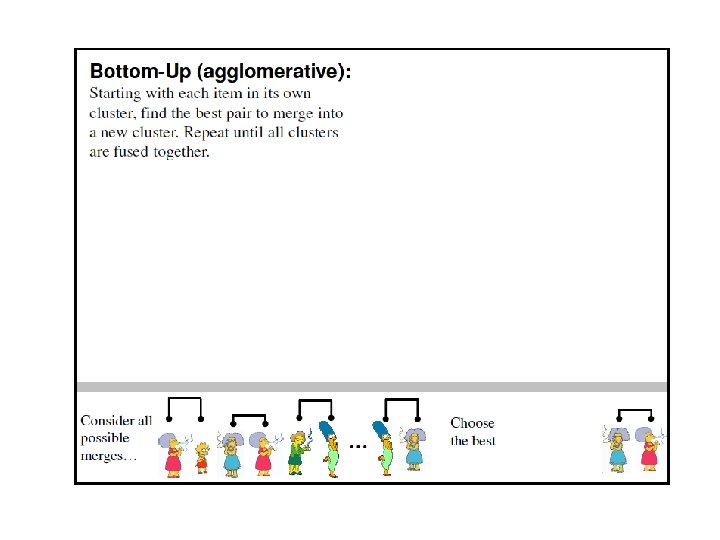
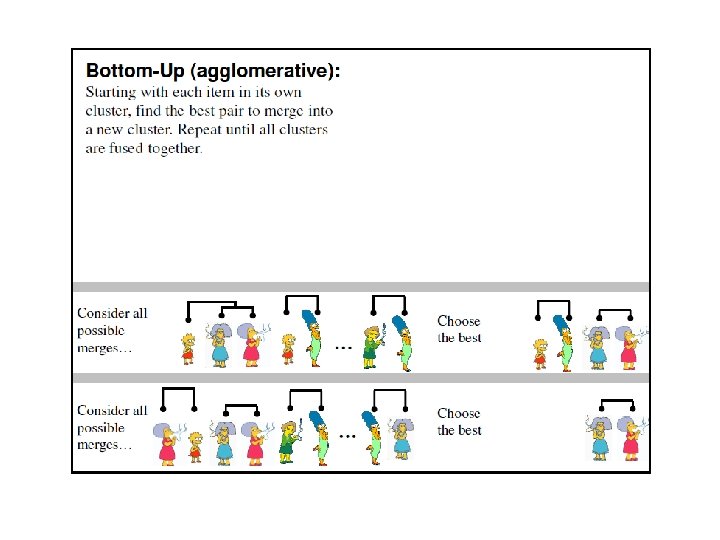
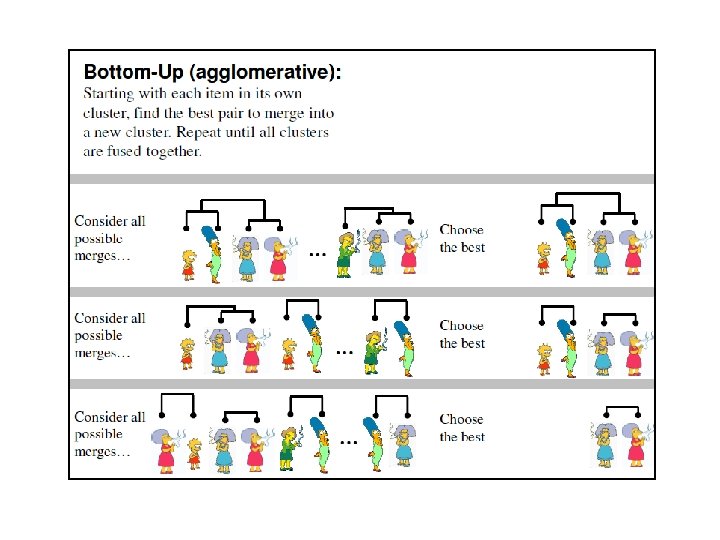
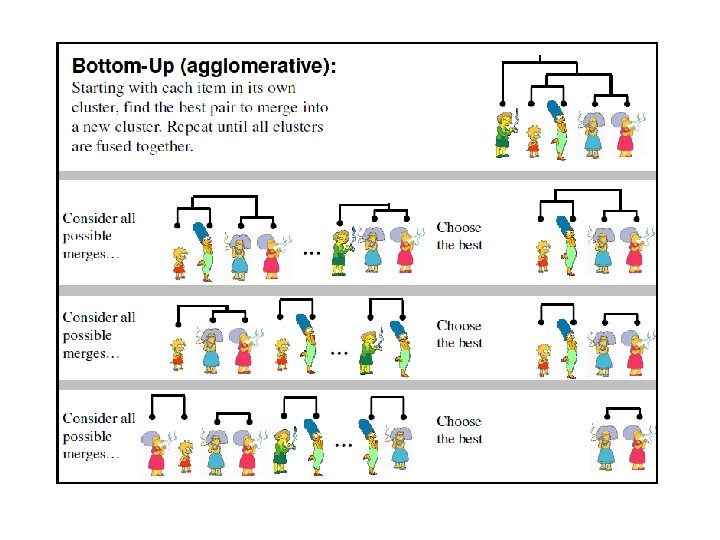
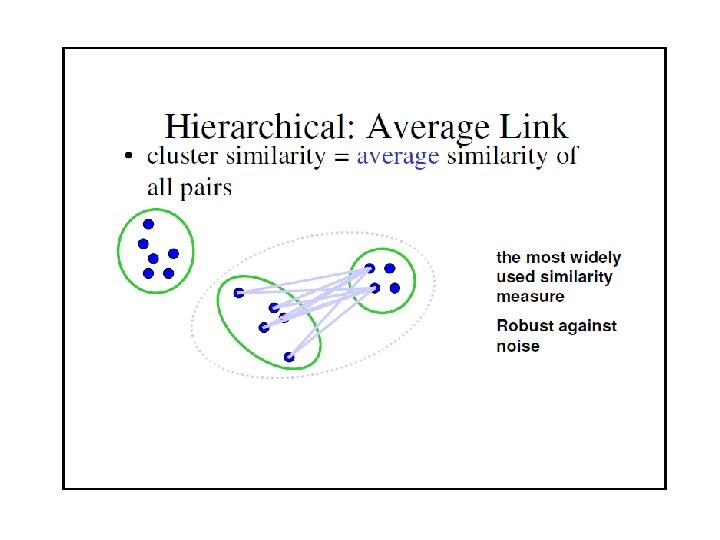
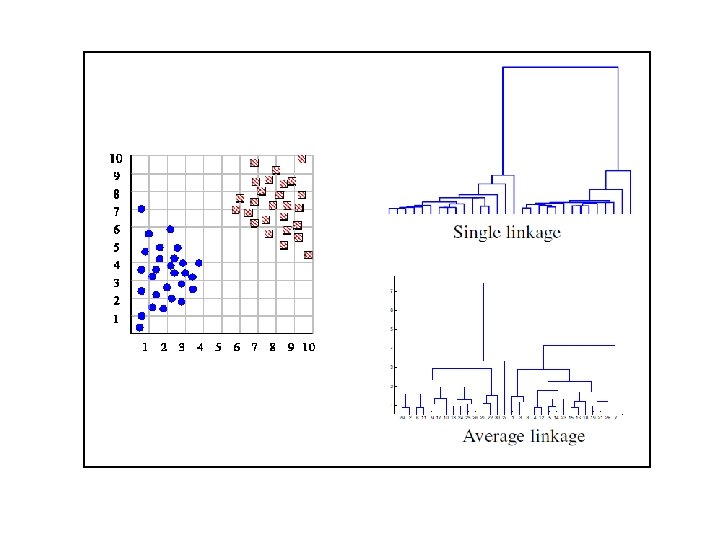
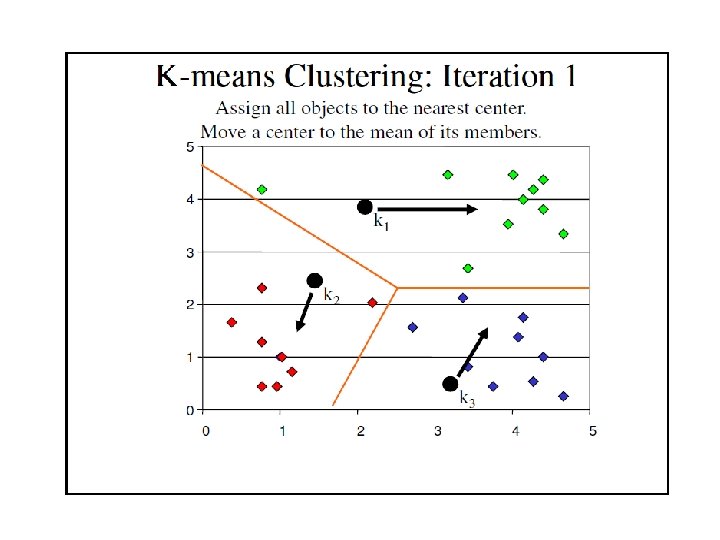
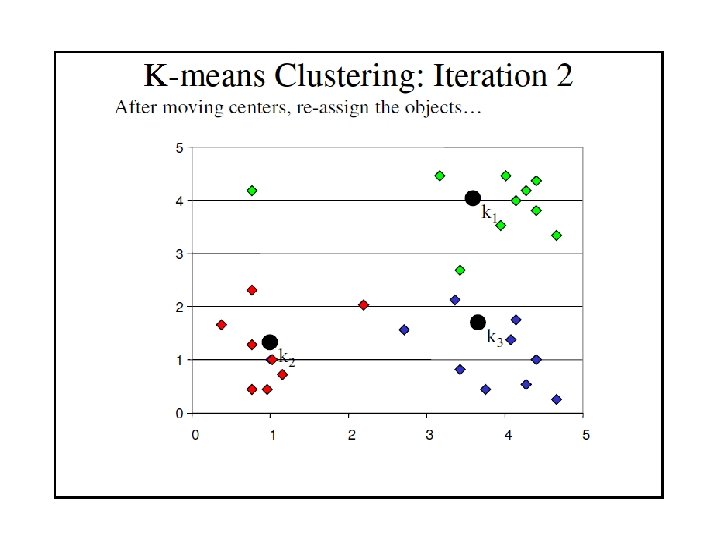
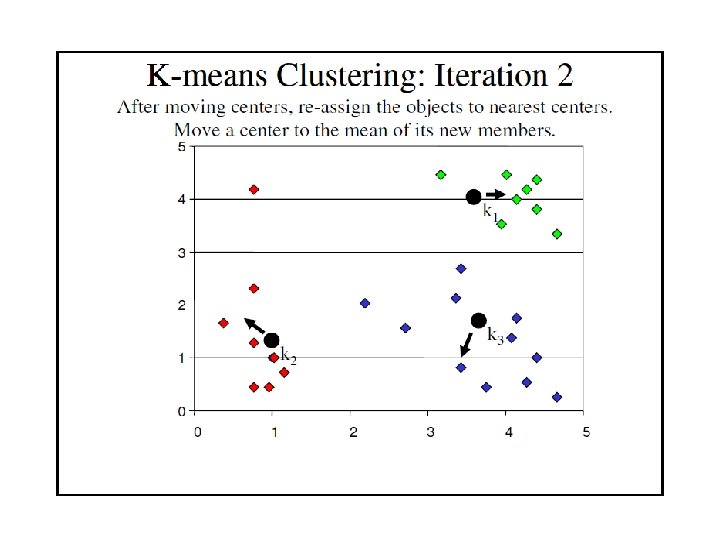
Hierarchical Clustering Calculate the similarity between all possible combinations of two profiles Two most similar clusters are grouped together to form a new cluster Calculate the similarity between the new cluster and all remaining clusters. Keys • Similarity • Clustering