Chemistry 125 Lecture 61 March 26 2010 NMR


- Slides: 30

Chemistry 125: Lecture 61 March 26, 2010 NMR Spectroscopy Through-Space Coupling, Decoupling & Correlation This For copyright notice see final page of this file

A spin = 1/2 nucleus is on perfectly frictionless bearings in a molecule, oriented by the magnetic field.

Proton Decoupling 25 MHz 100 MHz (in frame rotating at 100 MHz) 13 C C 13 NMR spectrum irradiate H (100 MHz) and pulse (25 MHz) to observe C 13 H NMR spectrum or or J ~ 125 Hz H up H average H down H C 13 up C 12 C 13 down

Observe 13 C while decoupling 1 H at various powers. 40 db CDCl 3 CH 2 CH CH C (inverse log measure of rf power) CH 2 CH 3

Observe 13 C while decoupling 1 H at various powers. 40 db (inverse log measure of rf power)

Observe 13 C while decoupling 1 H at various powers. 20 db (inverse log measure of rf power)

Observe 13 C while decoupling 1 H at various powers. 15 db (inverse log measure of rf power)

Observe 13 C while decoupling 1 H at various powers. 10 db (inverse log measure of rf power)

Observe 13 C while decoupling 1 H at various powers. 5 db (inverse log measure of rf power)

Observe 13 C while decoupling 1 H at various powers. 2 db (inverse log measure of rf power)

Observe 13 C while decoupling 1 H at various powers. 1 db (inverse log measure of rf power) NOE CH C (Nuclear Overhauser Enhancement) RF excitation of a CH 2 nucleus strengthens the signal from CH nearby nuclei. Bad for integration Good for determining structure (see below) CDCl 3 CH 2 CH 3

H 1 F 19 99. 98% MHz P 31 C 13 1% O 17 6% Precession Frequencies in Magnetic Field of ~23. 5 k. Gauss

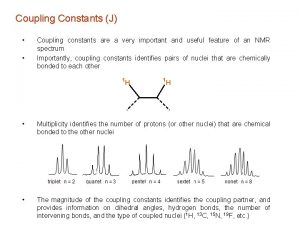
Proton-Decoupled 13 C NMR Assignments for the Artificial Sweetner Neotame Monohydrate One peak per carbon, pretty well spread out Only 1% of 13 Cs have a 13 C neighbor in the same molecule. C=Ono 13 C-C 13 arom Why C splitting? C-X e-neg Calkane Prof. Eric Munson, Kansas Univ.

Power of Correlation: Dilute 13 C Double Labeling 2 -D NMR 2 -D Chromatography

Double Labeling Introduction: Lanosterol Biogenesis Cf. Frames 6 -13 of Lecture 52 and Sec. 12. 13 pp. 554 -562

Squalene + + + HO + O+ H + +

Squalene H 3 C H H + CH 3 C CH 3 H+ H + + CH 3 + H +H CH 3 Lanosterol HO H 3 C CH 3 (source of cholesterol & steroid hormones)

Squalene H 3 C Cute Story H H + CH 3 + 3° 3° H +H 3° CH 3 C CH 3 + + 3° 3° CH 3 Is it True? CH 3 H+ H Lanosterol (Wait for NMR) HO H 3 C CH 3 (source of cholesterol & steroid hormones)

Squalene Single Label Enrichment H 3 C H 13 C CH 3 H Label CH 3 H 3 C CH 3 Enriched Peaks (100 x stronger than natural-abundance peaks) Lanosterol HO H 3 C CH 3

Squalene Single Label Enrichment H 3 C H 13 C CH 3 H Label CH 3 H 3 C CH 3 Enriched Peaks Lanosterol HO H 3 C CH 3

Squalene H 3 C H 13 C CH 3 H Double Label CH 3 H 3 C CH 3 Lanosterol HO H 3 C CH 3

Squalene Few single presursor molecules have any C 13 label, but those HC that are labeled have two C 13 s. 3 H Double Label DILUTE ! 13 C CH 3 HO H 3 C CH 3 H CH 3 The dilute double label CH 3 experiment enhances the H 3 C These 13 are both labeled, same 12 labeled, C peaks but as the both not in the same molecule single label experiments, in the same molecule but only 8 of them show spin-spin splitting (because their C-C bond stays intact). Strongly confirms the rearrangement scheme. Double-Doublet (proton decoupled) 13 C-13 C splitting (neighboring 13 Cs) Proves that they as a unit. Power ofentered Correlation

Power of Correlation: Dilute 13 C Double Labeling 2 -D NMR 2 -D Chromatography

on co al s ng ho es w ed s n by orm ov al er sp la pp ect ru in m g si gn al s Less-congested, off-diagonal peaks appear when “tickling” one signal on the diagonal enhances another. av i ly di ag is within 6Å of NHs at 8. 9, 8. 3, 8. 25, 7. 7 NH at 7. 25 to 1 H Correlation by NOE (through-space magnetic interaction) proximity (< 6Å) of R H O H N Identify NH with N amino acid by H O H coupling through R protons CH to R in protein polymer Narrow range; mostly HN-C=O protons he 1 H With Molecular Mechanics Constraints gives 3 -D Structure (without crystal!)

H 3 C CH 3 + A A B H 3 C CH 3 D CH 3 Methide Shift: -2 (as shown) or 1 -Anywhere? CH 3 + + CH 3 1 H C A vs. 1 H Correlation in TIME D B B C Note: ppm scale is slanted and (p "wackbards". The protons in methyls pm C and “ 2 -Dimensional” D are near + charge (see resonance ) C D structures), thus deshielded NMR from lack of electron density, and appear furthest to right - at highest . (Range of peaks is 150 Hz in 60 MHz spectrometer = 2. 5 ppm. ) + + + 0. 3 sec 40°C + + + 1

"3 -D" Version of contour plot on previous slide

Power of Correlation: Dilute 13 C Double Labeling 2 -D NMR 2 -D Chromatography

Developed with CHCl 3 : Me. OH : C 6 H 6 (25 : 3) Developed with Et. OAc : 96%Et. OH : H 2 O (80 : 15 : 5) Thin Layer Chromatography of partially purified extract of brown algae looking for ecdysteroids http: //www. chromsource. com/ books/Milestones-TLC. pdf

better resolution in 2 -D Thin Layer Chromatography of partially purified extract of brown algae looking for ecdysteroids ("3 -D" because ecdysone spots turn turquoise after vanillin/ H 2 SO 4 spray) http: //www. chromsource. com/ books/Milestones-TLC. pdf

End of Lecture 61 March 26, 2010 Copyright © J. M. Mc. Bride 2010. Some rights reserved. Except for cited third-party materials, and those used by visiting speakers, all content is licensed under a Creative Commons License (Attribution-Non. Commercial-Share. Alike 3. 0). Use of this content constitutes your acceptance of the noted license and the terms and conditions of use. Materials from Wikimedia Commons are denoted by the symbol . Third party materials may be subject to additional intellectual property notices, information, or restrictions. The following attribution may be used when reusing material that is not identified as third-party content: J. M. Mc. Bride, Chem 125. License: Creative Commons BY-NC-SA 3. 0
 Poland national anthem lyrics
 March 22 2010
 01:640:244 lecture notes - lecture 15: plat, idah, farad
 June 2010 chemistry regents answers
 An introduction to atmospheric physics
 Advanced inorganic chemistry lecture notes
 Ib chemistry organic chemistry
 Inorganic vs organic chemistry
 Przesunięcie chemiczne nmr
 Tabel pergeseran kimia h nmr
 4 methylacetophenone nmr
 Geminal and vicinal coupling constants
 Multipletowość nmr
 Nmr instrument diagram
 Resonance in nmr
 Nmr sample requirements
 Nmr active and inactive nuclei
 1 bromopropane nmr
 Benzoic acid hnmr
 247remote
 Application of nmr
 Alkyne carbon nmr
 Nuclear spin quantum number
 Nmr polymer
 Nmr
Nmr Nmr spectrum of 1 1 2-tribromoethane
 Tabel pergeseran kimia h nmr
 Nmr esr
 Nmr picture
 Ketone nmr
 Https www google de


