Chapter 12 Trading Strategies Involving Options Strategies to


 (synthetic put)")
 Profit Long asset Covered call ST K")

 Long stock profit & loss = ST - SO")
 + p")
 Profit Long call ST K Synthetic")

 – P If")
 synthetic call Profit Long asset")


 Short put K ST Synthetic")


 Profit Long call , K 1 K 2 –")
 –")

 Range Payoff Call 1 (long) ST ≤ K 1")

 profit Bull spread vs long call Long call Bull")

 2. Bull spreads using puts - Long put at")


 profit p 2 = 3. 05 - P 1")
 - p")
 Put 1 (short) ST ≤ K 1 Exercised K 1 <")
 Payoff Range ST ≤ K 1 < S T")


 Short put, K 1 P 1 = 2 K")
 +")
 Put 2 (Long) ST ≤ K 1 Exercised K 1")
 Range Payoff Put 1(Short) Obligation to buy ST ≤")

 2 Bear spread using calls - Short call at")

 Long put, K 2 C 1 = 1. 9")
 +")
 Call 2 (Long) ST ≤ K 1 not exercised K")
 Range ST ≤ K 1 Pay off Profit &")


 b) bear spread : Short put 1 , long put")


 Call 2 (Short) Put 1 (Short) Put 2 (long) Total")
 Pay receive Pay At initiation, we pay = c")
e-rt = C 1 - C 2 –P 1+P 2")

 1. Butterfly spread using calls (cont’) ST Value/payoff Call (long) K")
 Long 1 call, K 1 Long 1 call ,")
 -C K 1, C 1")
 Rang Payoff Call (long) Right to buy ST ≤")


 ST K 1 K 2 K 3 51 53")
 Short 2 puts, K 2 2 P 2 =")
-P K 1 P 1 &")
 Range Put 1 (Long) 2 x Put 2 (Short)")


 Calendar spreads using puts - Short 1 put ,")


 Long straddle = long call + long put ST Pay")
 : long Straddle Profit Long call Long straddle -P=-4 50")
 – C Long")
 : Long straddle Stock Pay off Profit/loss =total payoff –")

 Short straddle Example Short 1 call, K = 60, C")

 C + P = 10 C=6 P=4 50 60 70 BE")
 + C Short")
 Stock price Payoff Short call Short Put Total Profit & loss")


 Maximum loss = - C 2 – P 1 Maximum")


 Profit P 1+C 2 = 7 P 1 = 4")

- Slides: 121
Chapter 12 Trading Strategies Involving Options
Strategies to be Considered 1. Bond plus option to create principal protected note 2. Stock plus option 3. Two or more options of the same type (a spread) 4. Two or more options of different types (a combination) 2
Principal Protected Note • Allows investor to take a risky position without risking any principal • Example: $1000 instrument consisting of • 3 -year zero-coupon bond with principal of $1000 • 3 -year at-the-money call option on a stock portfolio currently worth $1000 3
1. Principal Protected Note = Bond + Call option Allows investor to take a risky position without risking any principal Pay off per $ 100 invested $100 0% Reference asset returns
Q: Is it a good deal for investor A: No. When banks sell this, they are sure that they get profits. Fees Time value of money Credit risks Just get the principal back after many years is not a good investment. Banks can go bankrupt
. 2 Trading an Option and the Underlying Asset (synthetic short put) (synthetic put) 2. 1 Covered Call 2. 2 Reverse of covered call = naked call + long asset (short call) = long call + short asset 2. 3 Protective put (synthetic call) 2. 4 Reverse of protective put = long put + long asset = short put + short asset (synthetic short call)
2. 1 Covered Call (synthetic short put) Profit Long asset Covered call ST K Risk Short call (naked call) Unlimited loss -∞
Naked call Using dynamic strategy Covered If asset price is greater than K, use covered call If asset price is lower than K, use naked call Why use dynamic strategy? Because we predicted that the price will decrease. So, we use naked call (short call) If price increase, risk for us. Instead of using long or short position in asset, we can also use long or short position of futures on the underlying asset to create Synthetic options
2. 1 Covered call (Con't) Long stock profit & loss = ST - SO Short call profit & loss = Min (K-ST, 0) + c Covered call profit & loss = ST – S 0 + Min (K-ST, 0) + c If ST ≤ K long call not exercise long call exercise profit = ST – S 0 + c If ST ˃ K profit = ST – S 0 + K- ST +c = K-S 0 + C
Actual short put profit & loss = Min (ST - K, O) + p If ST ≤ K long put exercise profit = ST - K + p If ST ˃ K long put not exercise profit = p Covered call break-even stock price ST = S 0 - C
2. 2 Reverse of covered call (Synthetic put) Profit Long call ST K Synthetic put Short asset
Short asset : profit & loss = S 0 – ST Long call : profit & loss = Max (ST – K, 0) – C Synthetic put : profit & loss = S 0 -ST + Max (ST – K, 0) - C If ST ≤ K long call not exercise profit = S 0 – ST – C If ST ˃ K long call exercise Profit = S 0 – ST +ST – K – C = S 0 – K – C
Actual put profit & loss = Max (K - ST, 0) – P If ST ≤ K, profit = K- ST – P If ST ˃ K, profit = - P
2. 3 Protective Put (use put as an insurance) synthetic call Profit Long asset Protective put K ST Long put This is the classic application for put. We have asset, we are afraid that the price will decrease.
Long stock : profit & loss = ST – S 0 Long put : profit & loss = Max (K- ST, 0) – p Protective : profit & loss = ST – S 0 + Max (K – ST, 0) – P If ST ˂ K exercise long put profit = ST – S 0 + K – ST – p = K – S 0 – p If ST ≥ K not exercise long put profit = ST – S 0 – p
2. 3 Protective Put Actual put profit & loss = Max (ST – K, 0) – c If ST ˂ K, profit = – c If ST ≥ K, profit = ST – K – c
2. 4 Reverse of protective put (synthetic short call) Short put K ST Synthetic short call Short stock
Short stock : profit & loss = S 0 – ST Short put : profit & loss = Min (ST – K, 0) + p Synthetic short call : profit & loss = S 0 – ST + Min (ST- K, 0) + p If ST ˂ K long put exercise profit = S 0 – ST + ST – K + p = S 0 – K + p If ST ≥ K long put not exercise profit = S 0 – ST + p
2. 4 Reverse of protective put Actual short call profit & loss = Min (K - ST, O) + P If ST ˂ K, profit = C If ST ≥ K, profit = K - ST + C
. 3 Spreads involves taking a position in two or more options of the same type. Spreads offer the potential for a small profit while limiting the risk. Risk reduction is achieved by being long in one option and short in another.
3. 1 Bull Spreads 3. 5 Calendar Spreads ● Bull spreads using calls ● Calendar spreads using calls ● Bull spreads using puts ● Calendar spreads using puts 3. 2 Bear Spreads ● Bear spreads using puts 3. 3 Box Spreads 3. 4 Butterfly spreads ● Butterfly spreads using calls ● Butterfly spreads using puts 3. 6 Diagonal Spreads
3. 1 Bull spreads 1. Bull spreads using calls - long call at K 1 Same maturity - short call at K 2 K 1 ˂ K 2 So different call premium C 1 ˃ C 2 Pay C 1 , receive C 2 So bull spreads using calls requires an initial investment.
Example Long call , K 1 = 14 , C 1 =1. 9 long pay call premium Short call , K 2 = 16 , C 2 = 1 short receive call premium Net cash flow , initial investment = - C 1 + C 2 = -1. 9 + 1 = - 0. 9
ST Value/Payoff Call 1 K 2 Profit/loss Call 2 12 0 0 -0. 9 13 0 0 -0. 9 14 0 0 -0. 9 15 1 0 0. 1 16 2 0 1. 1 17 3 -1 1. 1 18 4 -2 1. 1 . . . ST ≤ K 1 ˂ S T ˂ K 2 ST ≥ K 2
Bull spreads using calls (cont’) Profit Long call , K 1 K 2 – K 1 + C 2 – C 1 = 1. 1 C 2 = 1 - C 1 +C 2 = - 0. 9 14 14. 9 16 K 1 BE Bull spread ST K 2 C 1 = -1. 9 Short call , K 2 Break – even = K 1 + C 1 C 2 = K 1 + net premium = 14. 9
Long call : profit & loss = Max (ST – K , 0) – C K 1 , C 1 Short call : profit & loss = Min (K – ST , 0) + C K 2 , C 2 Bull spreads : profit & loss = Max (ST – K , 0) – C, + Min (K 2 – ST, 0) + C 2 Three ranges 1. ST ≤ K 1 2. K 1 ˂ ST ˂ K 2 3. ST ≥ K 2 1 2 3
Range Call 1 : Long call Short call : call 2 If ST ≤ K 1 Not exercised If K 1 ˂ ST ˂ K 2 Exercised Not exercised If ST ≥ K 2 Exercised exercised
Bull spreads using calls (cont’) Range Payoff Call 1 (long) ST ≤ K 1 Call 2 (short) Right to buy Obligation to sell 0 0 Not exercised Profit & loss Total Call 1 (long) Call 2 (Short) 0 -C 1 C 2 Total - C 1 + C 2 ˂ 0 ST – K 1 – C 1 + C 2 K 1 ˂ S T ˂ K 2 ST – K 1 0 ST – K 1 – C 1 C 2 Depend on ST Not exercised Depend on ST Sell Buy ST ≥ K 2 ST – K 1 Sell Buy K 2 – K 1 – C 1 +C 2 K 2 – S T Sell Buy K 2 – K 1 ST – K 1 – C 1 K 2 – S T + C 2
Maximum loss = - C 1 + C 2 Always negative because C 1 ˃ C 2 Maximum profit = K 2 – K 1 + C 2 – C 1 Break - even range = K 1 ˂ ST ˂ K 2 Set profit = 0 ST – K 1 – C 1 + C 2 = 0 ST = K 1 + C 1 – C 2 • A Bull spread strategy limits the investor’s upside as well as downside risk • Investor has a call option with a strike price = K 1 and give up some upside potential by selling a call option with K 2 • In return for giving up the upside potential, investor gets the price of the option with strike price K 2
Bull spreads using call (cont’) profit Bull spread vs long call Long call Bull Spread 1. 1 14 14. 9 15. 9 16 ST - 0. 9 - 1. 9 Smaller loss for bull spread, lower initial investment.
Bull spread reach break-even point easier than long call Maximum loss Break–even at ST Long call -C K+C Bull spread -C 1 + C 2 K 1 + C 2 – C 2 When should we use bull spread? expect small increase in stock price because of limited maximum profit.
3. 1 Bull Spreads (cont’) 2. Bull spreads using puts - Long put at K 1 Same maturity - Short put at K 2 K 1 ˂ K 2 So, different put premium p 1 ˂ p 2 Pay p 1 , receive p 2 So, bull spreads using puts will provide a net reception of premium.
Example Long put, K 1 = 14 , p 1 = 2 Long pay put premium Short put, K 2 = 16 , p 2 = 3. 05 Short receive put premium Net initial cash flow = - p 1 + p 2 = -2+3. 05 = 1. 05
ST Value/Payoff Put 1 K 2 Profit/loss = Put 1 + Put 2+ 1. 05 Put 2 12 2 -4 -0. 95 13 1 -3 -0. 95 14 0 -2 -0. 95 15 0 -1 0. 05 16 0 0 1. 05 17 0 0 1. 05 18 0 0 1. 05 ST ≤ K 1 ˂ S T ˂ K 2 ST ≥ K 2
Bull Spreads using puts (cont’) profit p 2 = 3. 05 - P 1 + P 2 = 1. 05 K 1 – K 2 –P 1+P 2 = 0. 95 P 1 = -2 Short put, K 2 14 14. 95 16 K 1 BE K 2 Bull spread ST Long put, K 1 Break-even = K 2 + P 1 – P 2 = 14. 95
Long put : Profit & Loss = Max (K - ST, 0) - p , K 1 , p 1 Short put : Profit & Loss = Min (ST - K, 0) + p , K 2 , p 2 Bull spread : Profit & Loss = Max (K 1 - ST , 0) + Min (ST - K 2, 0) + p 2 Three ranges K 1 1 ST ≤ K 1 K 2 2 K 1 < S T < K 2 1 3 ST ≥ K 2 2 3
Range Put 1(Long) Put 1 (short) ST ≤ K 1 Exercised K 1 < S T < K 2 not exercised Exercised ST ≥ K 2 not exercised
Bull spread using puts (cont') Payoff Range ST ≤ K 1 < S T < K 2 Put 1 (Long) Profit & loss Total Put 1 (Long) Right to sell Put 2 (Short) Obligation to Buy K 1 – S T ST – K 2 K 1 – S T – p 1 Sell Buy 0 ST – K 2 Sell Buy Depend on ST - p 1 Put 2 (short) Total ST – K 2 + p 2 K 1 – K 2 – p 1 + p 2 ST – K 2 +p 2 ST – K 2 – p 1 + p 2 Not exercised ST ≥ K 2 0 0 Not exercised Depend on ST - p 1 0 p 2 - p 1 + p 2
Maximum loss = K 1 - K 2 - P 1 + P 2 Maximum profit = - P 1 + P 2 Break -even ---> range = K 1 < ST < K 2 set profit = 0 ST - K 2 - P 1 + P 2 = 0 ST = K 2 + P 1 - P 2 Bull spreads using calls are more popular ---> When short put is deep ITM, long position may choose to early exercise, that is when profit & loss of bull spread is at maximum.
3. 2 Bear Spreads 1 Bear spread using puts - Short put at K 1. receive p 1 - Long put at K 2 pay p 2 K 1 < K 2 p 1 < p 2 Bear spread using puts requires an initial investment. Example Short put , K 1 = 14 , P 1 = 2 Long put , K 2 = 16 , P 2 = 3. 05 Net initial cash flow = P 1 - P 2 = 2 - 3. 05 = -1. 05
ST Value/payoff Put 1 Profit/loss = put 1+put 2 -1. 05 Put 2 12 -2 4 0. 95 13 -1 3 0. 95 14 0 2 0. 95 15 0 1 -0. 05 16 0 0 -1. 05 17 0 0 -1. 05 18 0 0 -1. 05 ST ≤ K 1 < ST < K 2 ST ≥ K 2
Bear spread using puts (cont') Short put, K 1 P 1 = 2 K 2 -K 1+P 1 -P 2=0. 95 14 16 ST P 1 -P 2 = 1. 05 K 1 BE K 2 Bear spread Long put, K 2 P 2 = -3. 05 Break-even = K 2+P 1 -P 2 = 14. 95
Short put : Profit & Loss = Min (ST – K , 0) + P K 1 , P 1 Long put : Profit & Loss = Max (K – ST , 0) - P K 2 , P 2 Bull spread : Profit & Loss = Min (ST – K 1 , 0)+ P , + Max (K 2 - ST , 0 - P 2 Three ranges K 1 1 ST ≤ K 1 K 2 2 K 1 < S T < K 2 1 3 ST ≥ K 2 2 3
Range Put 1 (Short) Put 2 (Long) ST ≤ K 1 Exercised K 1 < S T < K 2 not exercised Exercised ST ≥ K 2 not exercised
Bear spread using puts (cont') Range Payoff Put 1(Short) Obligation to buy ST ≤ K 1 < S T < K 2 ST ≥ K 2 Put 2(Long) Right to sell Profit & loss Total ST – K 1 K 2 – ST K 2 – K 1 0 K 2 – ST 0 0 0 Put 1 (Short) Put 2(long) Total ST – K 1 + P 1 K 2 – ST – P 2 K 2 – K 1 + P 1 –P 2 P 1 K 2 – ST – P 2 K 2 – ST + P 1 – P 2 P 1 - P 2 P 1 – P 2
Maximum loss = P 1 - P 2 This is negative because P 1 < P 2 Maximum profit = K 2 - K 1 + P 1 - P 2 Break - even ---> range = K 1 < ST < K 2 Set profit = 0 K 2 - ST + P 1 - P 2 = 0 ST = K 2+P 1 -P 2 Using bear spread ---> investor who bought a put choose to give up some of the profit potential by selling a put with a lower strike price. In return for the profit given up, the investor gets the price of the option sold
3. 2 Bear spread (cont') 2 Bear spread using calls - Short call at K 1 receive call premium C 1 - Long call at K 2 pay call premium C 2 K 1 < K 2 C 1 > C 2 receive C 1 , pay C 2 Bear spread using calls provide a net reception pf premium. Example Short call , K 1 = 14, C 1 = 1. 9 Long call , K 2 = 16 , C 2 = 1 Net initial cash flow = C 1 - C 2 =1. 9 -1 = 0. 9
ST Value/Payoff Profit/loss = call 1 + call 2 + 0. 9 Call 1 Call 2 12 0 0 0. 9 13 0 0 0. 9 14 0 0 0. 9 15 -1 0 -0. 1 16 -2 0 -1. 1 17 -3 1 -1. 1 18 -4 2 -1. 1 ST ≤ K 1 < ST < K 2 ST ≤ K 2
Bear spread using calls (cont') Long put, K 2 C 1 = 1. 9 C 1 – C 2 = 0. 9 14 16 ST Bear spread C 2 = -1 K 1 – K 2 + C 1 – C 2 = 1. 1 K 1 BE K 2 Short put, K 1 Break-even = K 1 + C 1 –C 2 =14 + 1. 9 - 1 = 14. 9
Short call : Profit & Loss = Min (K - ST , 0) + C K 1 , C 1 Long call : Profit & Loss = Max (ST - K , 0) - C K 2 , C 2 Bull spread : Profit & Loss = Min ( K 1 - ST , 0)+ C, + Max (ST – K 2 , 0) - C 2 Three ranges K 1 1 ST ≤ K 1 K 2 2 K 1 < S T < K 2 1 3 ST ≥ K 2 2 3
Range Call 1 (Short) Call 2 (Long) ST ≤ K 1 not exercised K 1 < S T < K 2 Exercised not exercised ST ≥ K 2 Exercised
Bear spread using calls (cont’) Range ST ≤ K 1 Pay off Profit & loss Call 1(Short) Obligation to sell Call 2(Long) Right to buy Total Call 1 (Short) Call 2 (Long) Total 0 0 0 C 1 -C 2 C 1 – C 2 0 K 1 – S T + C 1 -C 2 K 1 – S T + C 1 – C 2 K 1 – S T ST – K 2 K 1 – S T + C 1 ST – K 2 – C 2 K 1 – K 2 + C 1 –C 2 Sell Buy K 1 – S T K 1 < S T < K 2 Sell Buy ST ≥ K 2
Maximum loss = K 1 - K 2 + C 1 - C 2 Maximum profit = C 1 - C 2 Break - even ---> range = K 1 < ST < K 2 set profit = 0 K 1 - S T + C 1 - C 2 = 0 ST = K 1 + C 1 - C 2 There is a risk of early exercise. The short call can be sufficiently ITM for long position to early exercise, while the long call is still OTM. Even if the long call is ITM , the cash flow from early exercise will be negative. Early exercise ensures that the bear spreader will incur a cash outflow. Because that loss occurs prior to expiration , it is greater in present value term than if it had occurred at expiration.
Problem 12. 10 Put 1 , K 1 = 30 , p 1 = 4 Put 2 , K 2 = 35 , p 2 = 7 create a) bull spread b) bear spread
Problem 12. 10 put 1 , K 1 = 30 , P 1 = 4 put 2 , K 2 = 35 , P 2 = 7 create a) bull spread b) bear spread a) bull spread : Long put 1 , short put 2 Short put, K 2 P 2 = 7 3 Bull spread 30 35 ST -2 P 1 = -4 K 1 BE K 2 Long put, K 1 Break-even = K 2 + P 1 – P 2 = 35 + 4 - 7 = 32
Range Payoff Profit ST ≤ K 1 – K 2 = 30 – 35 K 1 – K 2 – P 1 + P 2 = 30 – 35 - 4 +7 = - 2 ST ≤ 30 K 1 < S T < K 2 =-5 ST – K 2 = ST - 35 ST – K 2 – P 1 +P 2 =ST -35 – 4 +7 = ST - 32 0 - P 1 + P 2 = - 4 +7 = 3 30 < ST < 35 ST ≥ K 2 ST ≥ 35
Problem 12. 10 (cont’) b) bear spread : Short put 1 , long put 2 Profit Short put, K 1 P 1 = 4 2 30 32 35 ST K 1 BE K 2 Bear spread -3 Long put, K 2 P 2 = -7 Break-even = K 2 + P – P 2 = 32
Range Payoff Profit ST ≤ K 1 K 2 – K 1 = 30 – 35 = 5 K 2 – K 1 – P 1 + P 2 = 35 – 30 + 4 - 7 ST ≤ 30 K 1 < S T < K 2 = 2 K 2 – ST = 35 - ST 30 < ST < 35 ST ≥ K 2 ST ≥ 35 K 2 - ST – P 1 +P 2 = 35 - ST + 4 - 7 = 32 - ST 0 P 1 - P 2 = 4 - 7 = - 3
Problem 12. 20 Short put 1 , K 1 = 25 , p 1 = 2. 15 Long put 2 , K 2 = 29, p 2 = 4. 75 What is the initial investment ? What is the total payoff when the stock price St is 23, 28, 33?
Problem 12. 20 • What is the initial investment ? initial investment = receive p 1, pay p 2 = 2. 15 - 4. 75 pay • = 2. 6 What is the total payoff when the stock price St is 23, 28, 33? a) 23 b) 28 K 1 < S T < K 2 payoff = K 2 - ST = 29 - 28 =1 ST < K payoff = K 2 - K 1 = 29 - 25 =4 c) 33 ST > K 2 payoff =0
3. 3 Box spreads - Long call at K 1 Bull spread using calls - Short call at K 2 pay C 1, receive C 2 - Short put at K 1 Bear spread using puts initial investment -C 1 C 2 P 1 - Long put at K 2 receive P 1, pay P 2 K 1< K 2 -P 2 Total -C 1+C 2 +P 1 -P 2
Three ranges 1 ST ≤ K 1 K 2 K 1 < S T < K 2 1 3 ST ≥ K 2 2 3
Range Call 1 (Long) Call 2 (Short) Put 1 (Short) Put 2 (long) Total ST ≤ K 1 not exercised Exercised -C 1 + C 2 + P 1 –P 2 Profit -C 1 -C 2 ST - K 1 + P 1 K 2 - S T - P 2 -K 1+K 2 Payoff 0 0 S T- K 1 K 2 - ST K 2 –K 1 < S T < K 2 Exercised not exercised Exercised -C 1+C 2+P 1 -P 2 Profit ST – K 1 –C 1 C 2 P 2 K 2 - S T - P 2 -K 1+K 2 Payoff S T- K 1 0 K 2 - ST K 2 -K 1 S T≥ K 2 Exercised not exercised profit ST – K 1 – C 1 K 2 - S T + C 1 P 1 -P 2 payoff ST –K 1 K 2 - ST 0 0 -C 1+C 2+P 1 -P 2 -K 1+K 2 K 2+K 1 Payoff and profit same for all cases
3. 3 Box spreads (cont') Pay receive Pay At initiation, we pay = c 1 – c 2 – p 1 + p 2 Maturity At maturity, we receive = K 2 – K 1 K 2 -K 1 C 1 -C 2 -P 1+P 2 (K 2 -K 1)e-rt Discount back (K 2 - K 1)e-rt = C 1 - C 2 -P 1+P 2
(K 2 - K 1)e-rt = C 1 - C 2 –P 1+P 2 Rearrange to make them all positive C 1 + P 2 = (K 2 -K 1)e-rt +C 2 +P 1 Constant if C 1+P 2 > (K 2 -K 1)e-rt +C 2+P 1 we will short C 1 & P 2 arbitrage opportunity short box spread long C 1 & P 1 long T-bill , F = K 2 - K 1 If C 1, +P 2 < (K 2 -K 1) e-rt + C 2 +p 1 we will Short (K 2 - K 1) e-rt (borrow) Short c 2 & p 1 Long c 1 & p 2 long box spread arbitrage opportunity
3. 4 Butterfly Spreads 1. Butterfly spread using calls - Long 1 call at K 1 - Short 2 calls at K 2 - Long 1 call at K 3 K 2= K 1+K 3 2 K 2=K 1+K 3 2 K 1< K 2< K 3 Example - Long 1 call , K 1 = 8 , C 1= 1. 25 - - Shot 2 calls, K 2 = 10, C 2 = 0. 6 + - Long 1 call, K 3 = 12, C 3= 0. 35 initial investment = -1. 25 +(0. 6 x 2)- 0. 35 = - 0. 4
Butterfly Spreads (cont’) 1. Butterfly spread using calls (cont’) ST Value/payoff Call (long) K 1 K 2 K 3 Call 2 x 2 (Short) Profit/loss = total payoff -0. 4 Call 3 (Long) Total 6 0 0 -0. 4 7 0 0 -0. 4 8 0 0 -0. 4 9 1 0 0 1 0. 6 10 2 0 0 2 1. 6 11 3 -1 x 2=-2 0 1 0. 6 12 4 -2 x 2=-4 0 0 -0. 4 13 5 -3 x 2 = -6 1 0 -0. 4 14 6 -4 x 2=-8 2 0 -0. 4 15 7 -5 x 2= -10 3 0 -0. 4 ST ≤ K 1 < S T < K 3 ST ≥ K 3
Butterfly spread using calls (cont’) Long 1 call, K 1 Long 1 call , K 3 2 C 2 = 1. 2 8 -C 3 = -0. 35 2 C 2 – C 1 – C 3 = -0. 4 -C 1 = - 1. 25 K 1 8. 4 10 K 2 11. 6 12 K 3 ST Short 2 calls, K 2 Lower Break – even => ST = K 1+C 1 – 2 C 2 + C 3 = 8+1. 25 -2(0. 6)+0. 35 = 8. 4 Higher Break – even => ST = K 3 – C 1 + 2 C 2 –C 3 = 12 -1. 25+2(0. 6) +0. 35 = 11. 6
Long call : profit & loss = Max(ST-K, 0) -C K 1, C 1 & K 3, C 3 Short call : profit & loss = Min(K-ST, 0) +C K 2, 2 x. C 2 Butterfly spread profit &loss = Max(ST-K 1, 0)-C 1, +Max (ST-K 3, 0)-C 3 +2 Min(K 2 -ST, O)+ 2 C 2 Three ranges K 2 K 1 1. ST ≤ K 1 K 3 2. K 1 < ST < K 2 1 3. K 2 < ST < K 3 2 4. ST ≥ K 3 3 4
Butterfly spread using calls (cont’) Rang Payoff Call (long) Right to buy ST ≤ K 1 < S T ≤ K 2 0 not exercised ST – K 1 Sell Buy K 2 < S T < K 3 ST – K 1 Call 2 x 2 (short) Obligation to sell Profit/loss Call 3 (Long) Total Right to buy 0 not exercised 2(K 2 – ST) = K 1+K 3 -2 ST Total payoff – C 1 + 2 C 2 -C 3 0 0 -C 1 +2 C 2 –C 3 not exercised 0 S T – K 1 not exercised Depend on ST 0 K 3 - ST ST –K 1 –C 1+2 C 2 –C 3 K 3 –ST –C 1+2 C 2 –C 3 not exercised Sell Buy ST ≥ K 3 ST – K 1 2(K 2 -ST) = K 1+K 3 -2 ST ST-K 3 Sell Buy 0 -C 1+2 C 2 -C 3
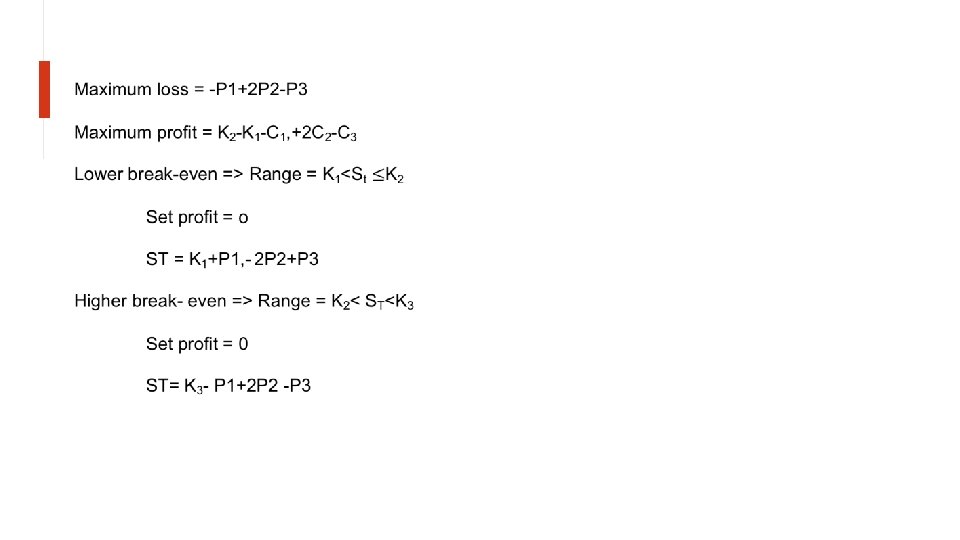
Maximum loss = -C + 2 C 2 –C 3 Maximum profit = K 2 – K 1 –C 1+ 2 C 2 –C 3 Lower Bread-even => Range = K 1 < ST ≤ K 2 Set profit = 0 ST = K 1+ C 1 -2 C 2 + C 3 Higher Break-even => Range = K 2 < ST < K 3 Set profit = 0 ST = K 3 –C 1 + 2 C 2 – C 3
Problem 12. 4 butterfly spread. K C Call 1 15 4 Call 2 17. 5 2 Call 3 20 0. 5 Long 1 call 1, short 2 call, Long 1 call 3 Initial investment = -4 + 2(2) -0. 5 = -0. 5
Construct table to show payoff Range Payoff Profit = payoff -0. 5 ST ≤ K 1 0 -0. 5 K 1 < S T ≤ K 2 ST – K 1 = ST – 15. 5 K 2 < ST <K 3 – ST = 20 – ST 19. 5 -ST ST ≥ K 3 0 -0. 5
Butterfly spread using puts -Long 1 put at K 1 -Shot 2 puts at K 2 -Long 1 put at K 3 K 2 = K 1+K 3 , 2 K 2 = K 1+K 3 2 K 1 < K 2 < K 3 Example -Long 1 put, K 1= 55, P 1 = 3 – -Short 2 puts, K 2= 60, P 2=5 + -Long 1 put, K 3 = 65, P 3 =8 – initial investment = -P 1+2 P 2 =-3 + 2(5) +8 =-1
Butterfly spread using puts (cont’) ST K 1 K 2 K 3 51 53 55 57 60 63 65 67 69. . . Payoff Put 1 (Long) Put 2 (Short) Put 3 (Long) Total Profit/loss =payoff -1 4 2 0 0 0 0. . . -9 x 2 = -18 -7 x 2 = -14 -5 x 2 = -10 -3 x 2 = -6 0 0 0 14 12 10 8 5 2 0 0 0 2 5 2 0 0 0 -1 -1 -1 1 4 1 -1 -1 -1
Butterfly spread using puts (cont’) Short 2 puts, K 2 2 P 2 = 10 2 P 2 – P 1 – P 3 = -1 55 60 65 K 1 K 2 K 3 ST -P 1 = - 3 Long 1 put, K 1 Long 1 put , K 3 -P 3 = -8 Lower Break – even => K 1+P 1 – 2 P 2 + P 3 = 55+3 -10+8 = 56 Higher Break – even => K 3 – P 1 + 2 P 2 –P 3 = 65 -3+10 -8 = 64
Long put : profit & loss = Max(K-ST, 0)-P K 1 P 1 & K 3 , P 3 Short put : profit & loss = Min (ST-K 1, 0) +P K 2, P 2 Butlery spread : profit & loss = Max(K 1, -ST, 0) - P 1 +Max (K 3 -ST, 0)-P 3 + 2 Min(ST-K 2, 0)+P 2 Four ranges K 2 K 1 1. ST ≤ K 1 K 3 2. K 1 < ST ≤ K 2 1 3. K 2 < ST < K 3 2 4. ST ≥ K 3 3 4
Butterfly spread using puts (cont’) Range Put 1 (Long) 2 x Put 2 (Short) Put 3 (Long) Total Profit/loss =Total payoff –P 1+2 P 2 -P 3 ST ≤ K 1 – S T 2(ST –K 2) K 3 – S T 0 -P 1 + 2 P 2 – P 3 K 1<ST≤ K 2 0 2(ST-K 2) K 3 - S T ST – K 1 –P 1 +2 P 2 – P 3 K 2 < ST<K 3 ST ≥ K 3 Payoff 0 0 =2 ST-K 1 -K 3 =2 ST –K 1 -K 2 0 K 3 - S T 0 0 K 3 – S T 0 K 3 – ST – P 1 + 2 P 2 – P 3 -P 1+ 2 P 2 – P 3
Problem 12. 22 Same numbers with the example. Construct the table of payoff and profit Range Payoff Profit ST ≤ K 1 0 -1 K 1 < S T ≤ K 2 65 - ST 64 –ST K 2 <ST <K 3 ST -55 ST – 56 ST ≥ K 3 0 -1
3. 5 Calendar Spreads • Same K Same intrinsic value • Different T • Same type of option • Different position (long & short) 1. Calendar spread using calls - Short 1 call , T 1 - Long 1 call, T 2 T 1 ˂ T 2 Usually C 1 ˂ C 2 So, negative initial cash flow
K ST
• It is not possible to hold both option until expiration. • Longest possible holding period = until the shorter –maturity option’s expiration. • The investor obtains the greatest profit if the stock has low volatility and trades within a narrow range. • If the stock price moves substantially, the investor will likely incur a loss.
3. 5 Calendar Spreads (cont’) Calendar spreads using puts - Short 1 put , T 1 - Long 1 put , T 2 T 1˂ T 2 more time value Profit K ST
Reverse calendar spreads Using calls Using puts - Long 1 call , T 1 - Long 1 put, T 1 - Short 1 call , T 2 - Short 1 put, T 2 Profit K ST Expect the stock price to move into the extremes
3. 6 Diagonal spreads • Different T • Different K • Same type of option • Different position Example Long call at K 1, T 2 higher premium Short call at K 2, T 1 lower premium K 1 ˂ K 2 T 1 ˂ T 2
4. Combinations • Involves taking a position in both calls and puts on the same stock. 4. 1 Straddles 4. 2 Strips 4. 3 Straps 4. 4 Strangles
4. 1 Straddle • Same K • Same T • Same position • Different type of option (call+put) Straddle Long straddle (Bottom straddle or straddle purchase) Short straddle (Top straddle or straddle write) - Long 1 call - Short 1 call - Long 1 put - Short 1 put
Example • Call , K = 60 , C = 6 • Put , K = 60 , P = 4 Long 1 call & long 1 put long straddle Initial investment = - 6 - 4 = - 10
4. 1 Straddle (cont’) Long straddle = long call + long put ST Pay off Long call 30 35 40 45 50 55 60 65 70 75 80 85 90 0 0 0 5 10 15 20 25 30 Long put 30 25 20 15 10 5 0 0 0 0 Profit/loss = total payoff - 10 total 30 25 20 15 10 15 20 25 30 20 15 10 5 0 -5 -10 -5 0 5 10 15 20
4. 1 Straddle (cont’) : long Straddle Profit Long call Long straddle -P=-4 50 60 BE. K. -C=-6 - C + - P = -10 Lower break-even Higher Break – even 70 BE ST Long put =K–C–P = 60 – 6 -4 = 50 = K+C+P = 60+6+4 = 70
Long call : profit & loss = Max (ST- K, 0) – C Long put : profit & loss = Max (K – ST , 0) – P Long straddle : profit & loss = Max (ST- K , 0) – C+ Max (K- ST , 0) - P Call Put ST ≤ K not exercised ST ˃ K exercised not exercised
4. 1 Straddle (cont’) : Long straddle Stock Pay off Profit/loss =total payoff – C -P Long call Long Put total ST ≤ K 0 K – ST – C – P ST ˃K ST – K 0 ST – K ST - K – C – P Maximum loss = - C –P Maximum profit = unlimit
Lower Break – even range = ST ≤ K Set profit = 0 ST = K – C – P Higher Break – even range = ST ˃ K Set profit = 0 ST = K + C + P A straddle is on appropriate strategy for situations in which one suspects that the stock price will move substantially but does not know in which direction it will go.
4. 1 Straddle (cont’) Short straddle Example Short 1 call, K = 60, C = 6 Short 1 put , M = 60 , P = 4 Net can flow at initiation = 6+4 =10
ST Pay off Short call Short Put Total Profit/loss = total payoff + 10 40 0 -20 -10 45 0 -15 -5 50 0 -10 0 55 0 -5 -5 5 60 0 10 65 -5 -5 -5 5 70 -10 -10 0 75 -15 -15 -5 80 -20 -20 -10
Short straddle (cont’) C + P = 10 C=6 P=4 50 60 70 BE K BE Short put Short straddle Lower Break – even Higher Break – even =K-C–P = 60 – 6 – 4 = 50 =K+C+P = 60 + 6 + 4 = 70
Short call : profit & loss = Min(K – ST, O) + C Short put : profit & loss = Min (ST – K , O) + P Short straddle : profit & loss = Min (K-ST, O) +C + Min (ST- K , O) + P call Put ST ≤ K not exercised Exercised ST > K Exercised not exercised
Short straddle (cont’) Stock price Payoff Short call Short Put Total Profit & loss = Total payoff + C+P ST ≤ K 0 ST – K + C + P ST > K K- ST 0 K- ST K – ST + C + P Maximum loss = unlimit Maximum profit = C + P
Lower break-even => range = ST ≤ K Set profit = 0 ST = K – C – P Higher break-even => ST > K Set profit = 0 ST = K + C + P • An investor who use short straddle expects the market to stay within a narrow trading rang. • A short straddle is a high-risk strategy because of the potential for large losses if the stock price moved substantially , particularly upward • Butterfly spread is safer < limit loss >, but also lower profit.
4. 2 Strips • When we use straddle, it means that the probability that stock price will go up equals to the probability it will go down. • However, if we think bear market is more likely to be (more puts), we can use strips.
4. 2 Strips Long call Profit Strip BE K-c/2 -p K BE ST K+c+2 p -c -2 p Long 2 puts
4. 2 Strips • Initial investment = -c-2 p • Long 1 call : profit & loss = Max( ST –K, 0) –c • Long 2 puts : profit & loss = 2 Max(K-ST, 0)– 2 p • Strip : Profit & loss = Max( ST –K, 0) –c + 2 Max(K-ST, 0)– 2 p
Strips Payoff Stock Price Payoff Long call 0 ST ≤ K S T > K ST - K Long put x 2 2(K 0 ST ) Profit/Loss = payoff-c-2 p Total 2(K- ST ) ST - K 2 K-2 ST –c-2 p ST – K-c-2 p
4. 2 Strips • Lower break-even -> range = ST ≤ K Set profit = 0 2 K-2 ST –c-2 p = 0 2 ST = 2 K-c-2 p • Higher break-even -> range = ST > K set profit = 0 ST – K-c-2 p = 0 ST = K + c+ 2 p
4. 3 Straps Use straps when bull market is more likely to be (more calls) Long 2 calls Profit Strap BE K-2 c -p -p -2 c - p-2 c ST K BE K+c+p/2 Long 1 put
4. 3 Straps • Initial investment = -2 c-p • Long 2 calls : profit & loss = 2 Max(ST – K, 0)-2 c • Long 1 put : profit & loss = Max(K-ST, 0) –p • Strap: profit & loss = 2 Max(ST – K, 0)-2 c+Max(ST – K, 0)-p
Strap Payoff Stock Price Payoff Long call x 2 0 ST ≤ K ST > K 2(ST – K) Long put K 0 ST Total K- ST 2(ST – K) Profit/Loss = payoff-c-2 p K-ST – 2 c-p 2 ST – 2 K-2 c-p
4. 3 Straps • Lower break-even -> range = ST ≤ K Set profit = 0 K-ST – 2 c-p = 0 ST = K – 2 c- p • Higher break-even -> range = ST > K set profit = 0 2 ST – 2 K-2 c-p = 0 2 ST = 2 K+2 c+p = 0
4. 4 Strangles • A strangle is similar to a straddle Strangle 1. Use when we predict a volatile price but not sure which direction 2. Long position pays premium at initiation 3. Short position receives premium at initiation 4. Long 1 call + Long 1 put 5. Same K 5. Different K 6. ATM options 6. OTM options
4. 4 Strangles • Straddle use ATM options • How to make the strategy’s cost cheaper but still get profit when the price is volatile? • => OTM options are cheaper than ATM options. • However, if we want to long 1 OTM put. And long 1 OTM call. • (These two options have different K) • long 1 OTM put => S 0 < K 2 • long 1 OTM call => S 0 > K 1 • K 2 K 1. => Different K because it is impossible for S 0 to be greater and less than K at the same time, so different K. • C 2 < c , P 1 < P where C 2 and P 1 are strangle, c and p are for straddle
4. 4 Strangles • Strangle -> lower initial investment and lower profit more gentle slope than straddle • Example • Call, K 2 = 50, c 2 = 2 • Put, K 1 = 45, p 1 = 3 • Long 1 call at K 2, Long 1 put at K 1 ; K 1 < K 2 • Initial investment = -2 -3= -5
ST Long call Long put Total Profit/loss = total payoff -5 35 0 10 10 5 40 0 5 5 0 45 0 0 0 -5 50 0 -5 55 5 0 60 10 5 . . . Payoff
4. 4 Strangles Profit Long call Long strangle 40 BE 45 K 1 50 K 2 55 BE ST -2 -3 -5 Long put
4. 4 Strangles • Lower break-even = K 1 –c 2 –p 1 = 45 -2 -3 = 40 • Higher break-even = K 2 +c 2+p 1 = 50+2+3 = 55 • Long call: profit & loss = Max(ST – K 2 , 0 ) –c 2 • Long put: profit & loss = Max(K 1 -ST , 0) –p 1 • Long strangle: profit & loss = Max(ST – K 2 , 0 ) –c 2 + Max(K 1 -ST , 0) –p 1
ST Payoff Profit/loss = total payoffc 2 – p 1 Long call Long put Total ST ≤ K 1 0 K 1 - S T – c 2 – p 1 K 1 < S T < K 2 0 0 0 -c 2 - p 1 ST - K 2 0 ST - K 2 – c 2 –p 1
4. 4 Strangles (cont’) Maximum loss = - C 2 – P 1 Maximum profit = unlimit Lower break-even => Rang = ST ≤ K 1 Set profit = 0 K 1 – ST – C 2 – P 1 = 0 ST = K 1 – C 2 - P 1 Higher break-even => Range = ST ≥ K 2 Set profit = 0 ST – K 2 – C 2 – P 1 = 0 ST = K 2 + C 2 + P 1
Problem 12. 7 Same numbers with the example Stock price Profit ST ≤ 45 40 – ST 45 < ST < 50 -5 ST ≥ 20 ST – 45
Problem 12. 21 Short strangle - Short call, K 2 = 50, C 2 = 3 - Short put, K 1 = 40, P 1 = 4 Initial investment receive = C 2+P 1 = 3+4 =7 Lower breakeven = K 1 – C 2 – P 1 = 40 -3 -4 = 33 Higher breakeven = K 2+C 2+P 1 = 50+3+4 = 57
Problem 12. 21 (cont’) Profit P 1+C 2 = 7 P 1 = 4 C 2 = 3 Short put 33 BE 40 K 1 50 K 2 57 BE ST Short strangle Short call Makes a profit when the price (ST) is between 33 and 57
Stock Payoff Short call Short put Total Profit/loss = payoff + C 2 + P 1 ST ≤ 40 0 ST – K 1 + C 2 + P 1 40 < ST < 50 0 C 2 + P 1 ST ≥ 50 K 2 – S T 0 K 2 - S T K 2 – ST + C 2 + P 1 Makes a profit when total payoff is less than 7