Association Mapping Lon Cardon University of Oxford Outline


, sib-pairs/extended")
 Biometrical basis Variance model (linkage)")


 positional cloning of a complex disease QTL !")


 contribute to inherited differences in common disease Given")


 Genome-wide screen or candidate gene Genome-wide screen Candidate gene")
 What constitutes a replication? GOLD Standard for association studies")

 Do we have the best set of genetic markers")
 Do we have the best set of genetic markers")

 Integrating the sampling, LD and genetic effects Questions that")

 by MAF and LD in 1000")
 by MAF and LD in 5000")

 How to analyse the data • Allele based test?")
 Multiple Testing • Candidate genes: a few tests (probably")


")


- Slides: 83
Association Mapping Lon Cardon University of Oxford
Outline 1. 2. 3. 4. 5. Association and linkage disequilibrium History and track record of association studies Challenges Example
Outline 1. 2. 3. 4. 5. Association and linkage disequilibrium History and track record Challenges Example
Association Studies Simplest design possible Correlate phenotype with genotype Candidate genes for specific diseases common practice in medicine/genetics Pharmacogenetics genotyping clinically relevant samples (toxicity vs efficacy) Positional cloning recent popular design for human complex traits Genome-wide association with millions available SNPs, can search whole genome exhaustively
Definitions SNPs trait variant chromosome Population Data haplotypes Affection Trait 1…Traitn A 10. 3 75. 66 A 9. 9 -99 U 15. 8 101. 22 genotypes alleles
Allelic Association SNPs trait variant chromosome Genetic variation yields phenotypic variation More copies of ‘B’ allele More copies of ‘b’ allele
Biometrical Model 2 a d midpoint bb Bb Genotype Genetic Value BB Bb bb a d -a Va (QTL) = 2 pqa 2 (no dominance) BB
Simplest Regression Model of Association Yi = a + b. Xi + ei where Yi = Xi = trait value for individual i 1 if allele individual i has allele ‘A’ 0 otherwise i. e. , test of mean differences between ‘A’ and ‘not-A’ individuals
Association Study Designs and Statistical Methods • Designs – Family-based • Trio (TDT), sib-pairs/extended families (QTDT) – Case-control • Collections of individuals with disease, matched with sample w/o disease • Some ‘case only’ designs • Statistical Methods – Wide range: from t-test to evolutionary model-based MCMC – Principle always same: correlate phenotypic and genotypic variability
Linear Model of Association (Fulker et al, AJHG, 1999) Biometrical basis Variance model (linkage) pijk = proportion of alleles shared ibd at marker s 2 a = additive genetic variance parameter s 2 g = polygenic (residual) variance parameter s 2 e = environmental (residual) variance parameter Linear model (association) Likelihood
Linkage: Allelic association WITHIN FAMILIES affected 3/5 2/6 unaffected 3/2 5/2 Allele coded by CA copies 2 = CACA 6 = CACACA 4/3 Disease linked to ‘ 5’ allele in dominant inheritance 3/5 3/2 4/5
Allelic Association: Extension of linkage to the population 3/5 3/6 2/6 5/6 3/5 3/2 2/6 5/2 Both families are ‘linked’ with the marker, but a different allele is involved
Allelic Association Extension of linkage to the population 3/5 3/6 2/6 5/6 3/2 2/4 6/2 4/6 6/6 All families are ‘linked’ with the marker Allele 6 is ‘associated’ with disease 2/6 6/6
Allelic Association Controls Cases 6/6 6/2 3/5 3/4 3/6 2/4 3/2 5/6 3/6 4/6 6/6 2/6 5/2 Allele 6 is ‘associated’ with disease 2/6
Power of Linkage vs Association • Association generally has greater power than linkage – Linkage based on variances/covariances – Association based on means – See lectures by Ben Neale (linkage power), Shaun Purcell (assoc power)
First (unequivocal) positional cloning of a complex disease QTL !
Inflammatory Bowel Disease Genome Screen Satsangi et al, Nat Genet 1996
Inflammatory Bowel Disease Genome Screen
NOD 2 Association Results Stronger than Linkage Evidence • Analysis strategy: same families, same individuals as linkage, but now know mutations. Were the effects there all along? • TDT • Case-control Genotype Rel Risk = 58. 9, p < 10 -8 Same CD cases vs 229 controls
Localization • Linkage analysis yields broad chromosome regions harbouring many genes – Resolution comes from recombination events (meioses) in families assessed – ‘Good’ in terms of needing few markers, ‘poor’ in terms of finding specific variants involved • Association analysis yields fine-scale resolution of genetic variants – Resolution comes from ancestral recombination events – ‘Good’ in terms of finding specific variants, ‘poor’ in terms of needing many markers
Linkage Resolution Chavanas et al. , Am J Hum Genet, 66: 914 -921, 2000
Linkage vs Association Linkage Association 1. Family-based 1. Families or unrelateds 2. Matching/ethnicity generally unimportant Few markers for genome coverage (300 -400 STRs) Can be weak design 2. Matching/ethnicity crucial 3. Many markers req for genome coverage (105 – 106 SNPs) Powerful design Good for initial detection; poor fine-mapping Powerful for rare variants 5. 3. 4. 5. 6. 4. 6. Poor for initial detection; good for fine-mapping Powerful for common variants; rare variants generally impossible
Outline 1. 2. 3. 4. 5. Association and linkage disequilibrium History and track record Challenges Example
Allelic Association Three Common Forms • Direct Association • Mutant or ‘susceptible’ polymorphism • Allele of interest is itself involved in phenotype • Indirect Association • Allele itself is not involved, but a nearby correlated marker changes phenotype • Spurious association • Apparent association not related to genetic aetiology (most common outcome…)
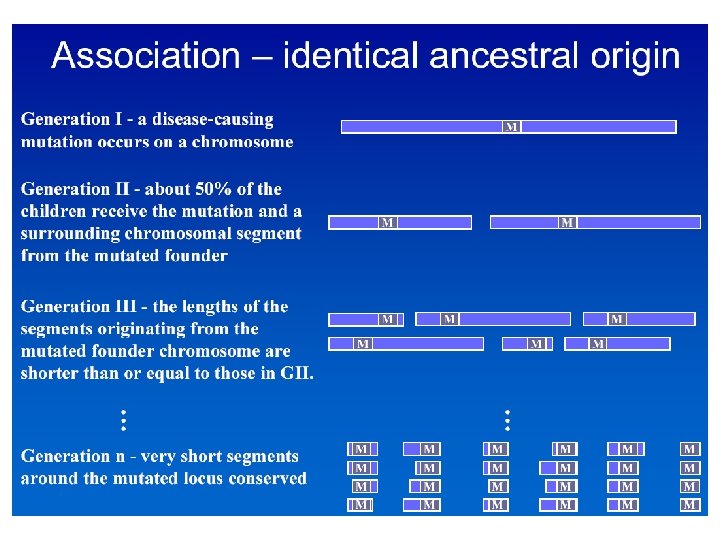
Indirect and Direct Allelic Association Direct Association D Indirect Association & LD M 1 M 2 D Mn * Measure disease relevance (*) directly, ignoring correlated markers nearby Assess trait effects on D via correlated markers (Mi) rather than susceptibility/etiologic variants. Semantic distinction between Linkage Disequilibrium: correlation between (any) markers in population Allelic Association: correlation between marker allele and trait
How far apart can markers be to detect association? Expected decay of linkage disequilibrium Dt = (1 – q)t. D 0
Decay of Linkage Disequilibrium Reich et al. , Nature 2001
Variability in Pairwise LD on Chromosome 22
Variability in LD overwhelms the mean: D’
Average Levels of LD along chromosomes CEPH W. Eur Estonian Chr 22 Dawson et al Nature 2002
Characterizing Patterns of Linkage Disequilibrium Average LD decay vs physical distance Mean trends along chromosomes Haplotype Blocks
Linkage Disequilibrium Maps & Allelic Association Marker 1 2 3 D n LD Primary Aim of LD maps: Use relationships amongst background markers (M 1, M 2, M 3, …Mn) to learn something about D for association studies Something = * Efficient association study design by reduced genotyping * Predict approx location (fine-map) disease loci * Assess complexity of local regions * Attempt to quantify/predict underlying (unobserved) patterns ···
LD Patterns and Allelic Association Type 1 diabetes and Insulin VNTR Alzheimers and Apo. E 4 Bennett & Todd, Ann Rev Genet, 1996 Roses, Nature 2000
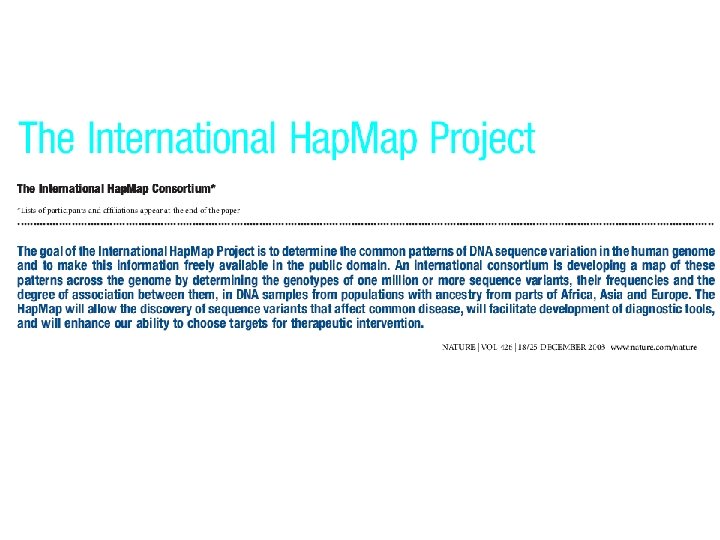
Building Haplotype Maps for Gene-finding 1. Human Genome Project Good for consensus, not good for individual differences Sept 01 Feb 02 April 04 2. Identify genetic variants Anonymous with respect to traits. April 1999 – Dec 01 3. Assay genetic variants Verify polymorphisms, catalogue correlations amongst sites Anonymous with respect to traits Oct 2002 - present Oct 04
Hap. Map Strategy • Samples – Four populations, small samples • Genotyping – 5 kb initial density across genome (600 K markers) – Subsequent focus on low LD regions – Recent NIH RFA for deeper coverage David Evans to discuss further
Hapmap validating millions of SNPs. Are they the right SNPs? Distribution of allele frequencies in public markers is biased toward common alleles Expected frequency in population Frequency of public markers Phillips et al. Nat Genet 2003
Common-Disease Common-Variant Hypothesis Common genes (alleles) contribute to inherited differences in common disease Given recent human expansion, most variation is due to old mutations that have since become common rather than newer rare mutations. Highly contentious debate in complex trait field
Common-Disease/Common-Variant For Against Wright & Hastie, Genome Biol 2001
Taken from Joel Hirschorn presentation, www. chip. org If this scenario, association studies will not work If this scenario, properly designed association studies can work
Deliverables: Sets of haplotype tagging SNPs
Haplotype Tagging for Efficient Genotyping Cardon & Abecasis, TIG 2003 • Some genetic variants within haplotype blocks give redundant information • A subset of variants, ‘ht. SNPs’, can be used to ‘tag’ the conserved haplotypes with little loss of information (Johnson et al. , Nat Genet, 2001) • … Initial detection of ht. SNPs should facilitate future genetic association studies
Summary of Role of Linkage Disequilibrium on Association Studies • Marker characterization is becoming extensive and genotyping throughput is high • Tagging studies will yield panels for immediate use – Need to be clear about assumptions/aims of each panel • Density of eventual Hapmap probably cover much of genome in high LD, but not all Challenges • Just having more markers doesn’t mean that success rate will improve • Expectations of association success via LD are too high. Hyperbole! • Need to show that this information can work in trait context
Outline 1. 2. 3. 4. 5. Association and linkage disequilibrium History and track record Challenges Example
Association Studies: Track Record • Pubmed: Mar 2005. “Genetic association” gives 20, 096 hits • Q: How many are real? • A: < 1% – Claims of “replicated genetic association” 183 hits (0. 9%) – Claims of “validated genetic association” 80 hits (0. 3%)
Association Study Outcomes Reported p-values from association studies in Am J Med Genet or Psychiatric Genet 1997 Terwilliger & Weiss, Curr Opin Biotech, 9: 578 -594, 1998
Why limited success with association studies? 1. Small sample sizes results overinterpreted 2. Phenotypes are complex and not measured well. Candidate genes thus difficult to choose 3. Allelic/genotypic contributions are complex. Even true associations difficult to see. 4. Population stratification has led clouded true/false positives
Influence of. Sample size association reporting Sizeon. Matters PPARg and NIDDM ACE and MI Altshuler et al Nat Genet 2000 Keavney et al Lancet 2000
Phenotypes are Complex Weiss & Terwilliger, Nat Genet, 2000
Many Forms of Heterogeneity Terwilliger & Weiss, Curr Opin Biotechnol, 1998
Main Blame Why do association studies have such a spotted history in human genetics? Blame: Population stratification Analysis of mixed samples having different allele frequencies is a primary concern in human genetics, as it leads to false evidence for allelic association.
Population Stratification • Leads to spurious association • Requirements: – Group differences in allele frequencies AND – Group differences in outcome • In epidemiology, this is a classic matching problem, with genetics as a confounding variable Most oft-cited reason for lack of association replication
Population Stratification + c 21 = 14. 84, p < 0. 001 Spurious Association
Population Stratification: Real Example Reviewed in Cardon & Palmer, Lancet 2003
‘Control’ Samples in Human Genetics < 2000 • Because of fear of stratification, complex trait genetics turned away from case/control studies - fear may be unfounded • Moved toward family-based controls (flavour is TDT: transmission/disequilibrium test) “Case” 1/2 3/4 “Control” 1/3 = transmitted alleles = 1 and 3 = untransmitted alleles = 2 and 4
TDT Advantages/Disadvantages Advantages Robust to stratification Genotyping error detectable via Mendelian inconsistencies Estimates of haplotypes possible Disadvantages Detection/elimination of genotyping errors causes bias (Gordon et al. , 2001) Uses only heterozygous parents Inefficient for genotyping 3 individuals yield 2 founders: 1/3 information not used Can be difficult/impossible to collect Late-onset disorders, psychiatric conditions, pharmacogenetic applications
Association studies < 2000: TDT • TDT virtually ubiquitous over past decade Grant, manuscript referees & editors mandated design • View of case/control association studies greatly diminished due to perceived role of stratification Association Studies 2000+ : Return to population • Case/controls, using extra genotyping • +families, when available
Detecting and Controlling for Population Stratification with Genetic Markers Idea • Take advantage of availability of large N genetic markers • Use case/control design • Genotype genetic markers across genome (Number depends on different factors) • Look if any evidence for background population substructure exists and account for it • Shaun Purcell to describe in ‘Genomic Control’ lecture
Outline 1. 2. 3. 4. 5. Association and linkage disequilibrium History and track record Challenges Example
Current Association Study Challenges 1) Genome-wide screen or candidate gene Genome-wide screen Candidate gene • Hypothesis-free • High-cost: large genotyping requirements • Multiple-testing issues • Hypothesis-driven • Low-cost: small genotyping requirements • Multiple-testing less important – Possible many false positives, fewer misses – Possible many misses, fewer false positives
Current Association Study Challenges 2) What constitutes a replication? GOLD Standard for association studies Replicating association results in different laboratories is often seen as most compelling piece of evidence for ‘true’ finding But…. in any sample, we measure Multiple traits Multiple genes Multiple markers in genes and we analyse all this using multiple statistical tests What is a true replication?
What is a true replication? Replication Outcome • Association to same trait, but different gene • Association to same trait, same gene, different SNPs (or haplotypes) • Association to same trait, same gene, same SNP – but in opposite direction (protective disease) • Association to different, but correlated phenotype(s) • No association at all Explanation • Genetic heterogeneity • Allelic heterogeneity/popln differences • Phenotypic heterogeneity • Sample size too small
Current Association Study Challenges 3) Do we have the best set of genetic markers There exist 6 million putative SNPs in the public domain. Are they the right markers? Allele frequency distribution is biased toward common alleles Expected frequency in population Frequency of public markers
Current Association Study Challenges 3) Do we have the best set of genetic markers Tabor et al, Nat Rev Genet 2003
Greatest power comes from markers that match allele freq with trait loci ls = 1. 5, a = 5 x 10 -8, Spielman TDT (Müller-Myhsok and Abel, 1997)
Current Association Study Challenges 4) Integrating the sampling, LD and genetic effects Questions that don’t stand alone: How much LD is needed to detect complex disease genes? What effect size is big enough to be detected? How common (rare) must a disease variant(s) be to be identifiable? What marker allele frequency threshold should be used to find complex disease genes?
Complexity of System • In any indirect association study, we measure marker alleles that are correlated with trait variants… We do not measure the trait variants themselves • But, for study design and power, we concern ourselves with frequencies and effect sizes at the trait locus…. This can only lead to underpowered studies and inflated expectations • We should concern ourselves with the apparent effect size at the marker, which results from 1) difference in frequency of marker and trait alleles 2) LD between the marker and trait loci 3) effect size of trait allele
Decay in power to detect effect (α=0. 001) by MAF and LD in 1000 cases + 1000 controls - Crohn’s & NOD 2 (DAF = 0. 06) - MAF: MAF=DAF
Decay in power to detect effect (α=0. 001) by MAF and LD in 5000 cases + 5000 controls - Type II Diabetes & PPARG (DAF = 0. 85) - MAF: MAF=DAF
Practical Implications of Allele Frequencies • ‘Strongest argument for using common markers is not CD-CV. It is practical: For small effects, common markers are the only ones for which sufficient sample sizes can be collected There are situations where indirect association analysis will not work – Discrepant marker/disease freqs, low LD, heterogeneity, … – Linkage approach may be only genetics approach in these cases At present, no way to know when association will/will not work – Balance with linkage
Current Association Study Challenges 5) How to analyse the data • Allele based test? – 2 alleles 1 df • E(Y) = a + b. X X = 0/1 for presence/absence • Genotype-based test? – 3 genotypes 2 df • E(Y) = a + b 1 A+ b 2 D A = 0/1 additive (hom); W = 0/1 dom (het) • Haplotype-based test? – For M markers, 2 M possible haplotypes 2 M -1 df • E(Y) = a + b. H H coded for haplotype effects • Multilocus test? – Epistasis, G x E interactions, many possibilities
Current Association Study Challenges 6) Multiple Testing • Candidate genes: a few tests (probably correlated) • Linkage regions: 100’s – 1000’s tests (some correlated) • Whole genome association: 100, 000 s – 1, 000 s tests (many correlated) • What to do? – Bonferroni (conservative) – False discovery rate? – Permutations? …. Area of active research
Despite challenges: upcoming association studies hold some promise • Large, epidemiological-sized samples emerging – ISIS, Biobank UK, Million Women’s Study, … • Availability of millions of genetic markers – Genotyping costs decreasing rapidly • Cost per SNP: 2001 ($0. 25) 2003 ($0. 10) 2004 ($0. 01) • Background LD patterns being characterized – International Hap. Map and other projects Realistic expectations and better design should yield success
• Examined expression levels of ~8000 genes on CEPH families – Used expression levels as ‘phenotypes’ – Linked expression phenotypes with CEPH microsatellites • Found evidence for linkage for many phenotypes • Follow-up SNP genotyping also showed some association • Found many cis- linkages (linkage region overlaps location of gene whose expression is phenotype), but also many trans
Genome-wide Association • Most of the CEPH families phenotyped by Cheung are also being genotyped by Hap. Map • Can integrate all genotypes for the 1 million current Hap. Map SNPs with Cheung expression phenotypes – Estimate heritabilities, examine 100 most heritable expression traits – Genome-wide linkage analysis (+4500 STRs) – Genome-wide association analysis (1 million SNPs)
No Linkage No Association Linkage genome scan 4, 000 highly polymorphic markers Association genome scan 1, 000 diallelic markers
+ Linkage No Association
+ Linkage + Association
No Linkage + Association Yes, genome-wide association will work (…sometimes…)
Challenges to come?
Caution with Tagging Here: excluded all SNPs with r 2 = 1 What effect does this exclusion have?
Caution with Inferences Based on Tagging - localization. No r 2 = 1, “tagged” All markers, “untagged” Which ones are ‘true’ loci?