Power to detect QTL Association Lon Cardon Goncalo


 class, Best design includes parental")


- Slides: 25
Power to detect QTL Association Lon Cardon, Goncalo Abecasis University of Oxford Pak Sham, Shaun Purcell Institute of Psychiatry F: lon2001Assocpower
Association Power In principle, power to detect association involves same mechanics as linkage We are interested in significance thresholds 1 -b the probability of rejecting the null when it is false N the number of individuals required to do it
Association Power What are the important variables/parameters? Linkage: • Study design • QTL effect size • recombination fraction Association: • Study design • QTL effect size • Linkage disequilibrium • allele frequencies of marker and QTL
Association Power In general, power is greater for association than for linkage ie. , fewer individuals required, can detect smaller effects (h 2 ~ 5% vs. 20%) But, more markers may be tested, false positives are (or may be) more relevant
Effects of Linkage Disequilibrium • Key question for positional cloning and candidate gene analysis • LD expected to decay (1 - )G • How far does it extend? Debates: 3 kb – 100 kb (Kruglyak : rest of world). Population-specific (depends on ancestral demographics) Genomic region-specific (ie. , depends on sequence features) Marker-specific (ie. , depends on markers considered) Variation dominates data
Extent of Disequilibrium
Pair-wise Disequilibrium
Sensitivity to Disequilibrium Power for =0. 001, h² =. 1, s² =. 3, = 0. Average additive genetic value estimated at the marker .
Influence of Family Size For ‘robust’ tests (TDT, QTDT) class, Best design includes parental genotypes, but they are not mandatory As sibship size increases, missing parental data becomes less important
Effect of Family Structure 350 sib-pair + parents: 1400 genotypes 500 sib-pairs – no parents: 1000 genotypes 260 sib-trios no parents: 780 genotypes
Single Nucleotide Polymorphisms Common disease-common variant hypothesis: Common diseases have been around for a long time. Alleles require a long time to become common (frequent) in the population. Common diseases are influenced by frequent alleles. The SNP Consortium (TSC): • Collection of 10 pharmaceutical companies & Wellcome Trust • Identified > 1 million SNPs across the genome • public databases now have ~ 1. 5 million non-redundant SNPs (relatively few verified) • SNPs detected on basis of common disease common variant hypothesis (caucasian, african american, asian) • …Should be preponderance of common alleles
Extent of Disequilibrium
Effects of Allele Frequency Key question is not just frequency of QTL, but frequency of marker in LD with it More important that marker-QTL allele frequencies are the same than that QTL is common; i. e. , CD-CV hypothesis not as relevant as SNP map
Trios For Genome-Wide Scan ls = 1. 5, = 5 x 10 -8, Spielman TDT (Müller-Myhsok and Abel, 1997)
Effect of Allele Frequencies
Phenotypic Selection • Efficiency gains for genotyping – Well characterized for linkage mapping. . . –. . . Association mapping gaining prominence • Selection tresholds – A priori versus Post hoc • Common variant hypothesis – Effect of allele frequency
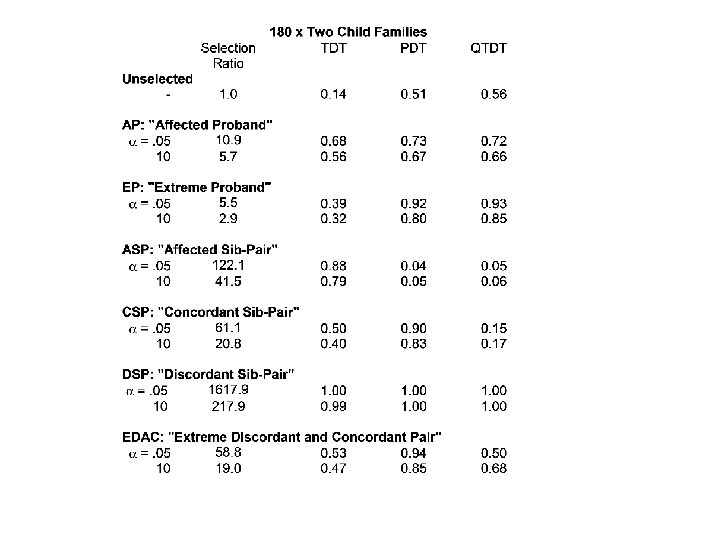
Selection Strategies • Selection based on one tail – Affected Proband, Affected Pairs • Selection from either tail – Extreme Proband – Concordant Pairs – Discordant and Concordant
Selection Tresholds • Hard definition – A priori – Treshold defined before sample collection – Eg, pairs with both sibs in top decile • Adaptable selection – Post hoc – Tresholds defined after sample collection – Eg, subselection from large twin registries
Intensity of a priori selection
Selection of Triads
Post hoc Selection
Effect of Allele Frequencies
Effect of Selection
Summary • Power for association generally greater than linkage • Power greatly influenced by D, selection strategy, allele frequency • Optimal linkage strategies not necessarily best for association • Allele frequency of (unobserved) QTL is important, but more important that marker-QTL match