Relationship between quantitative trait inheritance and genetic markers
")
Relationship between quantitative trait inheritance and genetic markers ( A rationale for QTL mapping) (1) Genes controlling quantitative traits are located in the genome (2) just like simple genetic markers. (2) If markers cover a large proportion of the genome then there is a chance that some genes controlling quantitative traits are linked with the some of these markers. (3) If genes and markers are segregating in a genetically defined population, then the linkage relationship may be resolved by studying the association between trait variation and marker segregation pattern.

Genetic linkage Parental X PP; LL pp; ll Flower color: P, purple p, red F 1 X Pollen size: Pp; Ll L, long l, short F 2 • excess of parental types (and deficit of non-parental types, i. e. , recombinants) reveals genetic linkage phenotype ratios 9 : 3 : 1 240 : 80 : 27 296 : 19 : 27 : 85 expected observed

QTL and Molecular Markers QQ / MM x qq / mm Q Q q q M M m m P 1 P 2 Q q M m F 1

Q q M m x q q m m F 1 P 2 Expectation under free recombination r = 0. 5 Q q q q M m m m 0. 25

Expectation if r = 0. 1 Q q q q M m m m 0. 45 0. 05 0. 45 What is the probabilitiy (likelihood) of observing Qq / Mm under the two models? Likelihood if r = 0. 1 Likelihood if r = 0. 5 = 0. 45 0. 25 Likelihood Ratio

recombination frequency 0. 5 0. 4 0. 3 0. 2 0. 1 0 Qq/Mm 0. 25 . 30 . 35 . 40 . 45 0. 5 Qq/mm 0. 25 . 20 . 15 . 10 . 05 0 qq/Mm 0. 25 . 20 . 15 . 10 . 05 0 qq/mm 0. 25 . 30 . 35 . 40 . 45 0. 5
 Calculate the")
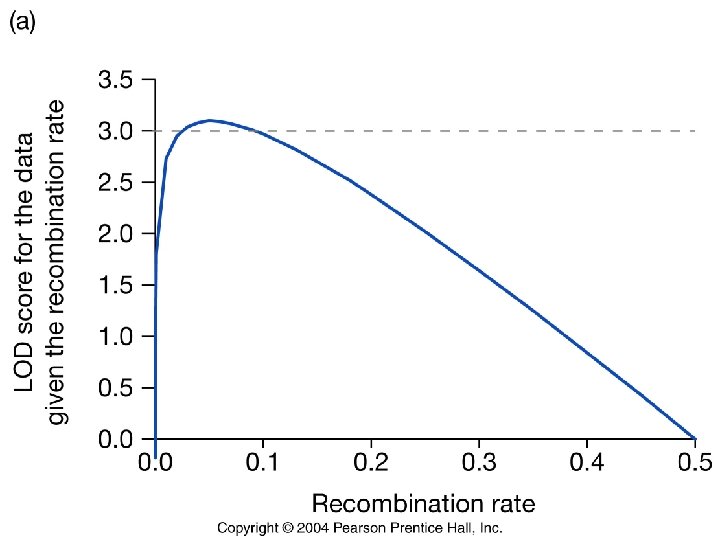
How do we assess the strength of the evidence for linkage? (1) Calculate the likelihood ratio for each individual of the cross, under a particular model of recombination. (denominator is null hypothesis that r = 0. 5) (2) Take the logarithm of this odds ratio. This gives LOD. (3) Sum all LODs to obtain the overall likelihood of the data. For example: If we examined 20 individuals with the following genotypes: Qq/Mm = 10 Qq/mm = 1 qq/Mm = 1 qq/mm = 8 LOD (r=0. 1). 26 -. 7. 26 N x 10 = 2. 6 x 1 = -. 7 x 8 = 2. 1 Overall LOD 3. 3
 r A (marker) Q (putative QTL) Interval Mapping (Lander")
Single Marker Method (Sax 1923) r A (marker) Q (putative QTL) Interval Mapping (Lander and Botstein, 1986, 1989) r A (marker) r 1 r 2 Q (putative QTL) B (marker)

Interval Mapping allows Independent Estimates of Location and Effect

QTL affecting tomato size or shape

How Many Genetic Differences Underlie Evolutionarily Important Traits?

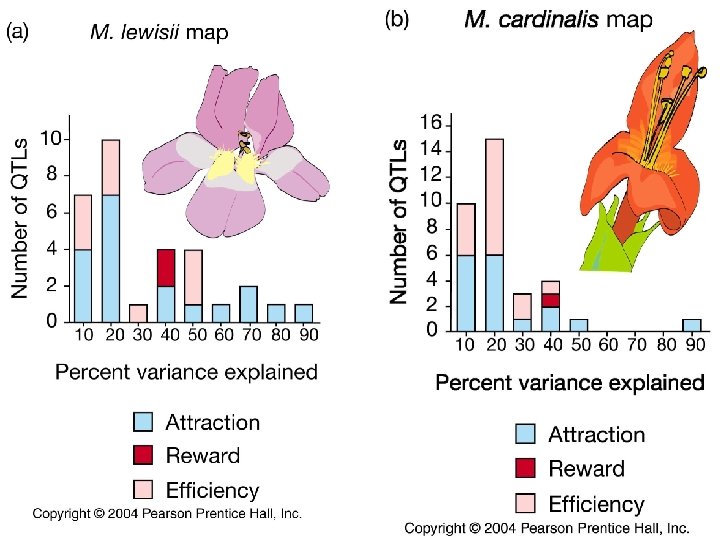
M. cardinalis M. lewisii Genetics of Speciation: QTL mapping of Mimulus

Parentals F 1’s QTL Mapping Test for correlations between flower characters and genetic markers

QTL Mapping: Detecting Associations between genotype and phenotype
 Bees preferred large flowers with moderate or low amounts of")
Schemske and Bradshaw (1999) Bees preferred large flowers with moderate or low amounts of yellow pigment. Hummingbirds preferred nector-rich flowers with high amounts of purple pigment One genetic marker (QTL) for yellow pigment reduced bee visitation by 80%. Another QTL for nectar production doubled hummingbird visitation.
- Slides: 17