Wireless Sensor Networks Technology Applications Kris Pister Prof


 A B CCA: RX startup, listen, RX->TX")

 Mote Current Radio RX startup ACK RX Energy cost")


 D One Slot Time Chan. offset A B")


 • Mesh network")


 cannot route • Routing")


 Metal (vehicles) Sound")

 • Goals: – Standard CMOS – Low power")


 Freescale (35 m. A) 25 X IRX (m.")


- Slides: 74
Wireless Sensor Networks Technology & Applications Kris Pister Prof. EECS, UC Berkeley Co-Director, Berkeley Sensor & Actuator Center Founder & CTO, Dust Networks
Outline • • • The Past What Went Wrong Technology Status Applications Technology Directions
BSAC IAB 1997 Autonomous Microsensor Networks with Optical Communication Links • • • PI: Kris Pister Source: Hughes (MICRO) Funding: $25 k, $10 k matching, 0% ovhd, Duration: 1 year Comments: Collaboration w/ Prof. Joe Kahn under separate MICRO
BSAC IAB Spring 2000 COTS Dust GOAL: • Get our feet wet RESULT: • Cheap, easy, off-the-shelf RF systems • Fantastic interest in cheap, easy, RF: – – Industry Berkeley Wireless Research Center for the Built Environment (IUCRC) PC Enabled Toys (Intel) • Fantastic RF problems • Optical proof of concept
Berkeley Demos – 2001 Motes dropped from UAV, detect vehicles, log and report direction Intel Developers Forum, live demo 800 motes, 8 level dynamic network, and velocity Seismic testing demo: real-time data acquisition, $200 vs. $5, 000 per node vs. 50 temperature sensors for HVAC deployed in 3 hours. $100 vs. $800 per node.
Cost of Sensor Networks Mesh Networking Computing Power Installation, Connection and Commissioning $ Sensors Time
Sensor Networks Take Off! Industry Analysts Take Off! $8. 1 B market for Wireless Sensor Networks in 2007 Source: In. Stat/MDR 11/2003 (Wireless); Wireless Data Research Group 2003; In. Stat/MDR 7/2004 (Handsets)
Low Data Rate WPAN Applications Zigbee 2006 2004 Pro security HVAC AMR lighting control access control asset mgt process control environmental energy mgt BUILDING AUTOMATION CONSUMER ELECTRONICS PC & PERIPHERALS INDUSTRIAL CONTROL patient monitoring fitness monitoring TV VCR DVD/CD remote PERSONAL HEALTH CARE RESIDENTIAL/ LIGHT COMMERCIAL CONTROL mouse keyboard joystick security HVAC lighting control access control lawn & garden irrigation
Barriers to Adoption On. World, 2005
Dust Networks • Founded July 2002 • Focused on reliability, power consumption • Developed TSMP – Time Synchronized Mesh Protocol – >99. 9% reliability – Lowest power per delivered packet
Power-optimal communication • Assume all motes share a network-wide synchronized sense of time, accurate to ~1 ms • For an optimally efficient network, mote A will only be awake when mote B needs to talk A A wakes up and listens B B transmits B receives ACK A transmits ACK Expected packet start time Worst case A/B clock skew
Packet transmission and acknowledgement Mote Current Radio TX startup Packet TX Radio TX/RX turnaround ACK RX Energy cost (2003): 295 u. C
Timing – imperfect synchronization (latest possible transmitter) A B CCA: RX startup, listen, RX->TX RX startup Tg Tg Transmit Packet: Preamble, SS, Headers, Payload, MIC, CRC RX packet Tcrypto Verify CRC RX startup or Tx->Rx Verify MAC MIC Tg ACK RX ACK Calculate ACK MIC+CRC Transmit ACK RX->TX Expected first bit of preamble • TCCA = 0. 512 ms to be standards compliant – Worst case is a receive slot followed by a transmit slot to a different partner, as radio will be finishing up the ACK TX just as it needs to look for a clear channel, so – TCCA = TTX->RX + Tchannel assessment + TRX->TX = 0. 192 ms + 0. 128 ms + 0. 192 ms • Tpacket = 4. 256 ms for a maximum length packet – Preamble+SS+packet = 4+1+128 B = 133 B = 1064 bits 4. 256 ms @ 250 kbps • • Tcrypto is the total time to verify packet MIC and create ACK MIC Tg. ACK is the tolerance to variation in Tcrypto and/or mote B’s turnaround time from RX to TX TACK is a function of the ACK length. It is likely to be just under 1 ms. Tslot = TCCA+2*Tg+Tpacket+Tcrypto+Tg. ACK+TACK = 0. 512+2+4. 256+1+0. 1+1 = 9 ms
Fundamental platform-specific energy requirements • Packet energy & packet rate determine power – (QTX + QRX )/ Tcycle – E. g. (60 u. C + 40 u. C) /10 s = 10 u. A
Idle listen (no packet exchanged) Mote Current Radio RX startup ACK RX Energy cost (2003): 70 u. C
Scheduled Communication Slots • Mote A can listen more often than mote B transmits • Since both are time synchronized, a different radio frequency can be used at each wakeup • Time sync information transmitted in both directions with every packet A B TX, A ACK B Ch 3 Ch 4 Ch 5 Ch 6 Ch 7 Ch 8
Latency reduction • Energy cost of latency reduction is easy to calculate: – Qlisten / Tlisten – E. g. 20 u. C/1 s = 20 u. A • Low-cost “virtual on” capability • Latency vs. power tradeoff can vary by mote, time of day, recent traffic, etc.
Multi-hop routing • Global time synchronization allows sequential ordering of links in a “superframe” • Measured average latency over many hops is Tframe/2 G T 2, ch y A T 1, ch x B Superframe
TSMP Foundations • Time Synchronization – Reliability – Power – Sensor • Reliability – Frequency diversity • Multi-path fading, interference – Spatial diversity • True mesh (multiple paths at each hop) – Temporal diversity • Secure link-layer ACK • Power – Turning radios off is easy
Link 53 37 A link defines a timeslot and channel offset.
Graph 17 47 53 37 41 43 A graph is a collection of connections and the links belonging to them A graph contains both routing and capacity Similarities to ATM circuits, flow labels, and Cisco tag switching (MPLS)
Link = (Time Slot, Channel Offset) D One Slot Time Chan. offset A B A C D A B B A B C E F B E B F • All of B’s transmit links are dedicated and won’t collide – B has twice as much bandwidth to A as to C – B can broadcast to E and F, or use that link of a unicast to one or the other • D and C share a link for transmitting to A. A backoff algorithm is needed in case of collisions.
Low latency – multiple hops • Color indicates TX slot for mote of that color • 5 hops = 5 slots = 50 ms • Can repeat immediately, or every k slots, according to superframe length. • Peak throughput with n motes in a line: 1 payload / (n*10 ms) = 100/n payloads/second
High throughput – multiple hops • Use multiple channels • Only need 2 time slots • Throughput is 50 packets/second – independent of n – Limited by worst PER (not combination) Odd slots Even slots Odd slots
Performance Limits • Data collection – 100 pkt/s per gateway channel – 16*100 pkt/s with no spatial reuse of frequency • Throughput – ~80 kbps secure, reliable end-to-end payload bits per second per gateway – 16 * 80 k = 1. 28 Mbps combined payload throughput w/ no spatial reuse of frequency • Latency – 10 ms / PDR per hop – Statistical, but well modeled • Scale – > 1, 000 nodes per gateway channel
50 motes, 7 hops 3 floors, 150, 000 sf >100, 000 packets/day
Pathloss
Path Stability by 802. 15. 4 Channel 802. 11 bg Channels 802. 15. 4 Channels 2. 480 GHz 2. 405 GHz Each dot is the 15 minute average
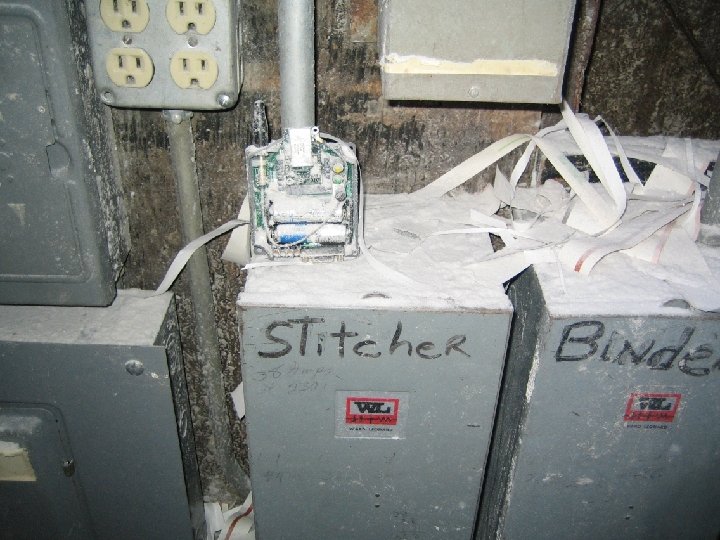
Network Topology • Sensor nodes deployed across entire facility (44 Nodes) • Mesh network self-configured and dynamically optimized • 2. 5 hop average Sensor 38 Amps 230 Volts 36
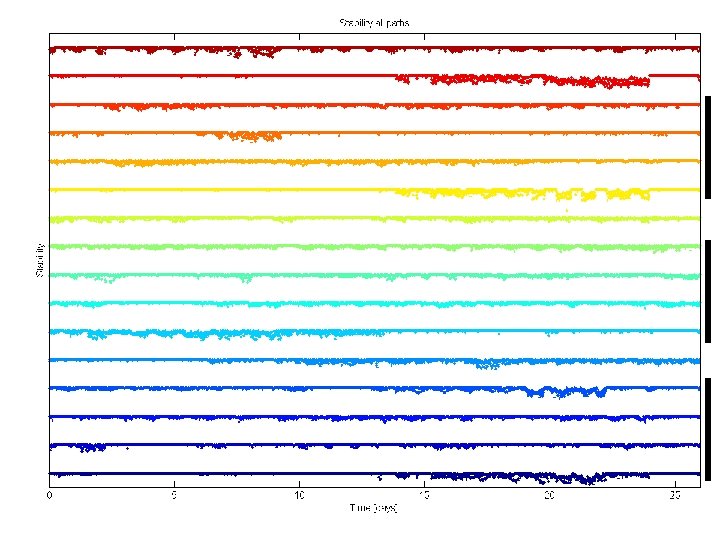
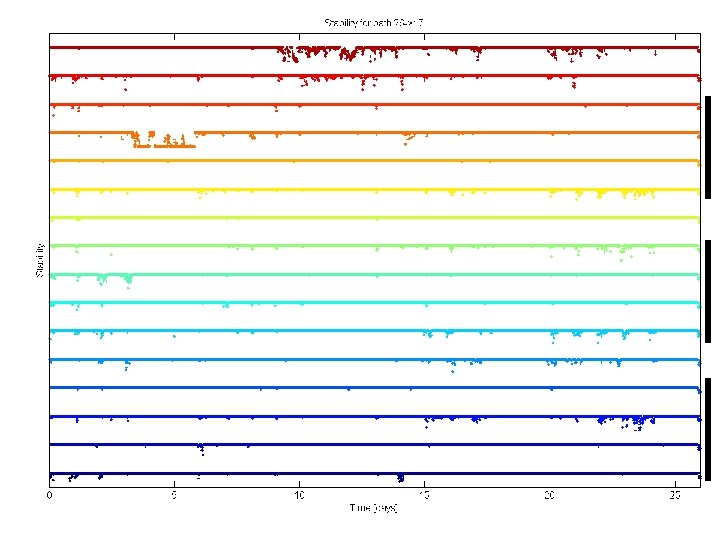
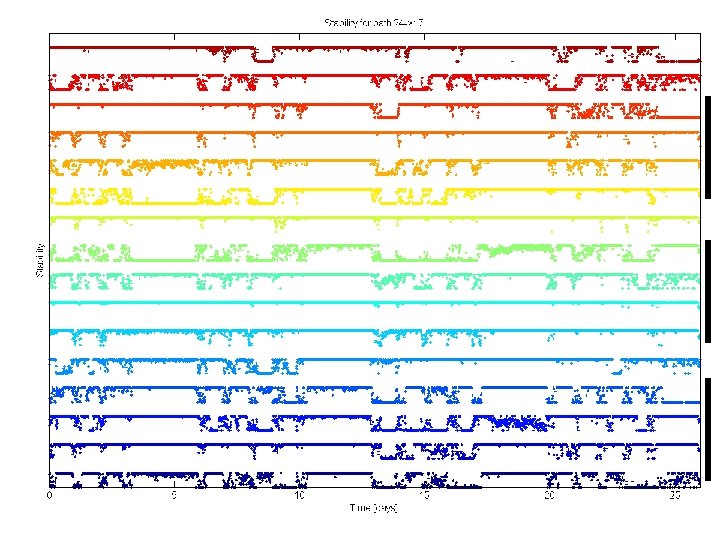
Network Protocols and Path Stability • • • Each node has two parents Child to parent connection is a path Frequency hopping over 16 channels Each path composed of 16 path-channels Stability is the packet success rate Stability measured on all path-channels – Time averaged across 26 days – Each channel averages ~ 90% 37
Time-Averaged Stability per Path While majority of paths have better than 90% stability, certain paths significantly underperform 38
Distribution of Path-Channel Stability Low stability path comprised of lower stability path-channels, causing data loss in single frequency, non-redundant network 39
Stability of Multiple Paths 17 56 47 44 Averaged Over Time 40
Channel 5 Over 26 Days Time Series For Three Paths 41
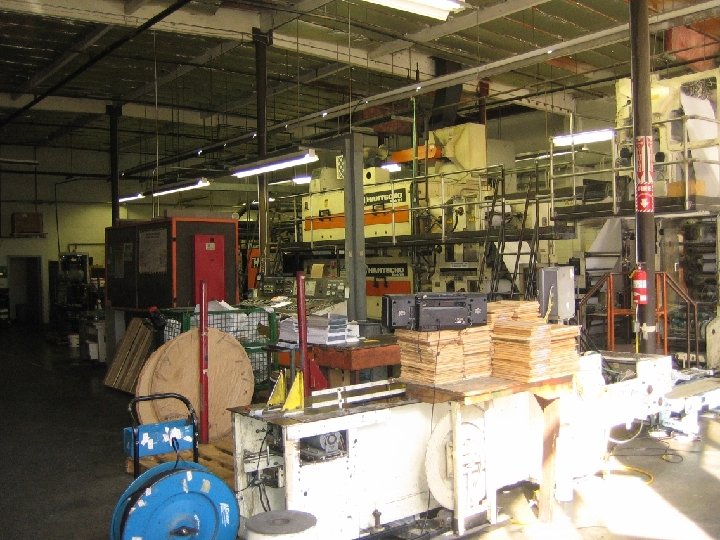
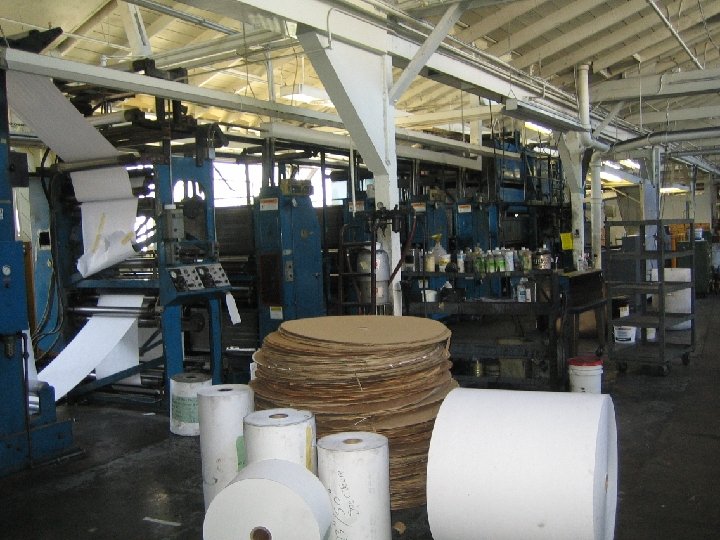
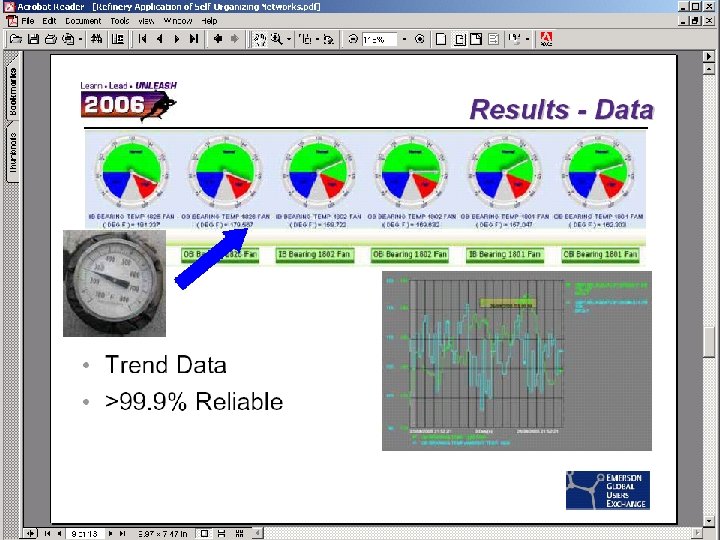
Performance in the Face of Adversity Network performance for 44 node sensor network in 170, 000 square foot industrial printing facility (26 days) • 44 motes, 80 B payload per packet • 33 packets per 15 min per mote • 1. 0 kb/s at Access Point • 3. 6 million packets, only 17 lost 99. 9995% reliability over 26 days Floor 3 Floor 2 Floor 1 ~170, 000 Sq. Ft. 42
Power Examples in-Network a router with a few links Consider 4 motes: and the router with the most links a leaf that can route A non-routing leaf
Workload Comparison • Ultra low power leaf node (Mote 256) cannot route • Routing leaf node (Mote 48) can route, but has no children now. If you add motes beyond Mote 48, it can accept join requests and route • Mote 246 has one child and two parents. • Mote 36 has 6 children and two parents, and has the most links of any mote in the network: 16 input links and 17 output links. It’s link table is full, so for this network, cannot be any busier • All motes report one 40 byte payload, once per minute. The main frame size is ~20 seconds
Power Comparisons Workload Non-router Leaf node that can route CSMA ~10 u. A 20 m. A TI 33 years 6 days MSP+CC 2 battery life 420 on 2 x. L 91 TSMP 20 u. A 28 u. A Dust 17. 0 years 11. 8 years M 2135 Dust DN 2 x 40 Lightly loaded router 20 m. A 6 days Maximally loaded router 20 m. A (if it works at all) 6 days 33 u. A 208 u. A 10. 0 years 1. 6 years 7. 7 u. A 9. 1 u. A 9. 9 u. A 45. 9 u. A 43. 0 years 36. 4 years 33. 4 years 7. 2 years
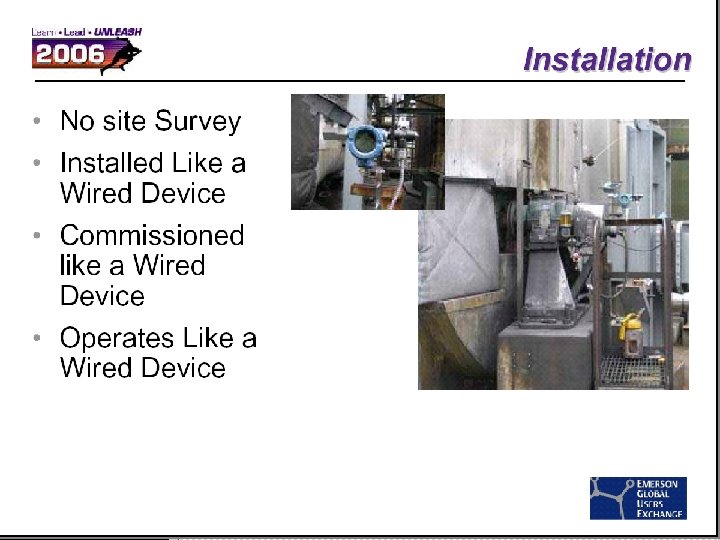
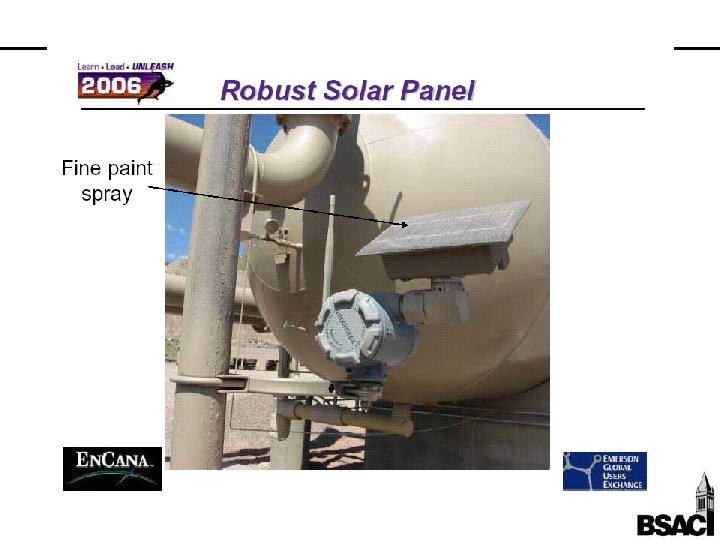
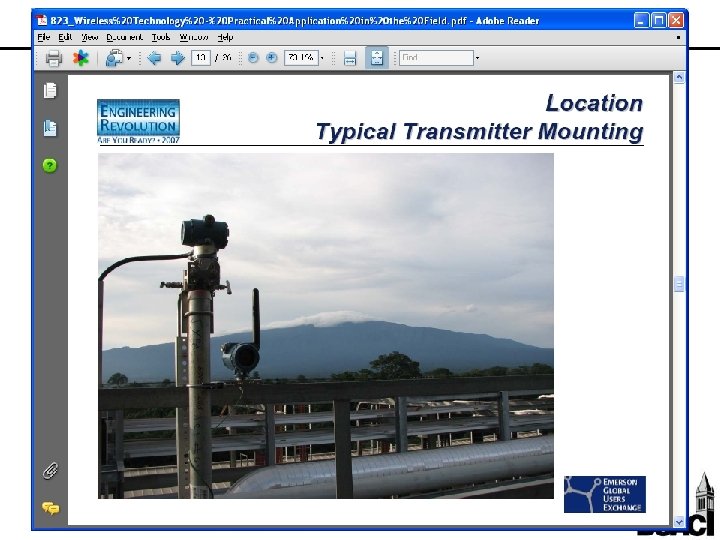
Oil Refinery – Double Coker Unit • Scope limited to Coker facility and support units spanning over 1200 ft • No repeaters were needed to ensure connectivity • Electrical/Mechanical contractor installed per wired practices • >5 year life on C-cell 400 m
Barriers to Adoption >99. 9% Wireless HART, SP 100 “It just worked” 5 -10 years Complete networks On. World, 2005
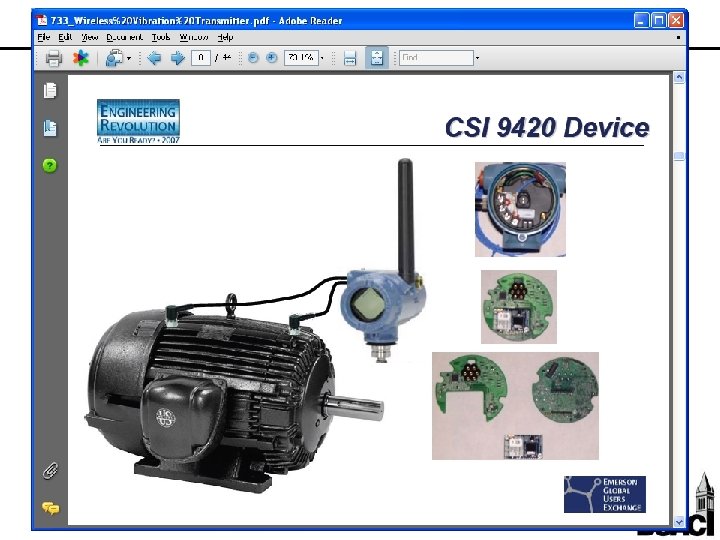
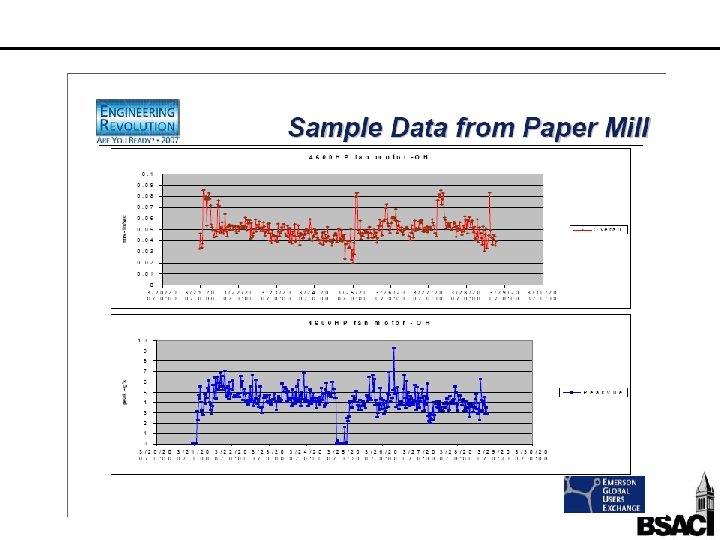
Industrial Automation • Examples – Oil & gas production, pipelines, refineries – Paper mills – Chemical processing • Companies – – Emerson ABB Endress & Hauser Siemens Emerson “Smart Wireless” starter kit, shipping since Oct 2006
The De-facto Standard 12 Manufacturers, 1 Network – Dust Networks’ TSMP Emerson MACTek Yokogawa Siemens Phoenix Contact Endress+ Hauser Elpro ABB Honeywell Smar Pepperl+ Fuchs
Parking Monitoring – Streetline Networks Real-time monitoring of parking for: Increased enforcement Dynamic pricing Real-time vacancy location services Wireless sensor node
Building Energy Reduction - Federspiel Controls HVAC System Retrofits Demonstrated Energy Savings: • 3. 7 k. Wh/sf/yr • 0. 34 therms/sf/yr • Higher savings than conventional retrofits
Building Maintenance • Temperature & energy consumption monitoring • 2 hour install vs. 4 weeks for wired network 97% reduction in installation cost • Rapid retrofit of old buildings • Energy conservation from modernizing systems • Platform for additional inbuilding applications
Energy Management • Energy is the #1 cost of supermarkets after shelf stock • Service: monitor, analyze and reduce power consumption • Entire Smart. Mesh. TM network installed in 3 hours (vs. 3 -4 days) • Typical energy cost reduction: 10 -25%
Perimeter Security Monitoring for perimeter violations: Ground vibration (footfalls or vehicles) Metal (vehicles) Sound Motion Images, data traces, and tracks reported over network
Barriers to Adoption >99. 9% Wireless HART “It just worked” 5 -10 years Complete networks On. World, 2005
Mote on a Chip? (circa 2001) • Goals: – Standard CMOS – Low power – Minmal external components antenna Temp u. P SRAM Amp ADC Radio ~2 mm^2 ASIC battery inductor crystal
UCB Hardware Results ~2003 • 2 chips fabbed in 0. 25 um CMOS – “Mote on a chip” worked, TX only – 900 MHz transceiver worked • Records set for low power CMOS – ADC, Mike Scott, M. S. • 8 bits, 100 k. S/s • 2 u. A@1 V – Microprocessor, Brett Warneke, Ph. D. • 8 bits, 1 MIP • 10 u. A@1 V – 900 MHz radio – Al Molnar M. S. • 100 kbps, “bits in, bits out” • 20 m indoors • 0. 4 m. A @ 3 V
2. 4 GHz Transceiver Front End • Cook et al. , ISSCC 2006 • Active Area: 0. 8 mm 2 • Zero external RF components
Evolution of a mote
Radio Performance Ember (36 m. A) Freescale (35 m. A) 25 X IRX (m. A) 20 With software: 10 years D cell cc 2420 X Atmel 15 X 10 cc 1000 X 5 Dust Cook 06 (300 m. W) Molnar 04 (0. 4 m. A) X Otis 05 (0. 4 m. A) X 100 k With software: 10 years coin cell X 200 k 300 k Bit rate (bps)
Mote on a Chip, 2009 • Goals: – Standard CMOS – Low power – Minimal external components Zero antenna u. P Security Temp Location Amp ADC Radio Time SRAM ~4 mm^2 ASIC battery inductor crystal
RF Time of Flight Ranging in a Coal Mine Tunnel Steven Lanzisera 2 m Error Measurement on Measured Data 802. 15. 4 channel Ideal 1 m Error Takeaway: ~1 m position accuracy indoors
Discussion • 10 years later, a real market emerges – Industrial Automation – Driven by reliable, secure, low power networks • University impact – Vision & Warm Bodies • Future – Agriculture, Energy, Healthcare – Defense, Entertainment
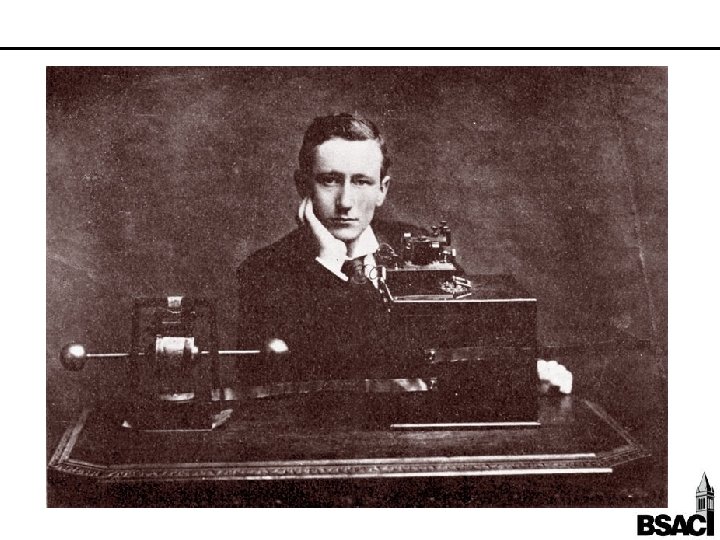
The Promise of Wireless “I do not think that the wireless waves that I have discovered will have any practical application. ” - Heinrich Hertz 1890