What are the current costs and outcomes related
- Slides: 37
What are the current costs and outcomes related to mental health and substance abuse disorders? Peterson-Kaiser Health System Tracker
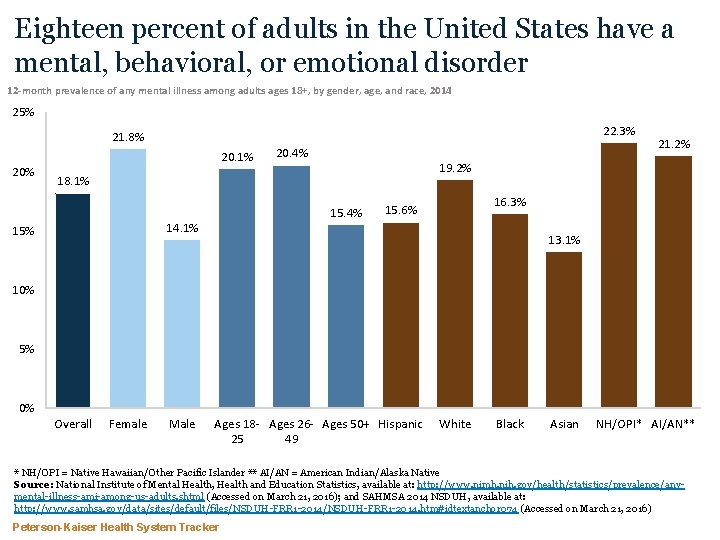
Eighteen percent of adults in the United States have a mental, behavioral, or emotional disorder 12 -month prevalence of any mental illness among adults ages 18+, by gender, age, and race, 2014 25% 22. 3% 21. 8% 20. 1% 20. 4% 19. 2% 18. 1% 15. 4% 14. 1% 15% 21. 2% 16. 3% 15. 6% 13. 1% 10% 5% 0% Overall Female Male Ages 18 - Ages 26 - Ages 50+ Hispanic 25 49 White Black Asian NH/OPI* AI/AN** * NH/OPI = Native Hawaiian/Other Pacific Islander ** AI/AN = American Indian/Alaska Native Source: National Institute of Mental Health, Health and Education Statistics, available at: http: //www. nimh. nih. gov/health/statistics/prevalence/anymental-illness-ami-among-us-adults. shtml (Accessed on March 21, 2016); and SAHMSA 2014 NSDUH, available at: http: //www. samhsa. gov/data/sites/default/files/NSDUH-FRR 1 -2014. htm#idtextanchor 074 (Accessed on March 21, 2016) Peterson-Kaiser Health System Tracker
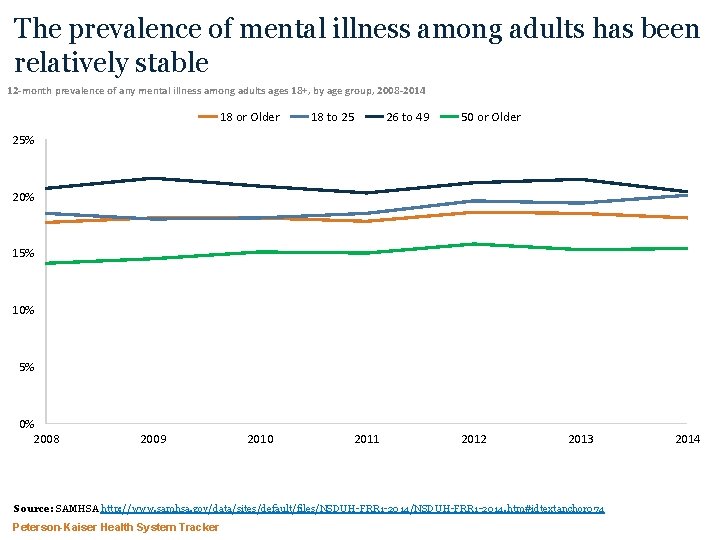
The prevalence of mental illness among adults has been relatively stable 12 -month prevalence of any mental illness among adults ages 18+, by age group, 2008 -2014 18 or Older 18 to 25 26 to 49 50 or Older 25% 20% 15% 10% 5% 0% 2008 2009 2010 2011 2012 2013 Source: SAMHSA http: //www. samhsa. gov/data/sites/default/files/NSDUH-FRR 1 -2014. htm#idtextanchor 074 Peterson-Kaiser Health System Tracker 2014
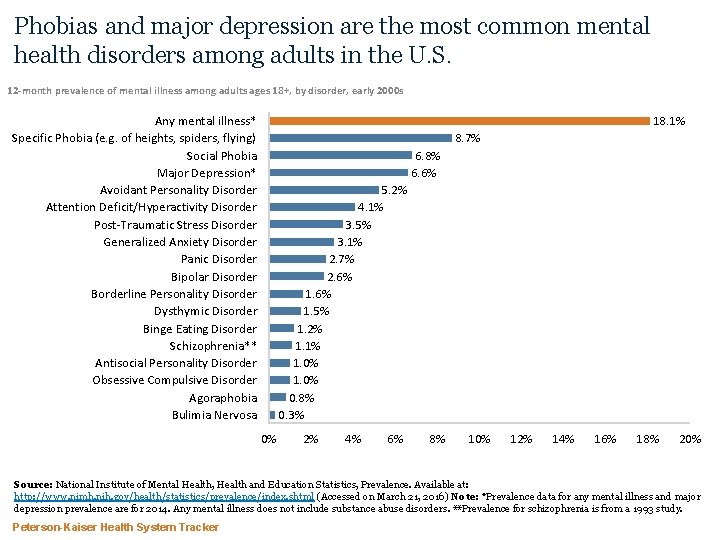
Phobias and major depression are the most common mental health disorders among adults in the U. S. 12 -month prevalence of mental illness among adults ages 18+, by disorder, early 2000 s 18. 1% Any mental illness* Specific Phobia (e. g. of heights, spiders, flying) Social Phobia Major Depression* Avoidant Personality Disorder Attention Deficit/Hyperactivity Disorder Post-Traumatic Stress Disorder Generalized Anxiety Disorder Panic Disorder Bipolar Disorder Borderline Personality Disorder Dysthymic Disorder Binge Eating Disorder Schizophrenia** Antisocial Personality Disorder Obsessive Compulsive Disorder Agoraphobia Bulimia Nervosa 8. 7% 6. 8% 6. 6% 5. 2% 4. 1% 3. 5% 3. 1% 2. 7% 2. 6% 1. 5% 1. 2% 1. 1% 1. 0% 0. 8% 0. 3% 0% 2% 4% 6% 8% 10% 12% 14% 16% 18% 20% Source: National Institute of Mental Health, Health and Education Statistics, Prevalence. Available at: http: //www. nimh. nih. gov/health/statistics/prevalence/index. shtml (Accessed on March 21, 2016) Note: *Prevalence data for any mental illness and major depression prevalence are for 2014. Any mental illness does not include substance abuse disorders. **Prevalence for schizophrenia is from a 1993 study. Peterson-Kaiser Health System Tracker
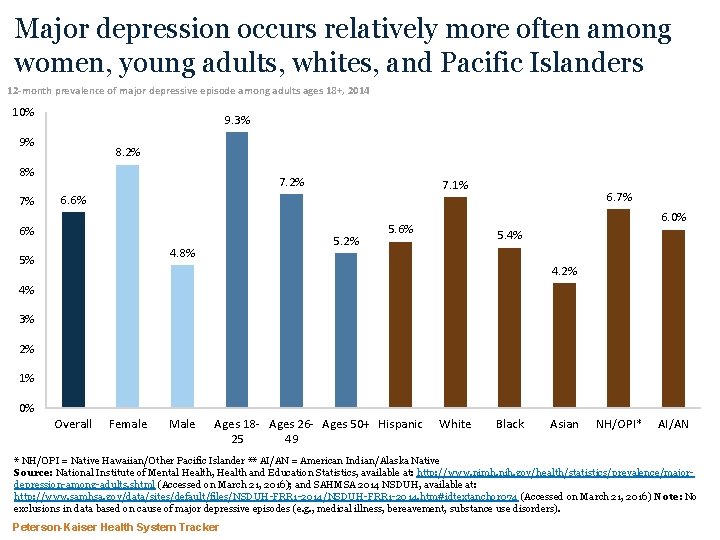
Major depression occurs relatively more often among women, young adults, whites, and Pacific Islanders 12 -month prevalence of major depressive episode among adults ages 18+, 2014 10% 9. 3% 9% 8. 2% 8% 7% 7. 2% 7. 1% 6. 6% 6% 5. 2% 4. 8% 5% 6. 7% 6. 0% 5. 6% 5. 4% 4. 2% 4% 3% 2% 1% 0% Overall Female Male Ages 18 - Ages 26 - Ages 50+ Hispanic 25 49 White Black Asian NH/OPI* AI/AN * NH/OPI = Native Hawaiian/Other Pacific Islander ** AI/AN = American Indian/Alaska Native Source: National Institute of Mental Health, Health and Education Statistics, available at: http: //www. nimh. nih. gov/health/statistics/prevalence/majordepression-among-adults. shtml (Accessed on March 21, 2016); and SAHMSA 2014 NSDUH, available at: http: //www. samhsa. gov/data/sites/default/files/NSDUH-FRR 1 -2014. htm#idtextanchor 074 (Accessed on March 21, 2016) Note: No exclusions in data based on cause of major depressive episodes (e. g. , medical illness, bereavement, substance use disorders). Peterson-Kaiser Health System Tracker
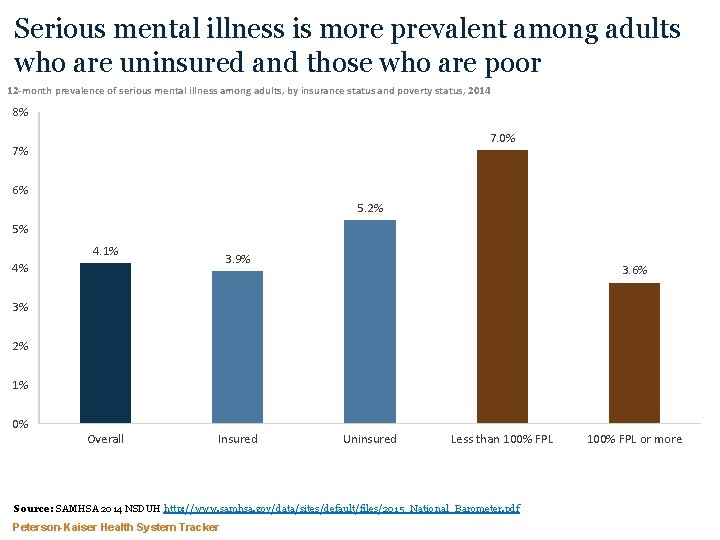
Serious mental illness is more prevalent among adults who are uninsured and those who are poor 12 -month prevalence of serious mental illness among adults, by insurance status and poverty status, 2014 8% 7. 0% 7% 6% 5. 2% 5% 4. 1% 3. 9% 4% 3. 6% 3% 2% 1% 0% Overall Insured Uninsured Less than 100% FPL Source: SAMHSA 2014 NSDUH http: //www. samhsa. gov/data/sites/default/files/2015_National_Barometer. pdf Peterson-Kaiser Health System Tracker 100% FPL or more
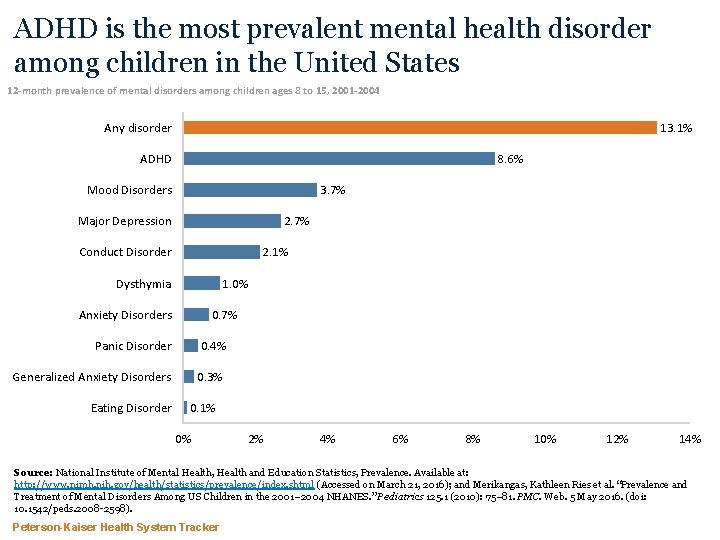
ADHD is the most prevalent mental health disorder among children in the United States 12 -month prevalence of mental disorders among children ages 8 to 15, 2001 -2004 Any disorder 13. 1% ADHD 8. 6% 3. 7% Mood Disorders 2. 7% Major Depression Conduct Disorder 2. 1% Dysthymia 1. 0% Anxiety Disorders 0. 7% Panic Disorder 0. 4% Generalized Anxiety Disorders 0. 3% Eating Disorder 0. 1% 0% 2% 4% 6% 8% 10% 12% 14% Source: National Institute of Mental Health, Health and Education Statistics, Prevalence. Available at: http: //www. nimh. nih. gov/health/statistics/prevalence/index. shtml (Accessed on March 21, 2016); and Merikangas, Kathleen Ries et al. “Prevalence and Treatment of Mental Disorders Among US Children in the 2001– 2004 NHANES. ” Pediatrics 125. 1 (2010): 75– 81. PMC. Web. 5 May 2016. (doi: 10. 1542/peds. 2008 -2598). Peterson-Kaiser Health System Tracker
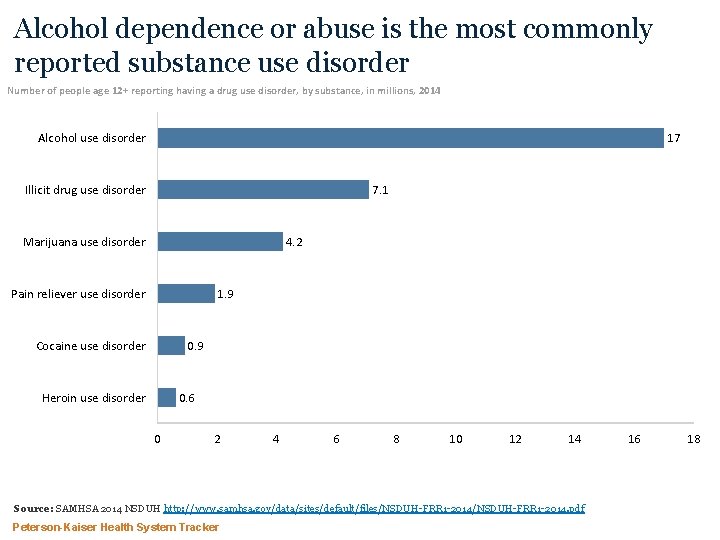
Alcohol dependence or abuse is the most commonly reported substance use disorder Number of people age 12+ reporting having a drug use disorder, by substance, in millions, 2014 Alcohol use disorder 17 7. 1 Illicit drug use disorder 4. 2 Marijuana use disorder 1. 9 Pain reliever use disorder Cocaine use disorder 0. 9 Heroin use disorder 0. 6 0 2 4 6 8 10 12 14 Source: SAMHSA 2014 NSDUH http: //www. samhsa. gov/data/sites/default/files/NSDUH-FRR 1 -2014. pdf Peterson-Kaiser Health System Tracker 16 18
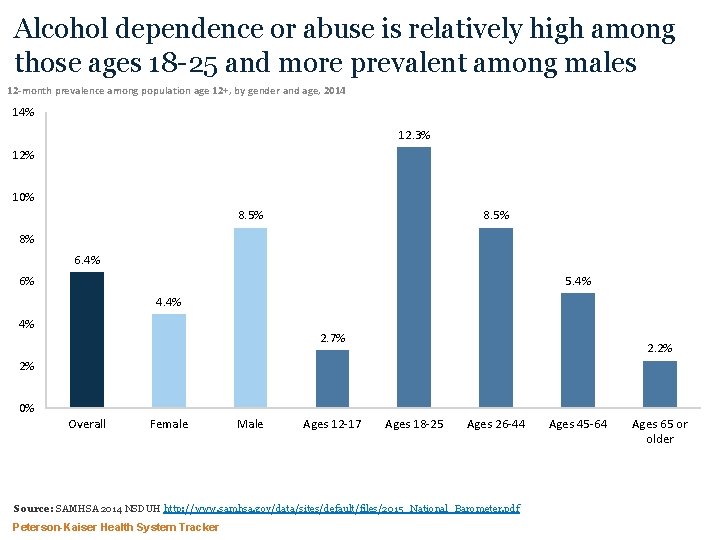
Alcohol dependence or abuse is relatively high among those ages 18 -25 and more prevalent among males 12 -month prevalence among population age 12+, by gender and age, 2014 14% 12. 3% 12% 10% 8. 5% 8% 6. 4% 5. 4% 6% 4. 4% 4% 2. 7% 2. 2% 2% 0% Overall Female Male Ages 12 -17 Ages 18 -25 Ages 26 -44 Source: SAMHSA 2014 NSDUH http: //www. samhsa. gov/data/sites/default/files/2015_National_Barometer. pdf Peterson-Kaiser Health System Tracker Ages 45 -64 Ages 65 or older
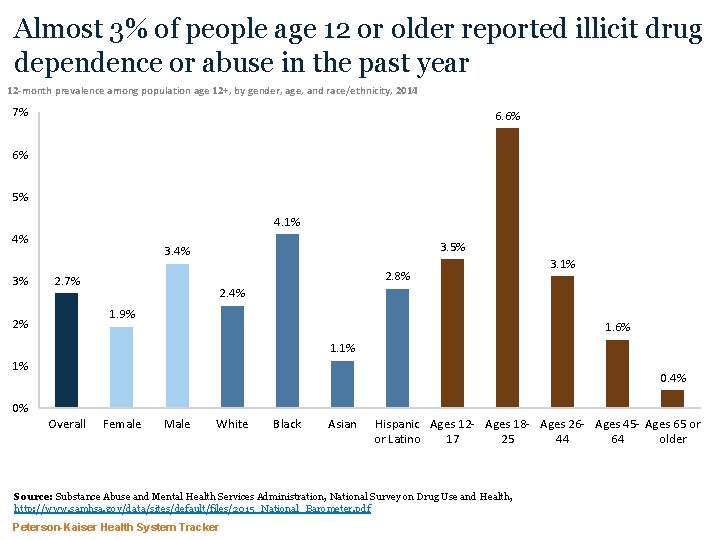
Almost 3% of people age 12 or older reported illicit drug dependence or abuse in the past year 12 -month prevalence among population age 12+, by gender, age, and race/ethnicity, 2014 7% 6. 6% 6% 5% 4. 1% 4% 3% 3. 5% 3. 4% 2. 8% 2. 7% 2. 4% 1. 9% 2% 3. 1% 1. 6% 1. 1% 1% 0% 0. 4% Overall Female Male White Black Asian Hispanic Ages 12 - Ages 18 - Ages 26 - Ages 45 - Ages 65 or or Latino 17 25 44 64 older Source: Substance Abuse and Mental Health Services Administration, National Survey on Drug Use and Health, http: //www. samhsa. gov/data/sites/default/files/2015_National_Barometer. pdf Peterson-Kaiser Health System Tracker
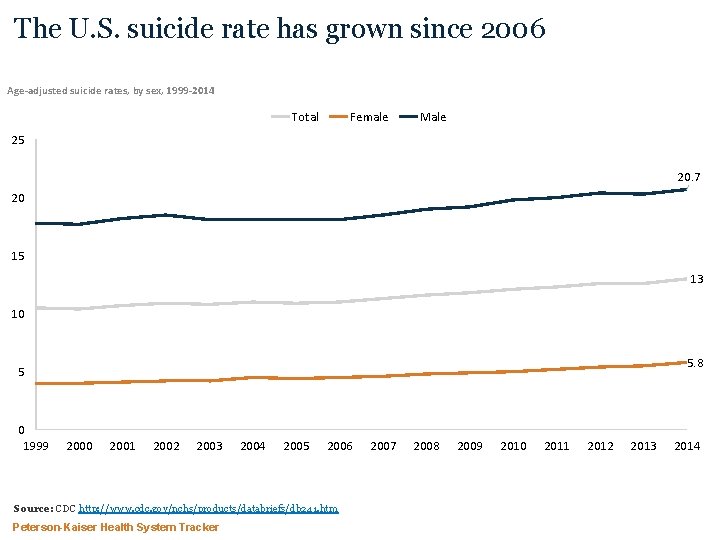
The U. S. suicide rate has grown since 2006 Age-adjusted suicide rates, by sex, 1999 -2014 Total Female Male 25 20. 7 20 15 13 10 5. 8 5 0 1999 2000 2001 2002 2003 2004 2005 2006 Source: CDC http: //www. cdc. gov/nchs/products/databriefs/db 241. htm Peterson-Kaiser Health System Tracker 2007 2008 2009 2010 2011 2012 2013 2014
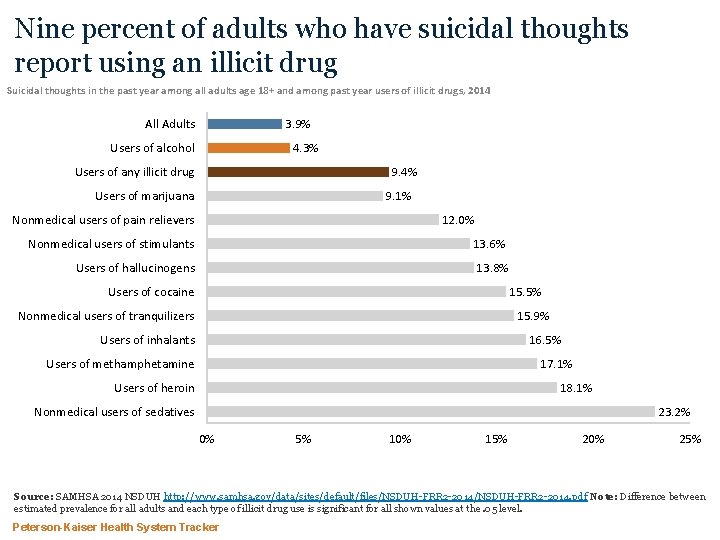
Nine percent of adults who have suicidal thoughts report using an illicit drug Suicidal thoughts in the past year among all adults age 18+ and among past year users of illicit drugs, 2014 All Adults 3. 9% Users of alcohol 4. 3% Users of any illicit drug 9. 4% Users of marijuana 9. 1% Nonmedical users of pain relievers 12. 0% Nonmedical users of stimulants 13. 6% Users of hallucinogens 13. 8% Users of cocaine 15. 5% Nonmedical users of tranquilizers 15. 9% Users of inhalants 16. 5% Users of methamphetamine 17. 1% Users of heroin 18. 1% Nonmedical users of sedatives 23. 2% 0% 5% 10% 15% 20% 25% Source: SAMHSA 2014 NSDUH http: //www. samhsa. gov/data/sites/default/files/NSDUH-FRR 2 -2014. pdf Note: Difference between estimated prevalence for all adults and each type of illicit drug use is significant for all shown values at the. 05 level. Peterson-Kaiser Health System Tracker
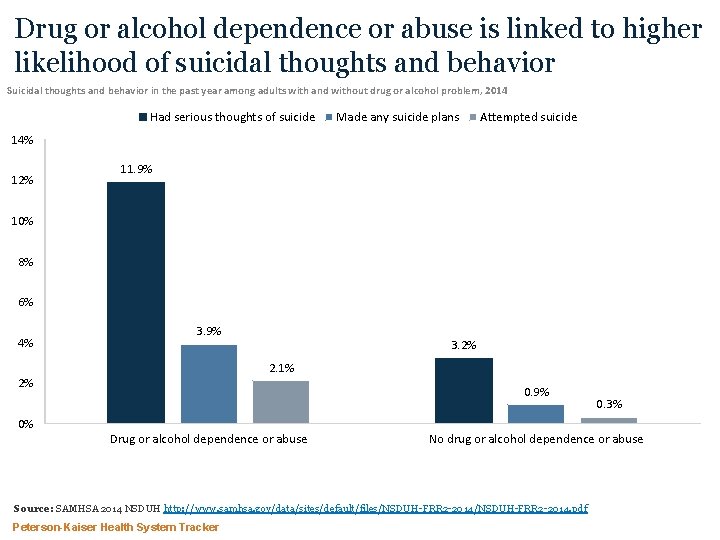
Drug or alcohol dependence or abuse is linked to higher likelihood of suicidal thoughts and behavior Suicidal thoughts and behavior in the past year among adults with and without drug or alcohol problem, 2014 Had serious thoughts of suicide Made any suicide plans Attempted suicide 14% 12% 11. 9% 10% 8% 6% 4% 3. 9% 2. 1% 2% 0% 3. 2% 0. 9% Drug or alcohol dependence or abuse No drug or alcohol dependence or abuse Source: SAMHSA 2014 NSDUH http: //www. samhsa. gov/data/sites/default/files/NSDUH-FRR 2 -2014. pdf Peterson-Kaiser Health System Tracker 0. 3%
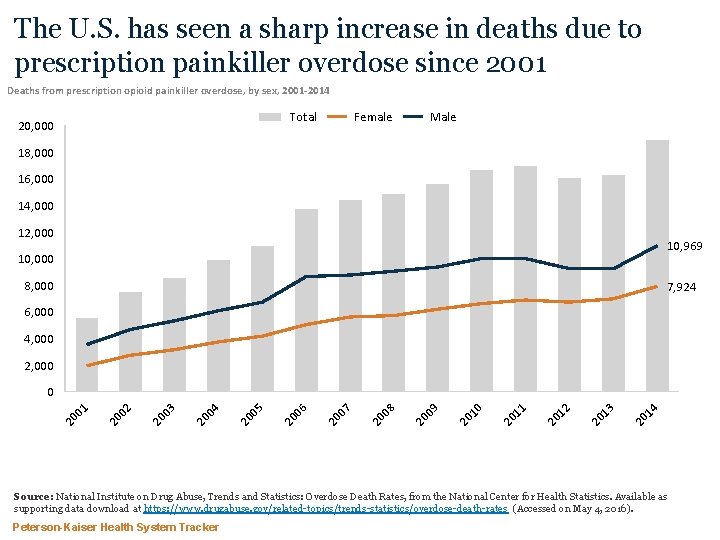
The U. S. has seen a sharp increase in deaths due to prescription painkiller overdose since 2001 Deaths from prescription opioid painkiller overdose, by sex, 2001 -2014 Total 20, 000 Female Male 18, 000 16, 000 14, 000 12, 000 10, 969 10, 000 8, 000 7, 924 6, 000 4, 000 20 14 20 13 20 12 20 11 20 10 20 09 20 08 20 07 20 06 05 20 20 04 20 03 20 02 20 01 0 Source: National Institute on Drug Abuse, Trends and Statistics: Overdose Death Rates, from the National Center for Health Statistics. Available as supporting data download at https: //www. drugabuse. gov/related-topics/trends-statistics/overdose-death-rates (Accessed on May 4, 2016). Peterson-Kaiser Health System Tracker
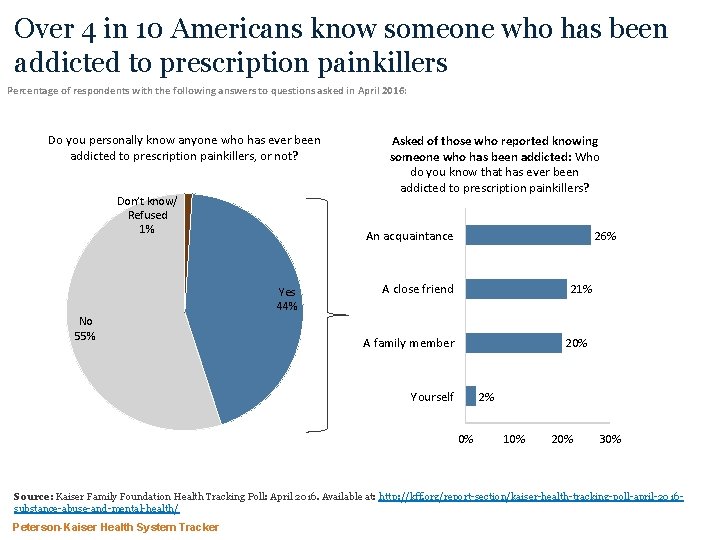
Over 4 in 10 Americans know someone who has been addicted to prescription painkillers Percentage of respondents with the following answers to questions asked in April 2016: Do you personally know anyone who has ever been addicted to prescription painkillers, or not? Don’t know/ Refused 1% An acquaintance Yes 44% No 55% Asked of those who reported knowing someone who has been addicted: Who do you know that has ever been addicted to prescription painkillers? 26% A close friend 21% A family member 20% Yourself 2% 0% 10% 20% 30% Source: Kaiser Family Foundation Health Tracking Poll: April 2016. Available at: http: //kff. org/report-section/kaiser-health-tracking-poll-april-2016 substance-abuse-and-mental-health/ Peterson-Kaiser Health System Tracker
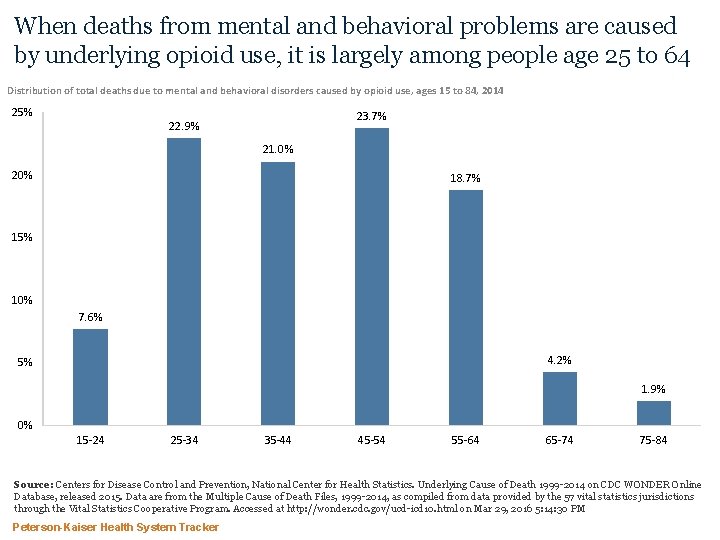
When deaths from mental and behavioral problems are caused by underlying opioid use, it is largely among people age 25 to 64 Distribution of total deaths due to mental and behavioral disorders caused by opioid use, ages 15 to 84, 2014 25% 23. 7% 22. 9% 21. 0% 20% 18. 7% 15% 10% 7. 6% 4. 2% 5% 1. 9% 0% 15 -24 25 -34 35 -44 45 -54 55 -64 65 -74 75 -84 Source: Centers for Disease Control and Prevention, National Center for Health Statistics. Underlying Cause of Death 1999 -2014 on CDC WONDER Online Database, released 2015. Data are from the Multiple Cause of Death Files, 1999 -2014, as compiled from data provided by the 57 vital statistics jurisdictions through the Vital Statistics Cooperative Program. Accessed at http: //wonder. cdc. gov/ucd-icd 10. html on Mar 29, 2016 5: 14: 30 PM Peterson-Kaiser Health System Tracker
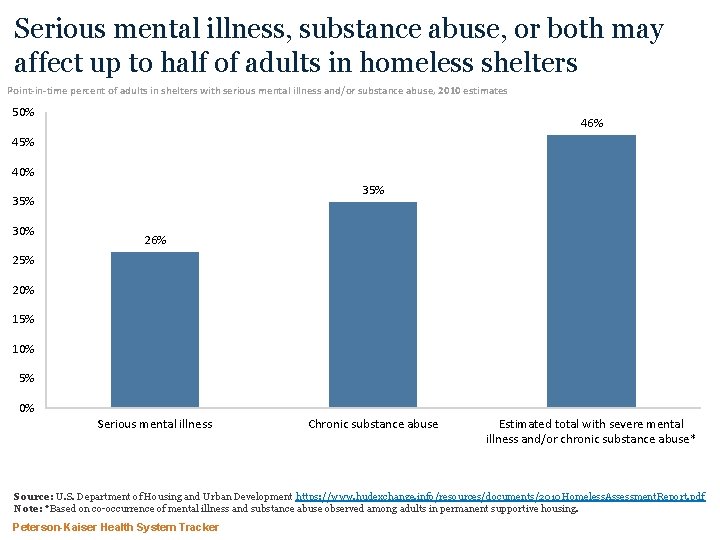
Serious mental illness, substance abuse, or both may affect up to half of adults in homeless shelters Point-in-time percent of adults in shelters with serious mental illness and/or substance abuse, 2010 estimates 50% 46% 45% 40% 35% 30% 26% 25% 20% 15% 10% 5% 0% Serious mental illness Chronic substance abuse Estimated total with severe mental illness and/or chronic substance abuse* Source: U. S. Department of Housing and Urban Development https: //www. hudexchange. info/resources/documents/2010 Homeless. Assessment. Report. pdf Note: *Based on co-occurrence of mental illness and substance abuse observed among adults in permanent supportive housing. Peterson-Kaiser Health System Tracker
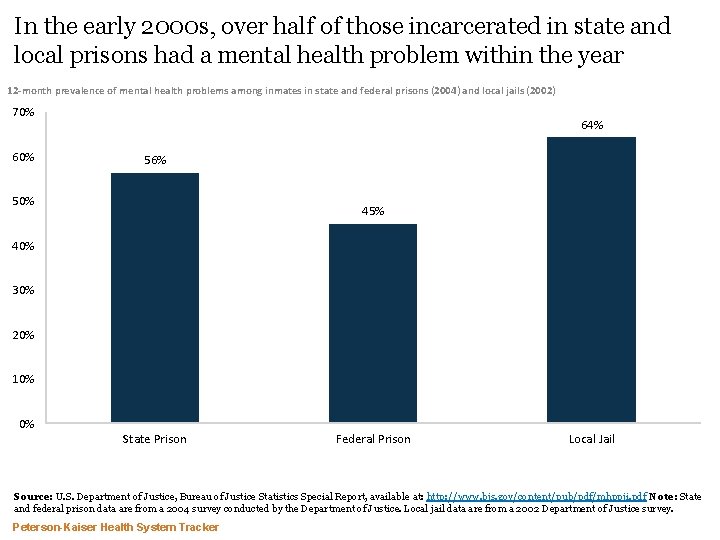
In the early 2000 s, over half of those incarcerated in state and local prisons had a mental health problem within the year 12 -month prevalence of mental health problems among inmates in state and federal prisons (2004) and local jails (2002) 70% 64% 56% 50% 45% 40% 30% 20% 10% 0% State Prison Federal Prison Local Jail Source: U. S. Department of Justice, Bureau of Justice Statistics Special Report, available at: http: //www. bjs. gov/content/pub/pdf/mhppji. pdf Note: State and federal prison data are from a 2004 survey conducted by the Department of Justice. Local jail data are from a 2002 Department of Justice survey. Peterson-Kaiser Health System Tracker
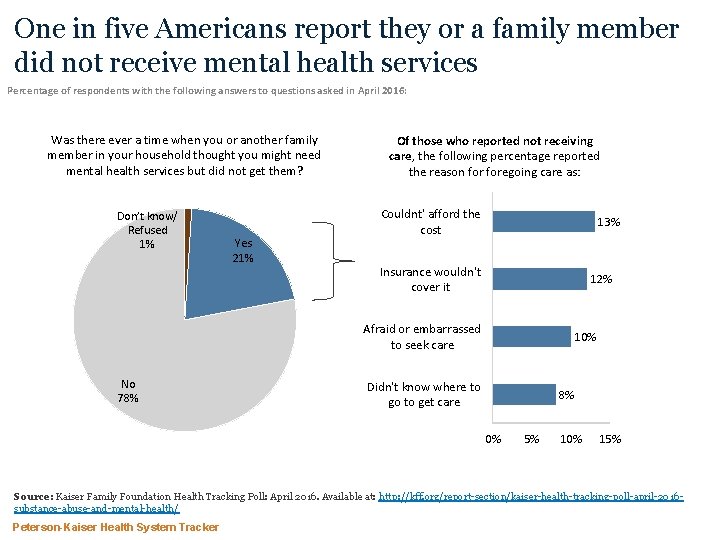
One in five Americans report they or a family member did not receive mental health services Percentage of respondents with the following answers to questions asked in April 2016: Was there ever a time when you or another family member in your household thought you might need mental health services but did not get them? Don’t know/ Refused 1% Yes 21% Of those who reported not receiving care, the following percentage reported the reason foregoing care as: Couldnt' afford the cost 13% Insurance wouldn't cover it 12% Afraid or embarrassed to seek care No 78% 10% Didn't know where to go to get care 8% 0% 5% 10% 15% Source: Kaiser Family Foundation Health Tracking Poll: April 2016. Available at: http: //kff. org/report-section/kaiser-health-tracking-poll-april-2016 substance-abuse-and-mental-health/ Peterson-Kaiser Health System Tracker
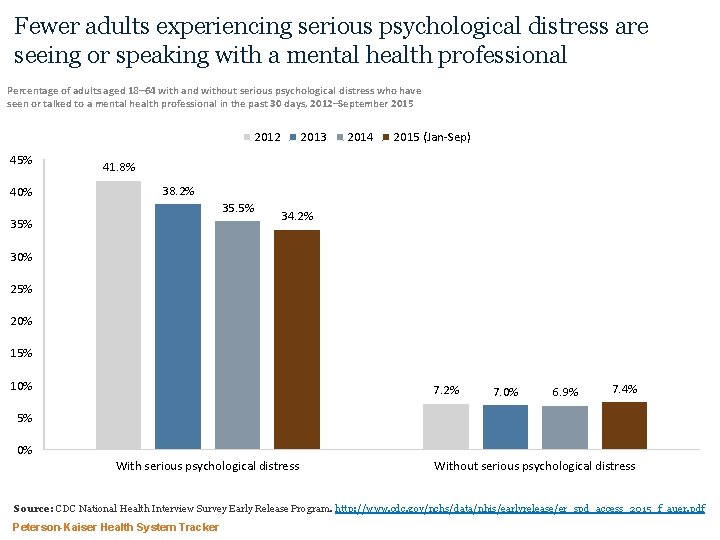
Fewer adults experiencing serious psychological distress are seeing or speaking with a mental health professional Percentage of adults aged 18– 64 with and without serious psychological distress who have seen or talked to a mental health professional in the past 30 days, 2012–September 2015 2012 45% 40% 2013 2014 2015 (Jan-Sep) 41. 8% 38. 2% 35. 5% 34. 2% 30% 25% 20% 15% 10% 7. 2% 7. 0% 6. 9% 7. 4% 5% 0% With serious psychological distress Without serious psychological distress Source: CDC National Health Interview Survey Early Release Program. http: //www. cdc. gov/nchs/data/nhis/earlyrelease/er_spd_access_2015_f_auer. pdf Peterson-Kaiser Health System Tracker
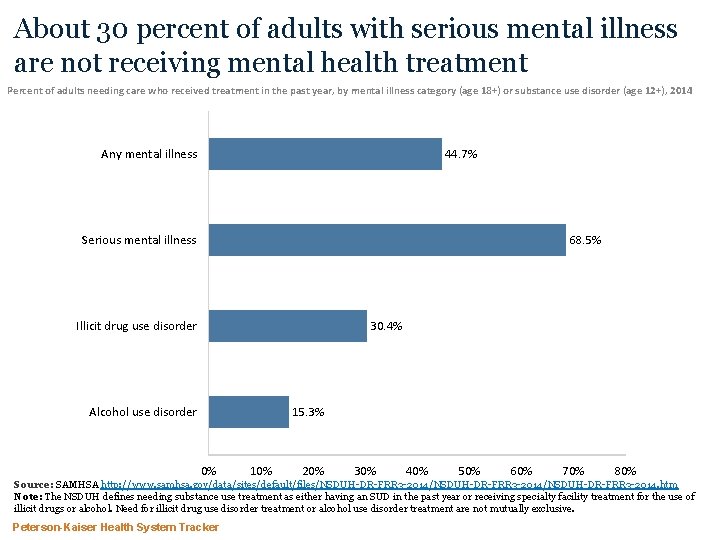
About 30 percent of adults with serious mental illness are not receiving mental health treatment Percent of adults needing care who received treatment in the past year, by mental illness category (age 18+) or substance use disorder (age 12+), 2014 Any mental illness 44. 7% Serious mental illness 68. 5% Illicit drug use disorder 30. 4% Alcohol use disorder 15. 3% 0% 10% 20% 30% 40% 50% 60% 70% 80% Source: SAMHSA http: //www. samhsa. gov/data/sites/default/files/NSDUH-DR-FRR 3 -2014/NSDUH-DR-FRR 3 -2014. htm Note: The NSDUH defines needing substance use treatment as either having an SUD in the past year or receiving specialty facility treatment for the use of illicit drugs or alcohol. Need for illicit drug use disorder treatment or alcohol use disorder treatment are not mutually exclusive. Peterson-Kaiser Health System Tracker
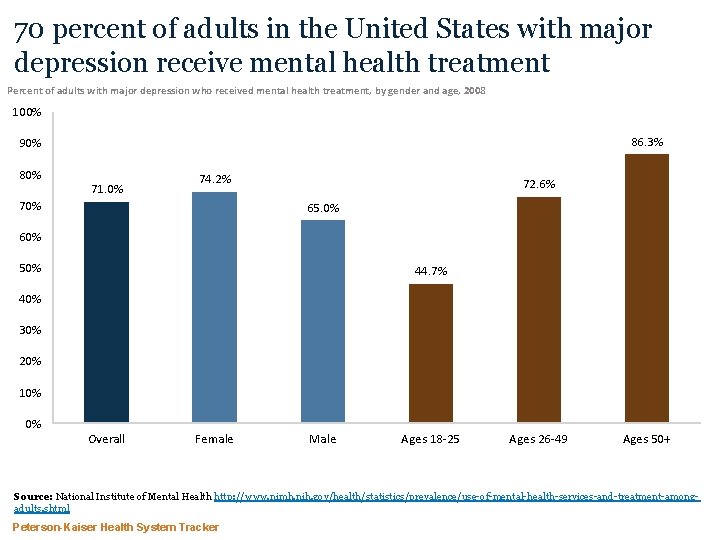
70 percent of adults in the United States with major depression receive mental health treatment Percent of adults with major depression who received mental health treatment, by gender and age, 2008 100% 86. 3% 90% 80% 71. 0% 74. 2% 70% 72. 6% 65. 0% 60% 50% 44. 7% 40% 30% 20% 10% 0% Overall Female Male Ages 18 -25 Ages 26 -49 Ages 50+ Source: National Institute of Mental Health http: //www. nimh. nih. gov/health/statistics/prevalence/use-of-mental-health-services-and-treatment-amongadults. shtml Peterson-Kaiser Health System Tracker
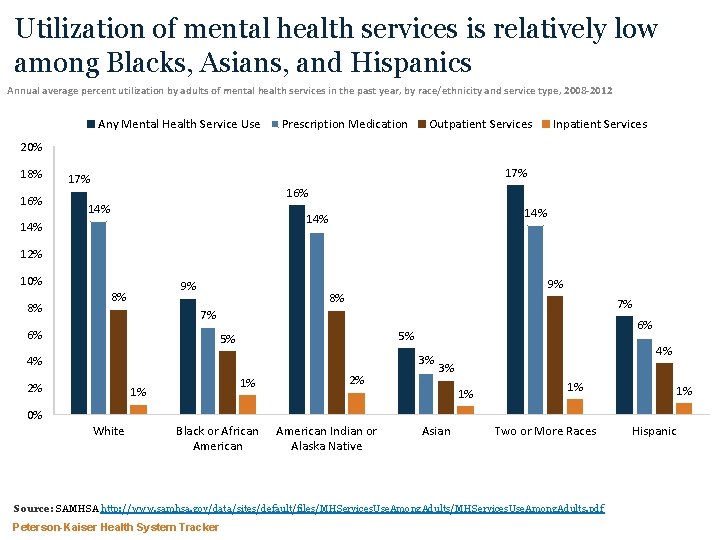
Utilization of mental health services is relatively low among Blacks, Asians, and Hispanics Annual average percent utilization by adults of mental health services in the past year, by race/ethnicity and service type, 2008 -2012 Any Mental Health Service Use Prescription Medication Outpatient Services Inpatient Services 20% 18% 16% 17% 16% 14% 14% 12% 10% 8% 9% 8% 7% 7% 6% 3% 4% 2% 0% 6% 5% 5% 1% 1% White Black or African American 2% American Indian or Alaska Native 4% 3% 1% Asian 1% Two or More Races Source: SAMHSA http: //www. samhsa. gov/data/sites/default/files/MHServices. Use. Among. Adults. pdf Peterson-Kaiser Health System Tracker 1% Hispanic
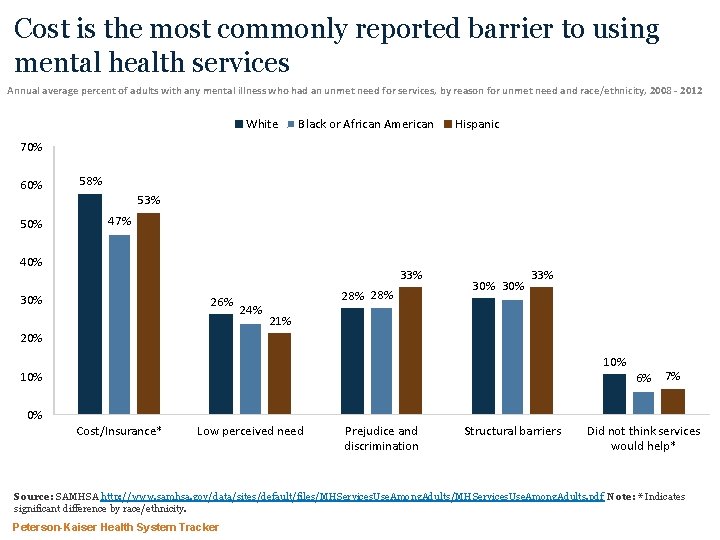
Cost is the most commonly reported barrier to using mental health services Annual average percent of adults with any mental illness who had an unmet need for services, by reason for unmet need and race/ethnicity, 2008 - 2012 White Black or African American Hispanic 70% 60% 58% 53% 47% 40% 33% 30% 26% 24% 28% 30% 33% 21% 20% 10% 0% 6% Cost/Insurance* Low perceived need Prejudice and discrimination Structural barriers 7% Did not think services would help* Source: SAMHSA http: //www. samhsa. gov/data/sites/default/files/MHServices. Use. Among. Adults. pdf Note: * Indicates significant difference by race/ethnicity. Peterson-Kaiser Health System Tracker
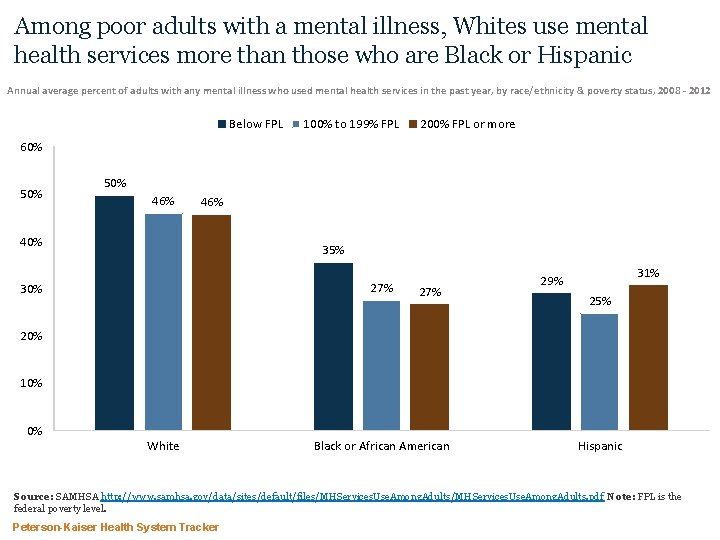
Among poor adults with a mental illness, Whites use mental health services more than those who are Black or Hispanic Annual average percent of adults with any mental illness who used mental health services in the past year, by race/ethnicity & poverty status, 2008 - 2012 Below FPL 100% to 199% FPL 200% FPL or more 60% 50% 46% 40% 35% 27% 30% 27% 31% 29% 25% 20% 10% 0% White Black or African American Hispanic Source: SAMHSA http: //www. samhsa. gov/data/sites/default/files/MHServices. Use. Among. Adults. pdf Note: FPL is the federal poverty level. Peterson-Kaiser Health System Tracker
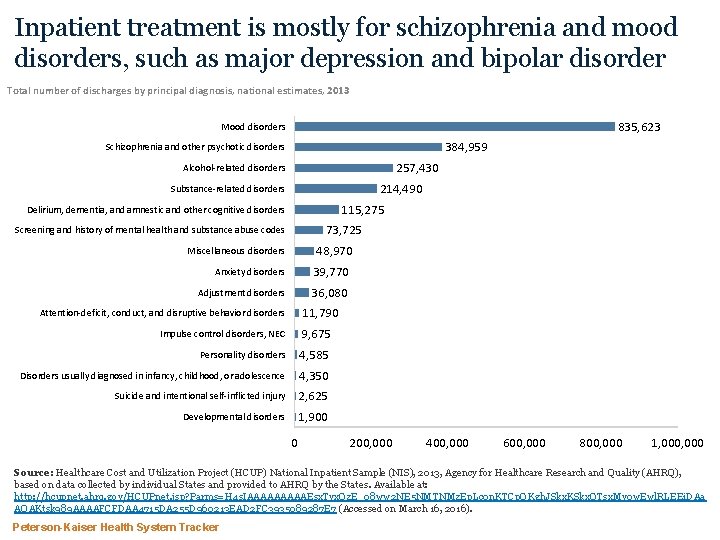
Inpatient treatment is mostly for schizophrenia and mood disorders, such as major depression and bipolar disorder Total number of discharges by principal diagnosis, national estimates, 2013 835, 623 Mood disorders 384, 959 Schizophrenia and other psychotic disorders 257, 430 Alcohol-related disorders 214, 490 Substance-related disorders 115, 275 Delirium, dementia, and amnestic and other cognitive disorders 73, 725 Screening and history of mental health and substance abuse codes 48, 970 Miscellaneous disorders Anxiety disorders 39, 770 Adjustment disorders 36, 080 11, 790 Attention-deficit, conduct, and disruptive behavior disorders Impulse control disorders, NEC 9, 675 Personality disorders 4, 585 Disorders usually diagnosed in infancy, childhood, or adolescence 4, 350 Suicide and intentional self-inflicted injury 2, 625 Developmental disorders 1, 900 0 200, 000 400, 000 600, 000 800, 000 1, 000 Source: Healthcare Cost and Utilization Project (HCUP) National Inpatient Sample (NIS), 2013, Agency for Healthcare Research and Quality (AHRQ), based on data collected by individual States and provided to AHRQ by the States. Available at: http: //hcupnet. ahrq. gov/HCUPnet. jsp? Parms=H 4 s. IAAAAAEsx. Tyx. Oz. E_08 ww 2 NE 5 NMTNMz. Ep. Lc 0 n. KTCp. OKgh. JSkx. KSkx. OTsx. My 0 w. Ewl. RLEEi. DAa AQAKtsk 989 AAAAFCFDAA 4715 DA 255 D 960213 EAD 2 FC 3935089287 E 7 (Accessed on March 16, 2016). Peterson-Kaiser Health System Tracker
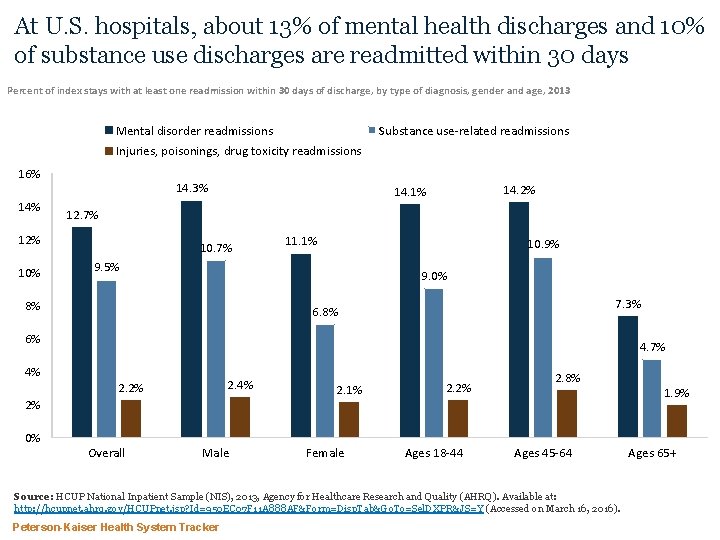
At U. S. hospitals, about 13% of mental health discharges and 10% of substance use discharges are readmitted within 30 days Percent of index stays with at least one readmission within 30 days of discharge, by type of diagnosis, gender and age, 2013 Mental disorder readmissions Substance use-related readmissions Injuries, poisonings, drug toxicity readmissions 16% 14. 3% 12. 7% 12% 10% 14. 2% 14. 1% 10. 7% 11. 1% 10. 9% 9. 5% 9. 0% 8% 7. 3% 6. 8% 6% 4. 7% 4% 2. 2% 2% 0% Overall Male 2. 1% Female 2. 2% Ages 18 -44 2. 8% Ages 45 -64 Source: HCUP National Inpatient Sample (NIS), 2013, Agency for Healthcare Research and Quality (AHRQ). Available at: http: //hcupnet. ahrq. gov/HCUPnet. jsp? Id=950 EC 07 F 11 A 888 AF&Form=Disp. Tab&Go. To=Sel. DXPR&JS=Y (Accessed on March 16, 2016). Peterson-Kaiser Health System Tracker 1. 9% Ages 65+
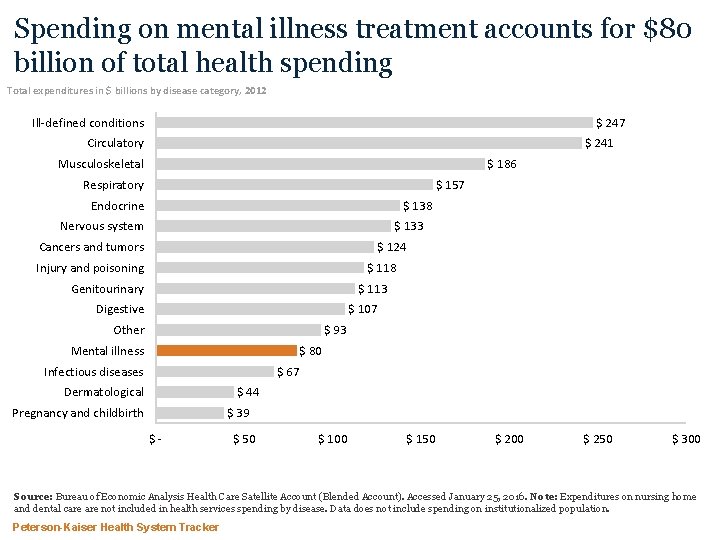
Spending on mental illness treatment accounts for $80 billion of total health spending Total expenditures in $ billions by disease category, 2012 Ill-defined conditions $ 247 $ 241 Circulatory $ 186 Musculoskeletal Respiratory $ 157 Endocrine $ 138 Nervous system $ 133 Cancers and tumors $ 124 Injury and poisoning $ 118 $ 113 Genitourinary Digestive $ 107 Other $ 93 Mental illness $ 80 Infectious diseases $ 67 Dermatological $ 44 Pregnancy and childbirth $ 39 $- $ 50 $ 100 $ 150 $ 200 $ 250 $ 300 Source: Bureau of Economic Analysis Health Care Satellite Account (Blended Account). Accessed January 25, 2016. Note: Expenditures on nursing home and dental care not included in health services spending by disease. Data does not include spending on institutionalized population. Peterson-Kaiser Health System Tracker
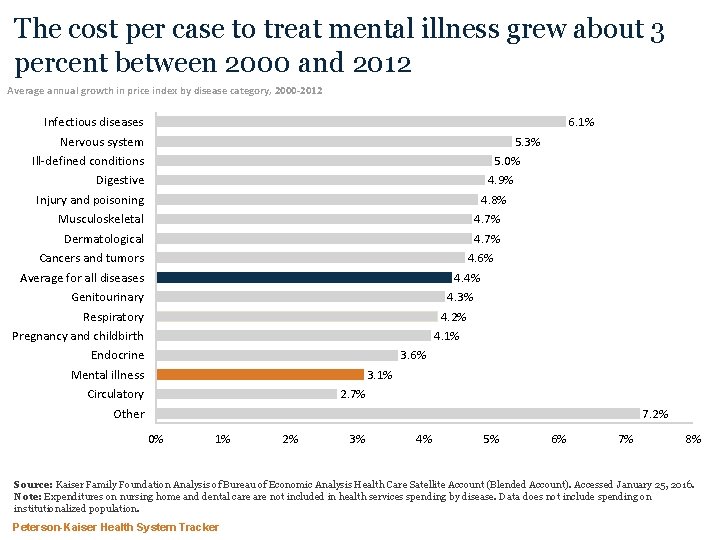
The cost per case to treat mental illness grew about 3 percent between 2000 and 2012 Average annual growth in price index by disease category, 2000 -2012 Infectious diseases Nervous system Ill-defined conditions Digestive Injury and poisoning Musculoskeletal Dermatological Cancers and tumors Average for all diseases Genitourinary Respiratory Pregnancy and childbirth Endocrine Mental illness Circulatory Other 6. 1% 5. 3% 5. 0% 4. 9% 4. 8% 4. 7% 4. 6% 4. 4% 4. 3% 4. 2% 4. 1% 3. 6% 3. 1% 2. 7% 7. 2% 0% 1% 2% 3% 4% 5% 6% 7% 8% Source: Kaiser Family Foundation Analysis of Bureau of Economic Analysis Health Care Satellite Account (Blended Account). Accessed January 25, 2016. Note: Expenditures on nursing home and dental care not included in health services spending by disease. Data does not include spending on institutionalized population. Peterson-Kaiser Health System Tracker
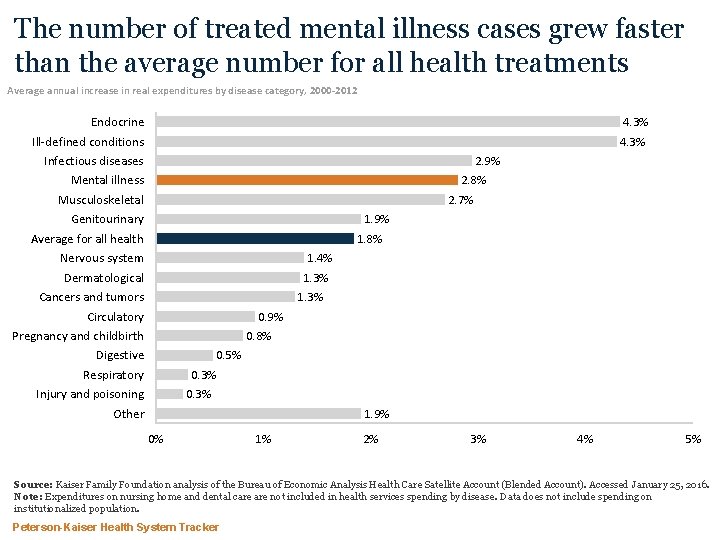
The number of treated mental illness cases grew faster than the average number for all health treatments Average annual increase in real expenditures by disease category, 2000 -2012 Endocrine Ill-defined conditions Infectious diseases Mental illness Musculoskeletal Genitourinary Average for all health Nervous system Dermatological Cancers and tumors Circulatory Pregnancy and childbirth Digestive Respiratory Injury and poisoning Other 4. 3% 2. 9% 2. 8% 2. 7% 1. 9% 1. 8% 1. 4% 1. 3% 0. 9% 0. 8% 0. 5% 0. 3% 1. 9% 0% 1% 2% 3% 4% 5% Source: Kaiser Family Foundation analysis of the Bureau of Economic Analysis Health Care Satellite Account (Blended Account). Accessed January 25, 2016. Note: Expenditures on nursing home and dental care not included in health services spending by disease. Data does not include spending on institutionalized population. Peterson-Kaiser Health System Tracker
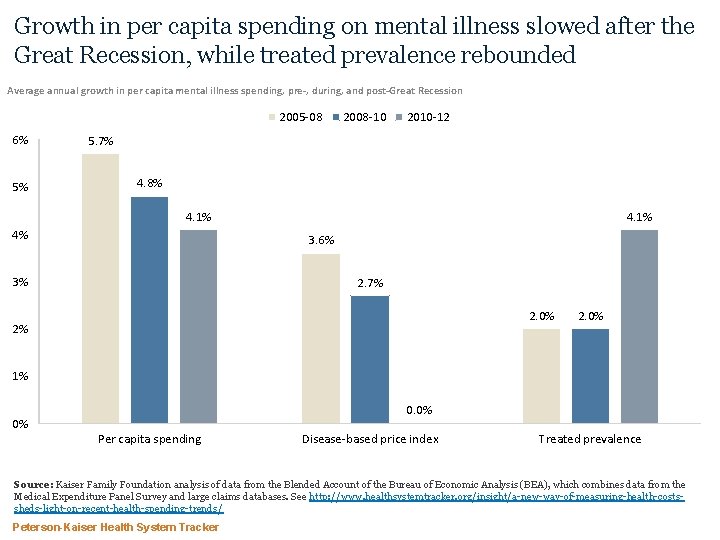
Growth in per capita spending on mental illness slowed after the Great Recession, while treated prevalence rebounded Average annual growth in per capita mental illness spending, pre-, during, and post-Great Recession 2005 -08 6% 5% 2008 -10 2010 -12 5. 7% 4. 8% 4. 1% 4% 4. 1% 3. 6% 3% 2. 7% 2. 0% 2% 2. 0% 1% 0% 0. 0% Per capita spending Disease-based price index Treated prevalence Source: Kaiser Family Foundation analysis of data from the Blended Account of the Bureau of Economic Analysis (BEA), which combines data from the Medical Expenditure Panel Survey and large claims databases. See http: //www. healthsystemtracker. org/insight/a-new-way-of-measuring-health-costssheds-light-on-recent-health-spending-trends/ Peterson-Kaiser Health System Tracker
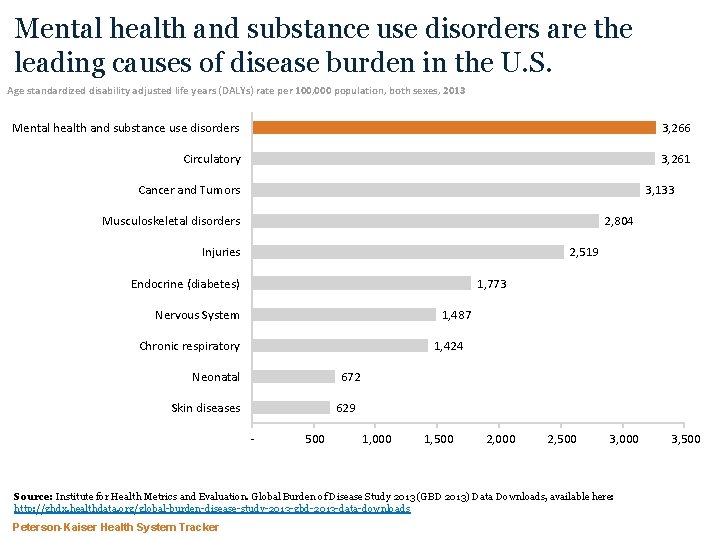
Mental health and substance use disorders are the leading causes of disease burden in the U. S. Age standardized disability adjusted life years (DALYs) rate per 100, 000 population, both sexes, 2013 Mental health and substance use disorders 3, 266 Circulatory 3, 261 3, 133 Cancer and Tumors 2, 804 Musculoskeletal disorders Injuries 2, 519 Endocrine (diabetes) 1, 773 Nervous System 1, 487 Chronic respiratory 1, 424 Neonatal 672 Skin diseases 629 - 500 1, 000 1, 500 2, 000 2, 500 3, 000 Source: Institute for Health Metrics and Evaluation. Global Burden of Disease Study 2013 (GBD 2013) Data Downloads, available here: http: //ghdx. healthdata. org/global-burden-disease-study-2013 -gbd-2013 -data-downloads Peterson-Kaiser Health System Tracker 3, 500
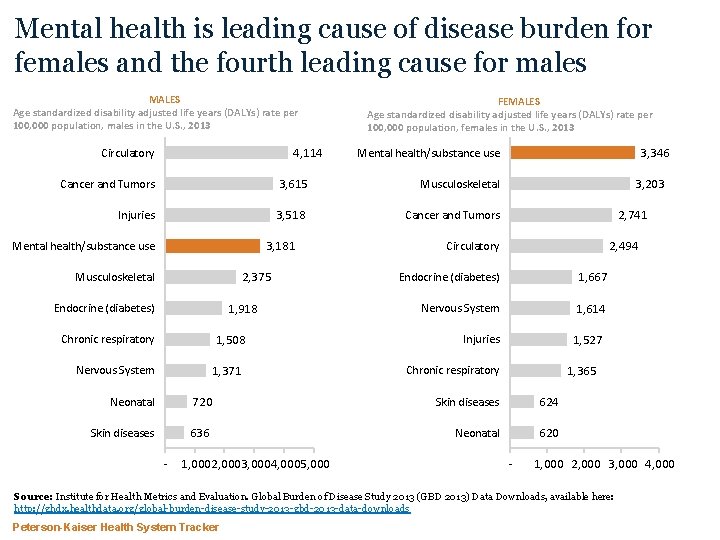
Mental health is leading cause of disease burden for females and the fourth leading cause for males MALES Age standardized disability adjusted life years (DALYs) rate per 100, 000 population, males in the U. S. , 2013 4, 114 Circulatory FEMALES Age standardized disability adjusted life years (DALYs) rate per 100, 000 population, females in the U. S. , 2013 Cancer and Tumors 3, 615 Musculoskeletal Injuries 3, 518 Cancer and Tumors 3, 181 Mental health/substance use 2, 375 Musculoskeletal 1, 918 Endocrine (diabetes) 1, 508 Chronic respiratory 1, 371 Nervous System 3, 346 Mental health/substance use 3, 203 2, 741 2, 494 Circulatory Endocrine (diabetes) 1, 667 Nervous System 1, 614 Injuries 1, 527 1, 365 Chronic respiratory Neonatal 720 Skin diseases 624 Skin diseases 636 Neonatal 620 - 1, 0002, 0003, 0004, 0005, 000 - 1, 000 2, 000 3, 000 4, 000 Source: Institute for Health Metrics and Evaluation. Global Burden of Disease Study 2013 (GBD 2013) Data Downloads, available here: http: //ghdx. healthdata. org/global-burden-disease-study-2013 -gbd-2013 -data-downloads Peterson-Kaiser Health System Tracker
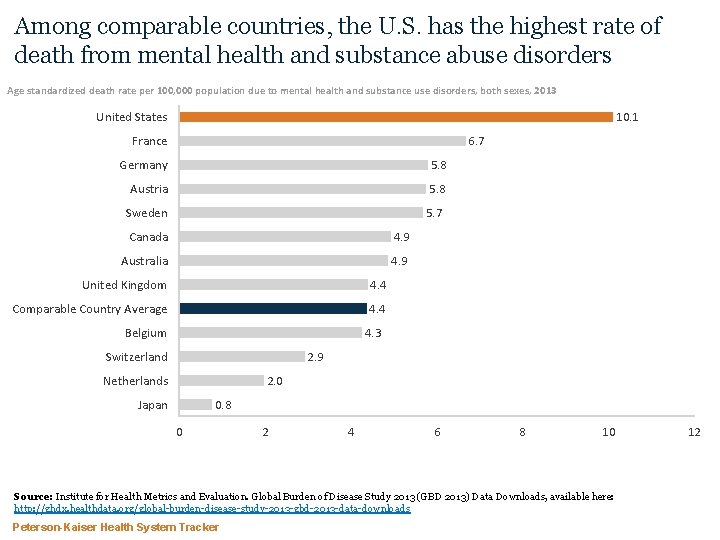
Among comparable countries, the U. S. has the highest rate of death from mental health and substance abuse disorders Age standardized death rate per 100, 000 population due to mental health and substance use disorders, both sexes, 2013 10. 1 United States France 6. 7 Germany 5. 8 Austria 5. 8 Sweden 5. 7 Canada 4. 9 Australia 4. 9 United Kingdom 4. 4 Comparable Country Average 4. 4 Belgium 4. 3 Switzerland 2. 9 Netherlands 2. 0 Japan 0. 8 0 2 4 6 8 10 Source: Institute for Health Metrics and Evaluation. Global Burden of Disease Study 2013 (GBD 2013) Data Downloads, available here: http: //ghdx. healthdata. org/global-burden-disease-study-2013 -gbd-2013 -data-downloads Peterson-Kaiser Health System Tracker 12
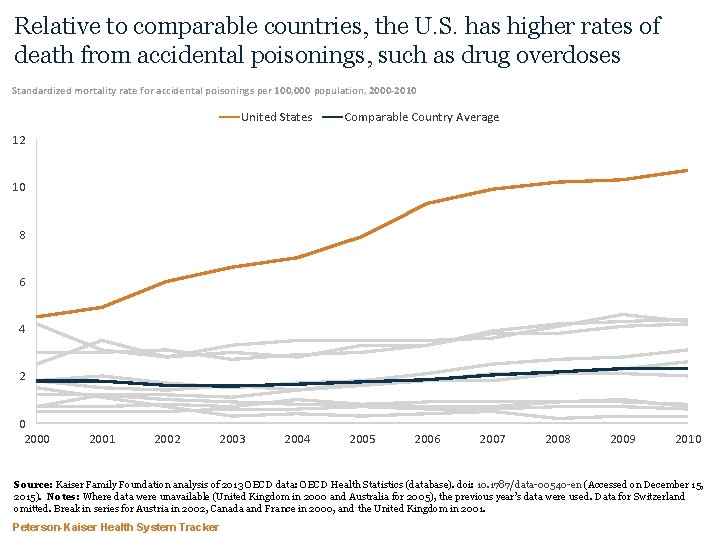
Relative to comparable countries, the U. S. has higher rates of death from accidental poisonings, such as drug overdoses Standardized mortality rate for accidental poisonings per 100, 000 population, 2000 -2010 United States Comparable Country Average 12 10 8 6 4 2 0 2001 2002 2003 2004 2005 2006 2007 2008 2009 2010 Source: Kaiser Family Foundation analysis of 2013 OECD data: OECD Health Statistics (database). doi: 10. 1787/data-00540 -en (Accessed on December 15, 2015). Notes: Where data were unavailable (United Kingdom in 2000 and Australia for 2005), the previous year’s data were used. Data for Switzerland omitted. Break in series for Austria in 2002, Canada and France in 2000, and the United Kingdom in 2001. Peterson-Kaiser Health System Tracker
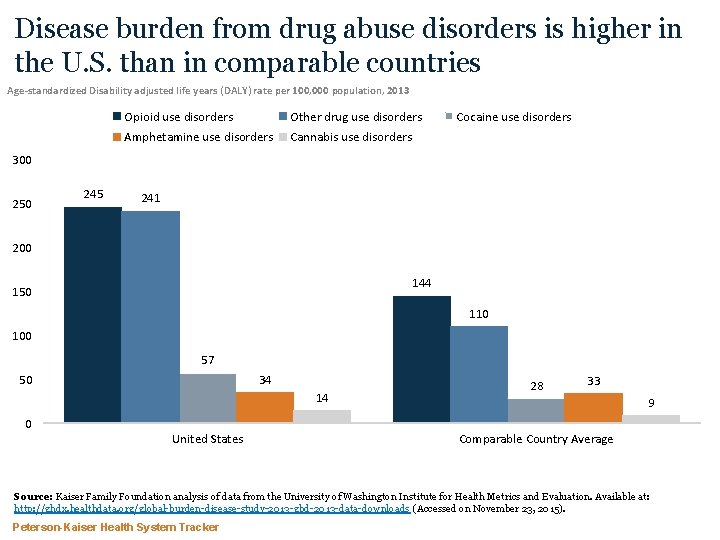
Disease burden from drug abuse disorders is higher in the U. S. than in comparable countries Age-standardized Disability adjusted life years (DALY) rate per 100, 000 population, 2013 Opioid use disorders Other drug use disorders Amphetamine use disorders Cannabis use disorders Cocaine use disorders 300 250 245 241 200 144 150 110 100 57 50 34 14 0 United States 28 33 9 Comparable Country Average Source: Kaiser Family Foundation analysis of data from the University of Washington Institute for Health Metrics and Evaluation. Available at: http: //ghdx. healthdata. org/global-burden-disease-study-2013 -gbd-2013 -data-downloads (Accessed on November 23, 2015). Peterson-Kaiser Health System Tracker
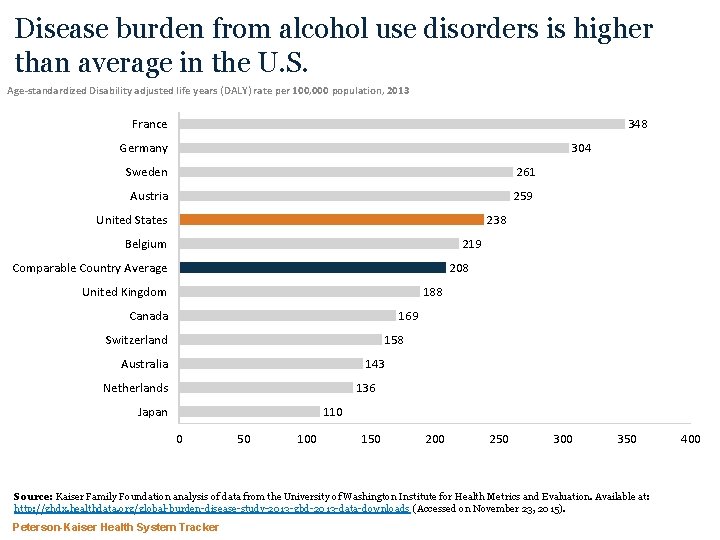
Disease burden from alcohol use disorders is higher than average in the U. S. Age-standardized Disability adjusted life years (DALY) rate per 100, 000 population, 2013 348 France Germany 304 Sweden 261 Austria 259 United States 238 Belgium 219 Comparable Country Average 208 United Kingdom 188 169 Canada Switzerland 158 Australia 143 Netherlands 136 Japan 110 0 50 100 150 200 250 300 350 Source: Kaiser Family Foundation analysis of data from the University of Washington Institute for Health Metrics and Evaluation. Available at: http: //ghdx. healthdata. org/global-burden-disease-study-2013 -gbd-2013 -data-downloads (Accessed on November 23, 2015). Peterson-Kaiser Health System Tracker 400