TAU Performance System Tutorial at 12 th ACTS

![Compile-Time Environment Variables • Optional parameters for TAU_OPTIONS: [tau_compiler. sh –help] -opt. Verbose Turn Compile-Time Environment Variables • Optional parameters for TAU_OPTIONS: [tau_compiler. sh –help] -opt. Verbose Turn](https://slidetodoc.com/presentation_image_h2/6a771bd80c74a93dfebab9d90c6bcdd4/image-29.jpg)
![HDF 5 Library Wrapping [sameer@zorak]$ tau_gen_wrapper hdf 5. h /usr/libhdf 5. a -f select. HDF 5 Library Wrapping [sameer@zorak]$ tau_gen_wrapper hdf 5. h /usr/libhdf 5. a -f select.](https://slidetodoc.com/presentation_image_h2/6a771bd80c74a93dfebab9d90c6bcdd4/image-38.jpg)
![Instrumentation Specification % tau_instrumentor Usage : tau_instrumentor <pdbfile> <sourcefile> [-o <outputfile>] [-noinline] [ -g Instrumentation Specification % tau_instrumentor Usage : tau_instrumentor <pdbfile> <sourcefile> [-o <outputfile>] [-noinline] [ -g](https://slidetodoc.com/presentation_image_h2/6a771bd80c74a93dfebab9d90c6bcdd4/image-63.jpg)
![Para. Ver [http: //www. bsc. es/paraver] Para. Ver [http: //www. bsc. es/paraver]](https://slidetodoc.com/presentation_image_h2/6a771bd80c74a93dfebab9d90c6bcdd4/image-76.jpg)

![PAPI Utilities: papi_avail $ utils/papi_avail -h Usage: utils/papi_avail [options] Options: General command options: -a, PAPI Utilities: papi_avail $ utils/papi_avail -h Usage: utils/papi_avail [options] Options: General command options: -a,](https://slidetodoc.com/presentation_image_h2/6a771bd80c74a93dfebab9d90c6bcdd4/image-142.jpg)
![PAPI Utilities: papi_avail [CONTINUED…] ----------------------------------------The following correspond to fields in the PAPI_event_info_t structure. Name PAPI Utilities: papi_avail [CONTINUED…] ----------------------------------------The following correspond to fields in the PAPI_event_info_t structure. Name](https://slidetodoc.com/presentation_image_h2/6a771bd80c74a93dfebab9d90c6bcdd4/image-144.jpg)
![PAPI Utilities: papi_avail $ utils/papi_avail -e PAPI_FP_OPS […] -------------------------------------The following correspond to fields in PAPI Utilities: papi_avail $ utils/papi_avail -e PAPI_FP_OPS […] -------------------------------------The following correspond to fields in](https://slidetodoc.com/presentation_image_h2/6a771bd80c74a93dfebab9d90c6bcdd4/image-145.jpg)
![PAPI Utilities: papi_native_avail UNIX> utils/papi_native_avail Available native events and hardware information. ----------------------------------------[…] Event Code PAPI Utilities: papi_native_avail UNIX> utils/papi_native_avail Available native events and hardware information. ----------------------------------------[…] Event Code](https://slidetodoc.com/presentation_image_h2/6a771bd80c74a93dfebab9d90c6bcdd4/image-146.jpg)
![PAPI Utilities: papi_native_avail UNIX> utils/papi_native_avail -e DATA_CACHE_REFILLS Available native events and hardware information. ----------------------------------------[…] PAPI Utilities: papi_native_avail UNIX> utils/papi_native_avail -e DATA_CACHE_REFILLS Available native events and hardware information. ----------------------------------------[…]](https://slidetodoc.com/presentation_image_h2/6a771bd80c74a93dfebab9d90c6bcdd4/image-147.jpg)
![PAPI Utilities: papi_event_chooser $ utils/papi_event_chooser NATIVE RESOURCE_STALLS: LD_ST X 87_OPS_RETIRED INSTRUCTIONS_RETIRED […] ----------------------------------------UNHALTED_CORE_CYCLES 0 PAPI Utilities: papi_event_chooser $ utils/papi_event_chooser NATIVE RESOURCE_STALLS: LD_ST X 87_OPS_RETIRED INSTRUCTIONS_RETIRED […] ----------------------------------------UNHALTED_CORE_CYCLES 0](https://slidetodoc.com/presentation_image_h2/6a771bd80c74a93dfebab9d90c6bcdd4/image-150.jpg)

- Slides: 159

TAU Performance System® Tutorial at 12 th ACTS Workshop, Tuesday, Aug 16, 2011 Sameer Shende, Allen D. Malony, Wyatt Spear, Scott Biersdorff, Suzanne Millstein TAU team, University of Oregon sameer@cs. uoregon. edu http: //tau. uoregon. edu

Outline • Overview of TAU • New Features: – – – Support for GPGPUs Support for event based sampling in TAU Support for automatic instrumentation • Instrumentation and Measurement Options in TAU • Analysis tools: Para. Prof and Perf. Explorer • Using hardware performance metrics in PAPI • Examples 2

Background information, application examples 3

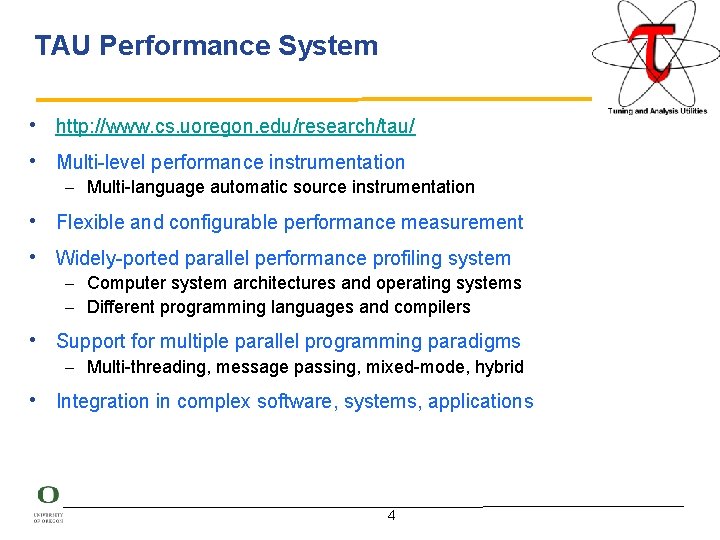
TAU Performance System • http: //www. cs. uoregon. edu/research/tau/ • Multi-level performance instrumentation – Multi-language automatic source instrumentation • Flexible and configurable performance measurement • Widely-ported parallel performance profiling system – Computer system architectures and operating systems – Different programming languages and compilers • Support for multiple parallel programming paradigms – Multi-threading, message passing, mixed-mode, hybrid • Integration in complex software, systems, applications 4

For more information • TAU Website: http: //tau. uoregon. edu – Software – Release notes – Documentation • TAU Live. DVD: http: //www. hpclinux. com – Boot up on your laptop or desktop – Includes TAU and variety of other packages – Include documentation and tutorial slides 5

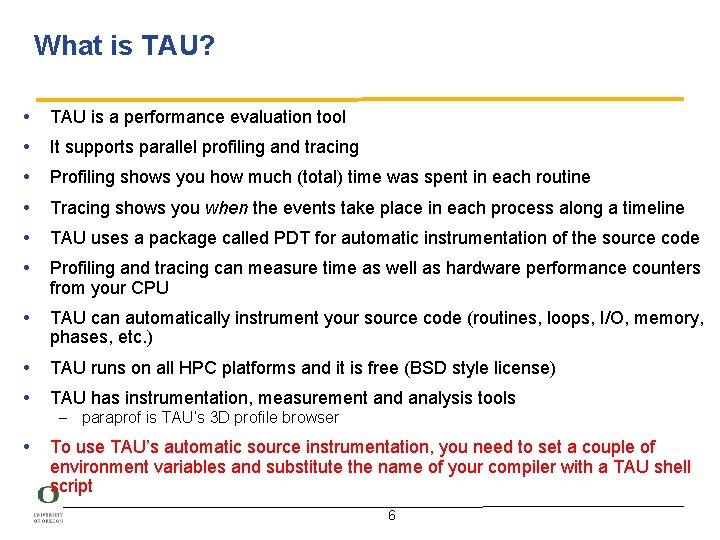
What is TAU? • • • TAU is a performance evaluation tool It supports parallel profiling and tracing Profiling shows you how much (total) time was spent in each routine Tracing shows you when the events take place in each process along a timeline TAU uses a package called PDT for automatic instrumentation of the source code Profiling and tracing can measure time as well as hardware performance counters from your CPU • TAU can automatically instrument your source code (routines, loops, I/O, memory, phases, etc. ) • TAU runs on all HPC platforms and it is free (BSD style license) • TAU has instrumentation, measurement and analysis tools – paraprof is TAU’s 3 D profile browser • To use TAU’s automatic source instrumentation, you need to set a couple of environment variables and substitute the name of your compiler with a TAU shell script 6

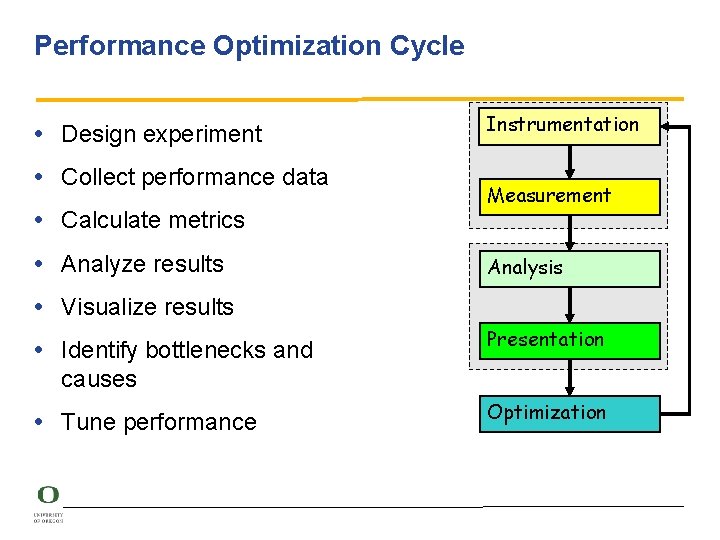
Performance Optimization Cycle • Design experiment • Collect performance data • Calculate metrics • Analyze results Instrumentation Measurement Analysis • Visualize results • Identify bottlenecks and Presentation causes • Tune performance Optimization

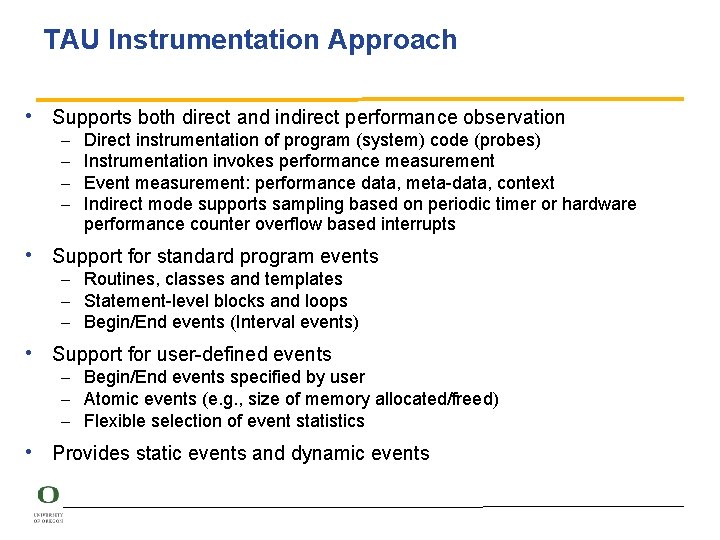
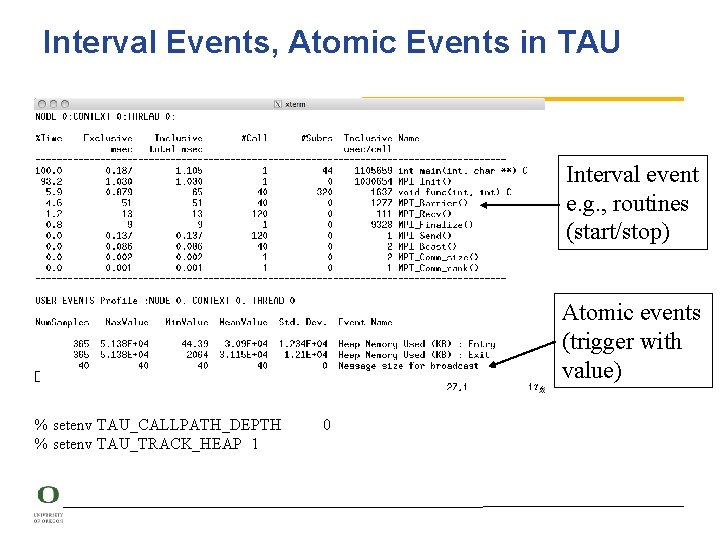
TAU Instrumentation Approach • Supports both direct and indirect performance observation – – Direct instrumentation of program (system) code (probes) Instrumentation invokes performance measurement Event measurement: performance data, meta-data, context Indirect mode supports sampling based on periodic timer or hardware performance counter overflow based interrupts • Support for standard program events – Routines, classes and templates – Statement-level blocks and loops – Begin/End events (Interval events) • Support for user-defined events – Begin/End events specified by user – Atomic events (e. g. , size of memory allocated/freed) – Flexible selection of event statistics • Provides static events and dynamic events

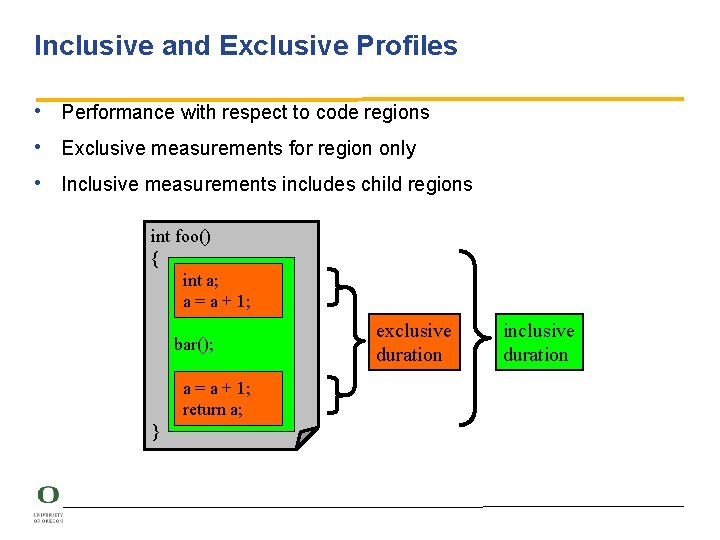
Inclusive and Exclusive Profiles • Performance with respect to code regions • Exclusive measurements for region only • Inclusive measurements includes child regions int foo() { int a; a = a + 1; bar(); a = a + 1; return a; } exclusive duration inclusive duration

Interval Events, Atomic Events in TAU Interval event e. g. , routines (start/stop) Atomic events (trigger with value) % setenv TAU_CALLPATH_DEPTH % setenv TAU_TRACK_HEAP 1 0

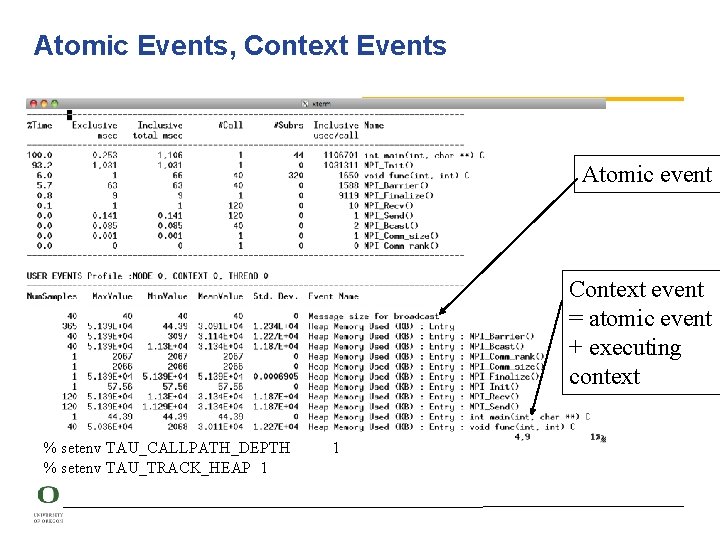
Atomic Events, Context Events Atomic event Context event = atomic event + executing context % setenv TAU_CALLPATH_DEPTH % setenv TAU_TRACK_HEAP 1 1

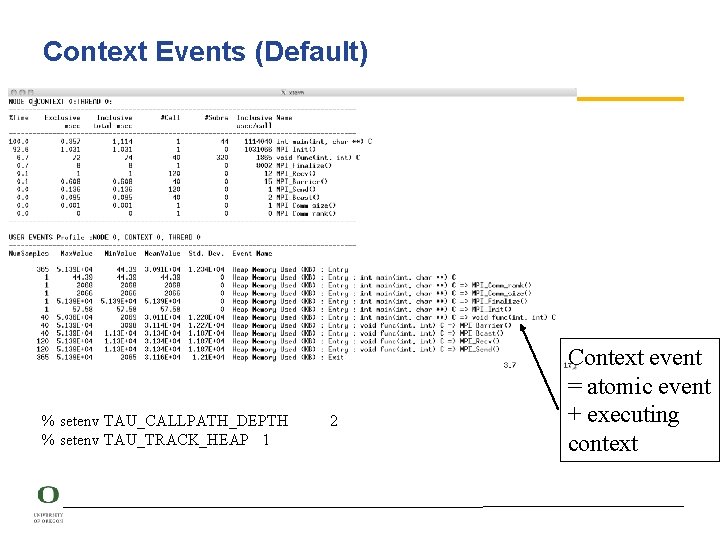
Context Events (Default) % setenv TAU_CALLPATH_DEPTH % setenv TAU_TRACK_HEAP 1 2 Context event = atomic event + executing context

Para. Prof: Mflops Sorted by Exclusive Time low mflops?

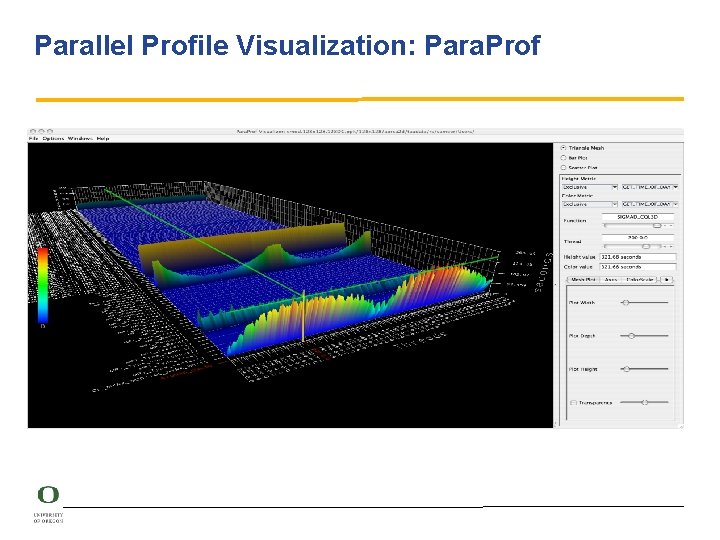
Parallel Profile Visualization: Para. Prof

Overview of different methods of instrumenting applications 15

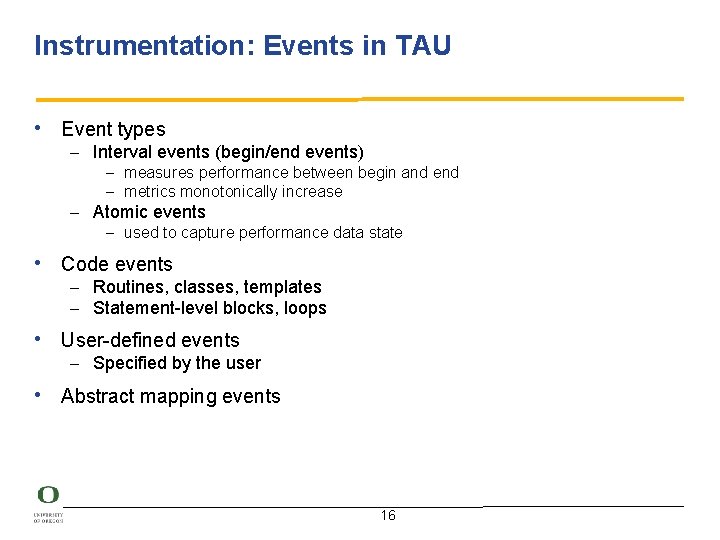
Instrumentation: Events in TAU • Event types – Interval events (begin/end events) – measures performance between begin and end – metrics monotonically increase – Atomic events – used to capture performance data state • Code events – Routines, classes, templates – Statement-level blocks, loops • User-defined events – Specified by the user • Abstract mapping events 16

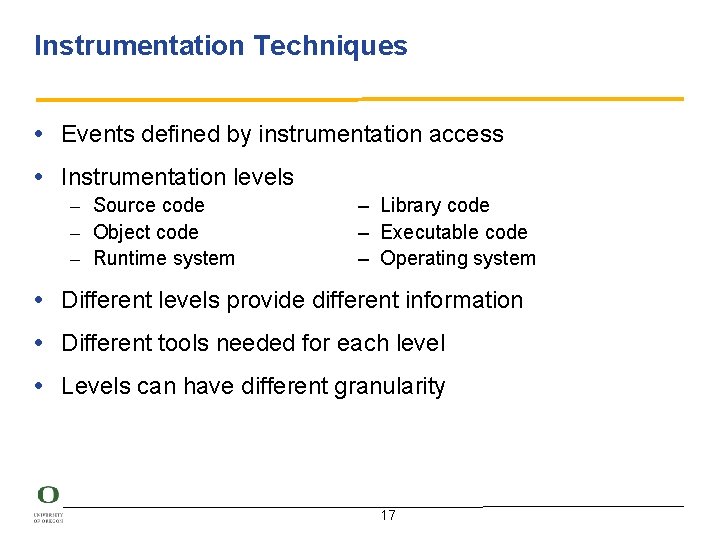
Instrumentation Techniques • Events defined by instrumentation access • Instrumentation levels – Source code – Object code – Runtime system – Library code – Executable code – Operating system • Different levels provide different information • Different tools needed for each level • Levels can have different granularity 17

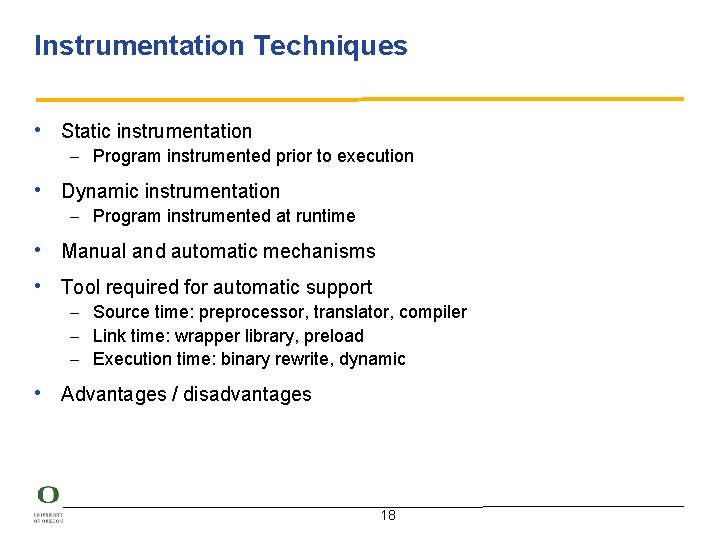
Instrumentation Techniques • Static instrumentation – Program instrumented prior to execution • Dynamic instrumentation – Program instrumented at runtime • Manual and automatic mechanisms • Tool required for automatic support – Source time: preprocessor, translator, compiler – Link time: wrapper library, preload – Execution time: binary rewrite, dynamic • Advantages / disadvantages 18

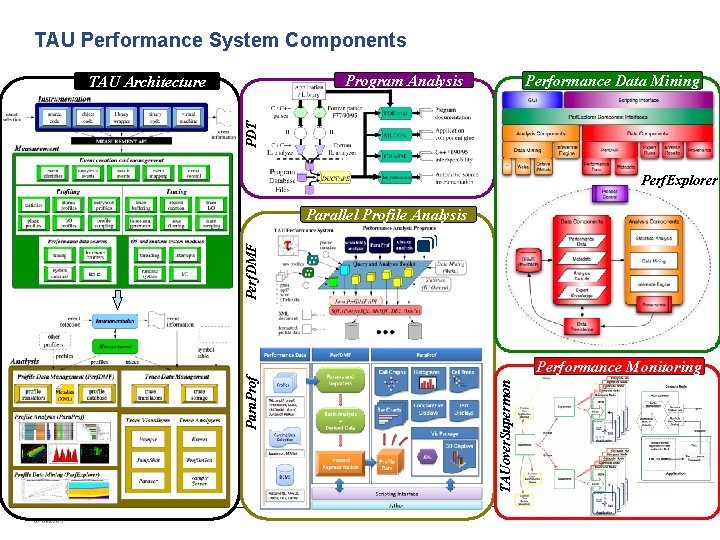
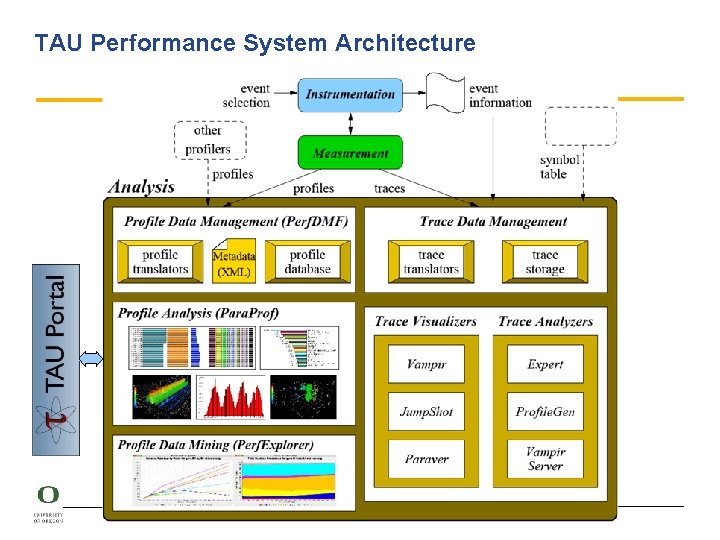
TAU Performance System Components Program Analysis Performance Data Mining PDT TAU Architecture Perf. Explorer Perf. DMF Parallel Profile Analysis TAUover. Supermon Para. Prof Performance Monitoring 19

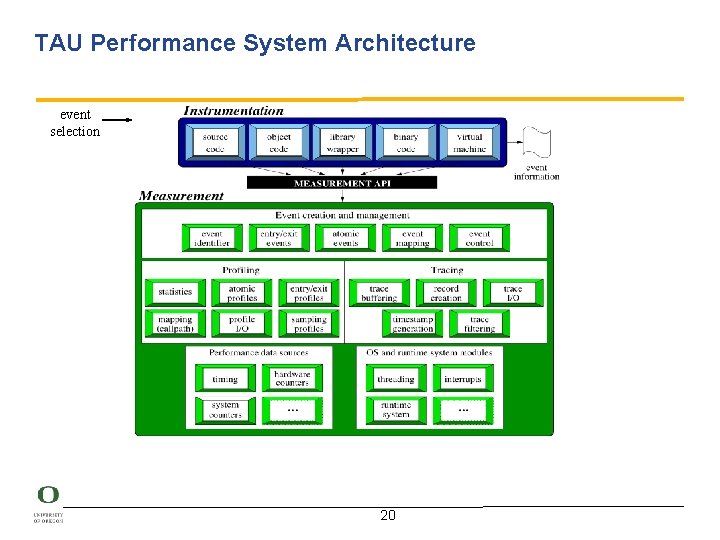
TAU Performance System Architecture event selection 20

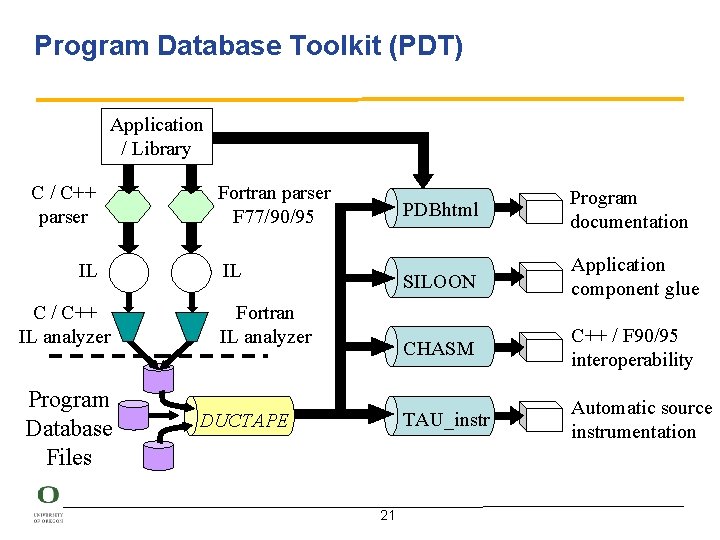
Program Database Toolkit (PDT) Application / Library C / C++ parser IL C / C++ IL analyzer Program Database Files Fortran parser F 77/90/95 IL Fortran IL analyzer DUCTAPE 21 PDBhtml Program documentation SILOON Application component glue CHASM C++ / F 90/95 interoperability TAU_instr Automatic source instrumentation

Automatic Source-Level Instrumentation in TAU using Program Database Toolkit (PDT) 22

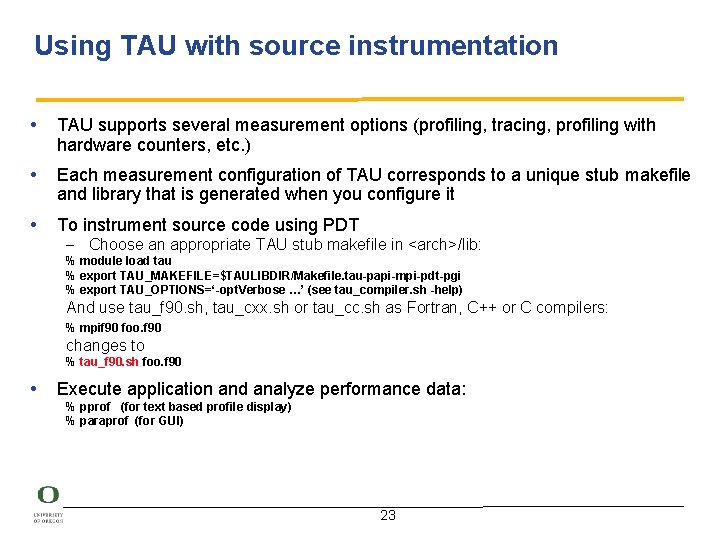
Using TAU with source instrumentation • TAU supports several measurement options (profiling, tracing, profiling with hardware counters, etc. ) • Each measurement configuration of TAU corresponds to a unique stub makefile and library that is generated when you configure it • To instrument source code using PDT – Choose an appropriate TAU stub makefile in <arch>/lib: % module load tau % export TAU_MAKEFILE=$TAULIBDIR/Makefile. tau-papi-mpi-pdt-pgi % export TAU_OPTIONS=‘-opt. Verbose …’ (see tau_compiler. sh -help) And use tau_f 90. sh, tau_cxx. sh or tau_cc. sh as Fortran, C++ or C compilers: % mpif 90 foo. f 90 changes to % tau_f 90. sh foo. f 90 • Execute application and analyze performance data: % pprof (for text based profile display) % paraprof (for GUI) 23

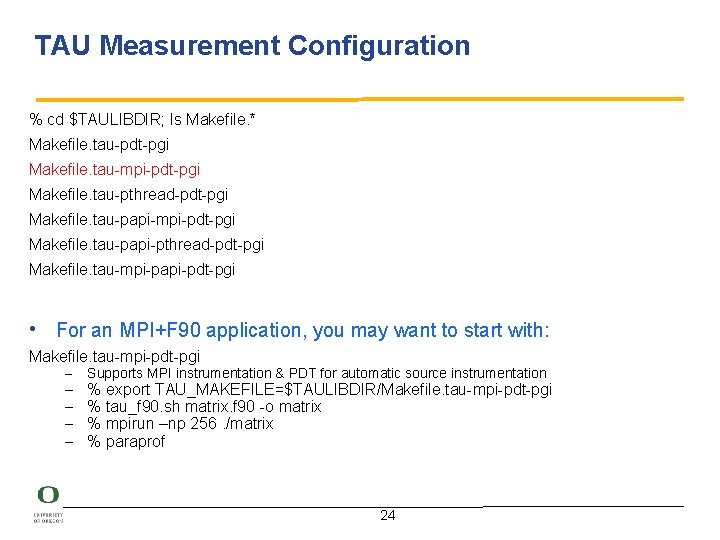
TAU Measurement Configuration % cd $TAULIBDIR; ls Makefile. * Makefile. tau-pdt-pgi Makefile. tau-mpi-pdt-pgi Makefile. tau-pthread-pdt-pgi Makefile. tau-papi-mpi-pdt-pgi Makefile. tau-papi-pthread-pdt-pgi Makefile. tau-mpi-papi-pdt-pgi • For an MPI+F 90 application, you may want to start with: Makefile. tau-mpi-pdt-pgi – – – Supports MPI instrumentation & PDT for automatic source instrumentation % export TAU_MAKEFILE=$TAULIBDIR/Makefile. tau-mpi-pdt-pgi % tau_f 90. sh matrix. f 90 -o matrix % mpirun –np 256. /matrix % paraprof 24

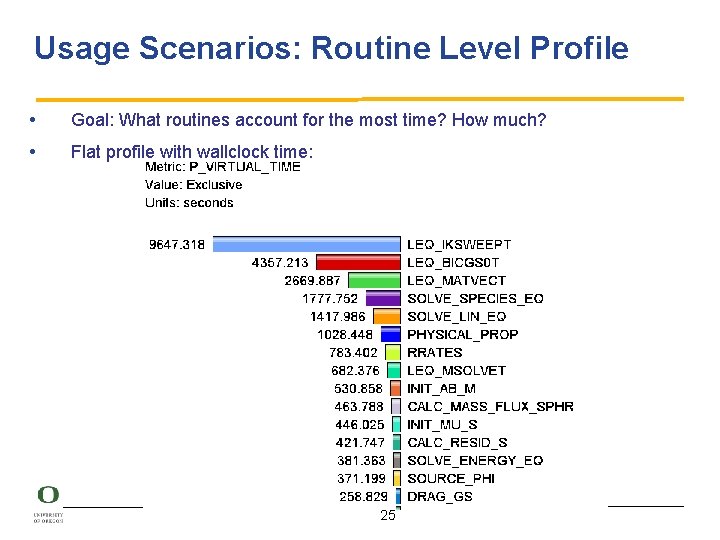
Usage Scenarios: Routine Level Profile • Goal: What routines account for the most time? How much? • Flat profile with wallclock time: 25

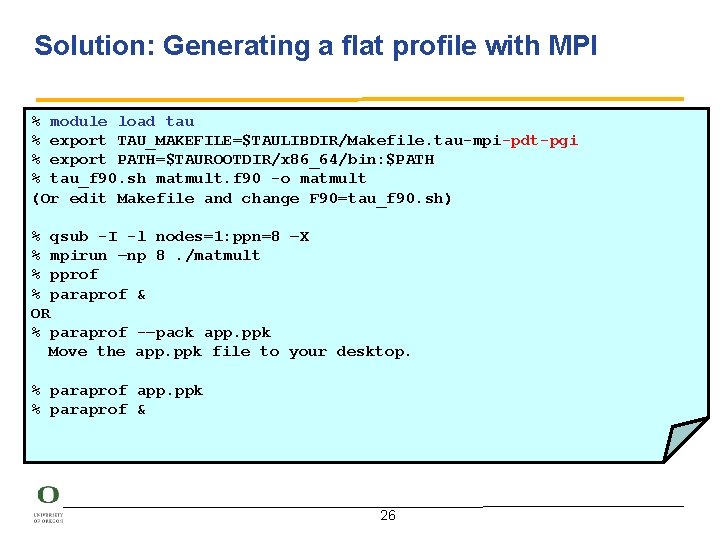
Solution: Generating a flat profile with MPI % module load tau % export TAU_MAKEFILE=$TAULIBDIR/Makefile. tau-mpi-pdt-pgi % export PATH=$TAUROOTDIR/x 86_64/bin: $PATH % tau_f 90. sh matmult. f 90 -o matmult (Or edit Makefile and change F 90=tau_f 90. sh) % qsub -I -l nodes=1: ppn=8 –X % mpirun –np 8. /matmult % pprof % paraprof & OR % paraprof -–pack app. ppk Move the app. ppk file to your desktop. % paraprof app. ppk % paraprof & 26

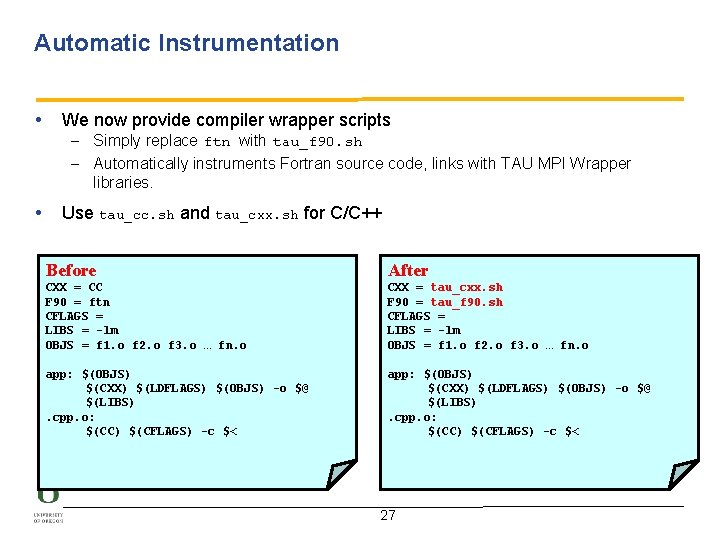
Automatic Instrumentation • We now provide compiler wrapper scripts – Simply replace ftn with tau_f 90. sh – Automatically instruments Fortran source code, links with TAU MPI Wrapper libraries. • Use tau_cc. sh and tau_cxx. sh for C/C++ Before After CXX = CC F 90 = ftn CFLAGS = LIBS = -lm OBJS = f 1. o f 2. o f 3. o … fn. o CXX = tau_cxx. sh F 90 = tau_f 90. sh CFLAGS = LIBS = -lm OBJS = f 1. o f 2. o f 3. o … fn. o app: $(OBJS) $(CXX) $(LDFLAGS) $(OBJS) -o $@ $(LIBS). cpp. o: $(CC) $(CFLAGS) -c $< 27

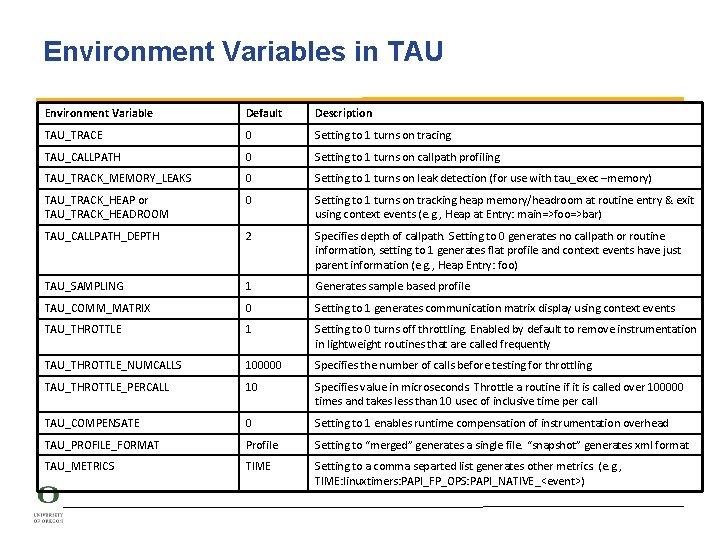
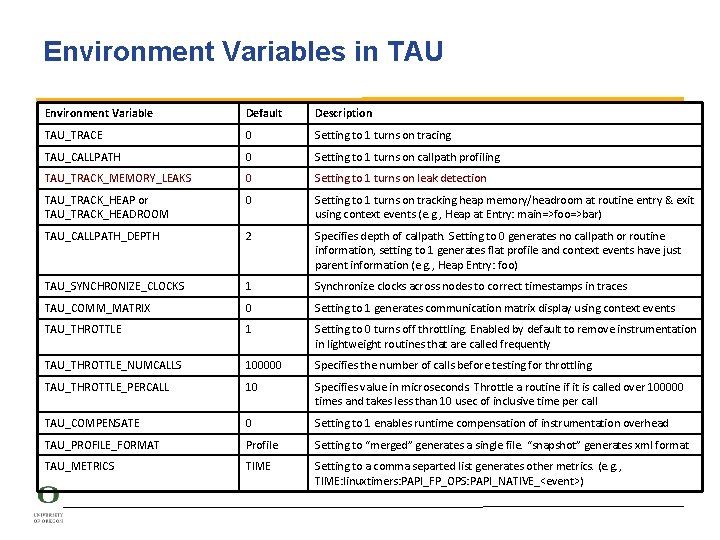
Environment Variables in TAU Environment Variable Default Description TAU_TRACE 0 Setting to 1 turns on tracing TAU_CALLPATH 0 Setting to 1 turns on callpath profiling TAU_TRACK_MEMORY_LEAKS 0 Setting to 1 turns on leak detection (for use with tau_exec –memory) TAU_TRACK_HEAP or TAU_TRACK_HEADROOM 0 Setting to 1 turns on tracking heap memory/headroom at routine entry & exit using context events (e. g. , Heap at Entry: main=>foo=>bar) TAU_CALLPATH_DEPTH 2 Specifies depth of callpath. Setting to 0 generates no callpath or routine information, setting to 1 generates flat profile and context events have just parent information (e. g. , Heap Entry: foo) TAU_SAMPLING 1 Generates sample based profile TAU_COMM_MATRIX 0 Setting to 1 generates communication matrix display using context events TAU_THROTTLE 1 Setting to 0 turns off throttling. Enabled by default to remove instrumentation in lightweight routines that are called frequently TAU_THROTTLE_NUMCALLS 100000 Specifies the number of calls before testing for throttling TAU_THROTTLE_PERCALL 10 Specifies value in microseconds. Throttle a routine if it is called over 100000 times and takes less than 10 usec of inclusive time per call TAU_COMPENSATE 0 Setting to 1 enables runtime compensation of instrumentation overhead TAU_PROFILE_FORMAT Profile Setting to “merged” generates a single file. “snapshot” generates xml format TAU_METRICS TIME Setting to a comma separted list generates other metrics. (e. g. , TIME: linuxtimers: PAPI_FP_OPS: PAPI_NATIVE_<event>)
![CompileTime Environment Variables Optional parameters for TAUOPTIONS taucompiler sh help opt Verbose Turn Compile-Time Environment Variables • Optional parameters for TAU_OPTIONS: [tau_compiler. sh –help] -opt. Verbose Turn](https://slidetodoc.com/presentation_image_h2/6a771bd80c74a93dfebab9d90c6bcdd4/image-29.jpg)
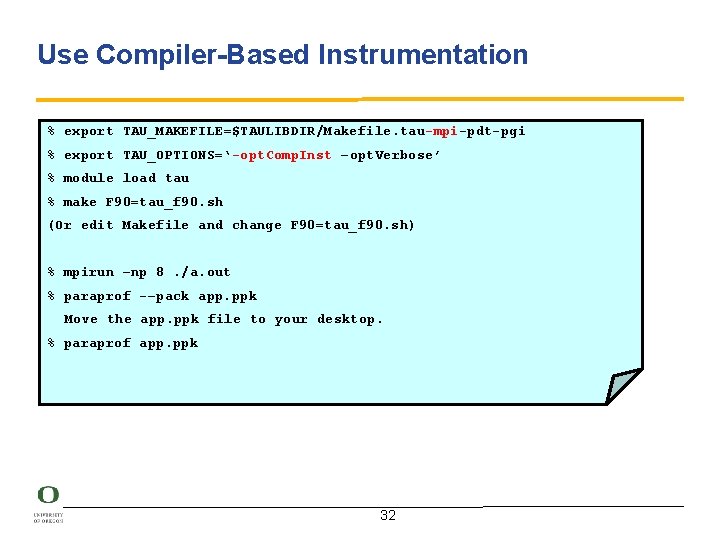
Compile-Time Environment Variables • Optional parameters for TAU_OPTIONS: [tau_compiler. sh –help] -opt. Verbose Turn on verbose debugging messages -opt. Comp. Inst Use compiler based instrumentation -opt. No. Comp. Inst Do not revert to compiler instrumentation if source instrumentation fails. -opt. Detect. Memory. Leaks Turn on debugging memory allocations/ de-allocations to track leaks -opt. Track. IO Turn on tracking POSIX IO by linking TAU’s wrapper library -opt. Keep. Files Does not remove intermediate. pdb and. inst. * files -opt. Pre. Process Preprocess Fortran sources before instrumentation -opt. Tau. Select. File="" Specify selective instrumentation file for tau_instrumentor -opt. Linking="" Options passed to the linker. Typically $(TAU_MPI_FLIBS) $(TAU_CXXLIBS) -opt. Compile="" Options passed to the compiler. Typically $(TAU_MPI_INCLUDE) $(TAU_DEFS) -opt. Pdt. F 95 Opts="" Add options for Fortran parser in PDT (f 95 parse/gfparse) -opt. Pdt. F 95 Reset="" Reset options for Fortran parser in PDT (f 95 parse/gfparse) -opt. Pdt. COpts="" Options for C parser in PDT (cparse). Typically $(TAU_MPI_INCLUDE) $(TAU_DEFS) -opt. Pdt. Cxx. Opts="" Options for C++ parser in PDT (cxxparse). Typically $(TAU_MPI_INCLUDE) $(TAU_DEFS)

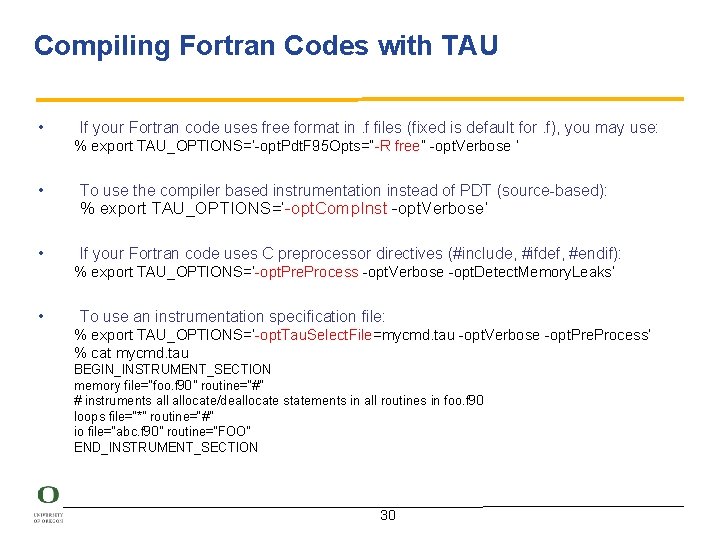
Compiling Fortran Codes with TAU • If your Fortran code uses free format in. f files (fixed is default for. f), you may use: % export TAU_OPTIONS=‘-opt. Pdt. F 95 Opts=“-R free” -opt. Verbose ’ • To use the compiler based instrumentation instead of PDT (source-based): • If your Fortran code uses C preprocessor directives (#include, #ifdef, #endif): % export TAU_OPTIONS=‘-opt. Comp. Inst -opt. Verbose’ % export TAU_OPTIONS=‘-opt. Pre. Process -opt. Verbose -opt. Detect. Memory. Leaks’ • To use an instrumentation specification file: % export TAU_OPTIONS=‘-opt. Tau. Select. File=mycmd. tau -opt. Verbose -opt. Pre. Process’ % cat mycmd. tau BEGIN_INSTRUMENT_SECTION memory file=“foo. f 90” routine=“#” # instruments allocate/deallocate statements in all routines in foo. f 90 loops file=“*” routine=“#” io file=“abc. f 90” routine=“FOO” END_INSTRUMENT_SECTION 30

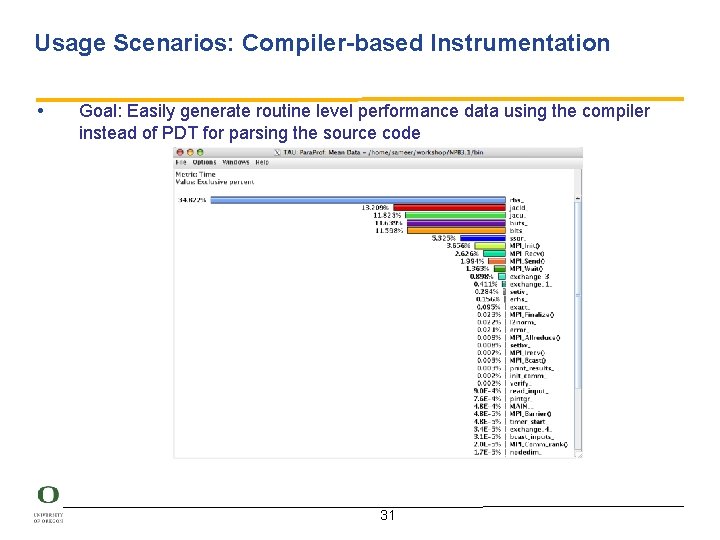
Usage Scenarios: Compiler-based Instrumentation • Goal: Easily generate routine level performance data using the compiler instead of PDT for parsing the source code 31

Use Compiler-Based Instrumentation % export TAU_MAKEFILE=$TAULIBDIR/Makefile. tau-mpi-pdt-pgi % export TAU_OPTIONS=‘-opt. Comp. Inst –opt. Verbose’ % module load tau % make F 90=tau_f 90. sh (Or edit Makefile and change F 90=tau_f 90. sh) % mpirun –np 8. /a. out % paraprof -–pack app. ppk Move the app. ppk file to your desktop. % paraprof app. ppk 32

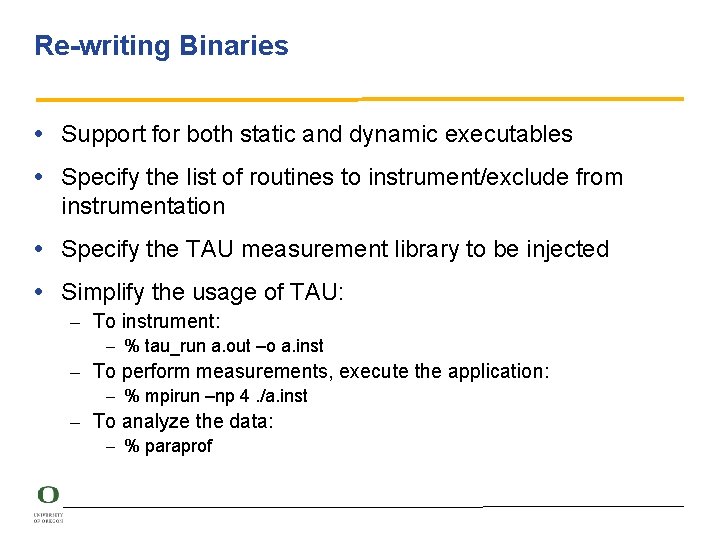
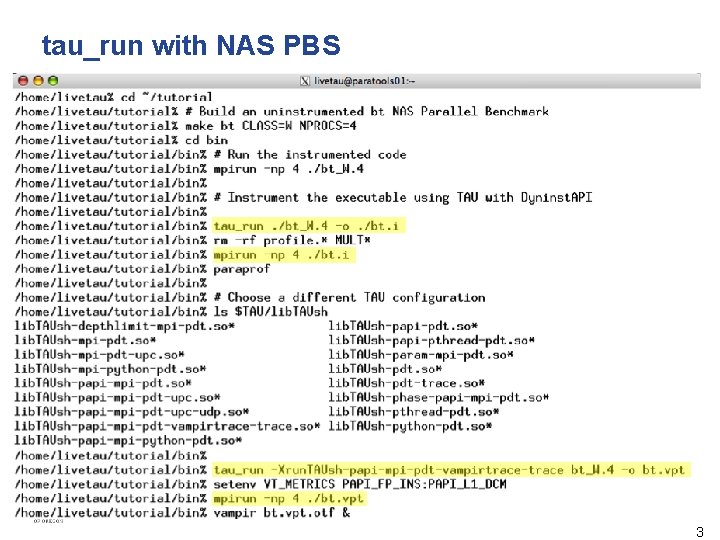
Re-writing Binaries • Support for both static and dynamic executables • Specify the list of routines to instrument/exclude from instrumentation • Specify the TAU measurement library to be injected • Simplify the usage of TAU: – To instrument: – % tau_run a. out –o a. inst – To perform measurements, execute the application: – % mpirun –np 4. /a. inst – To analyze the data: – % paraprof

tau_run with NAS PBS 3

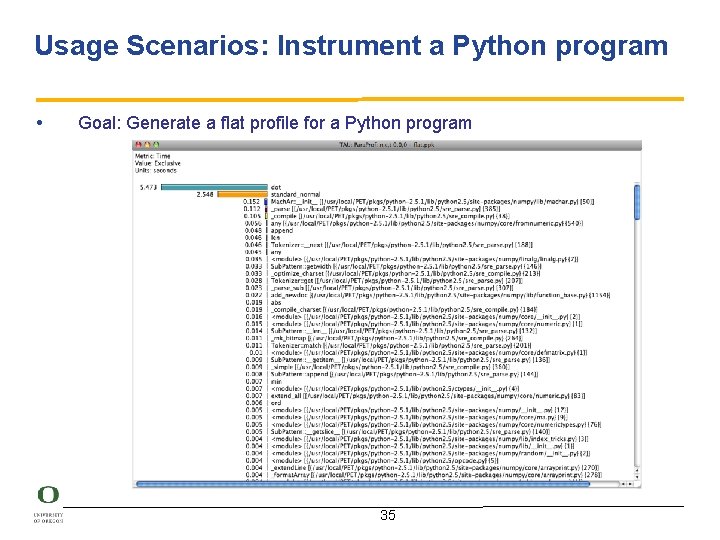
Usage Scenarios: Instrument a Python program • Goal: Generate a flat profile for a Python program 35

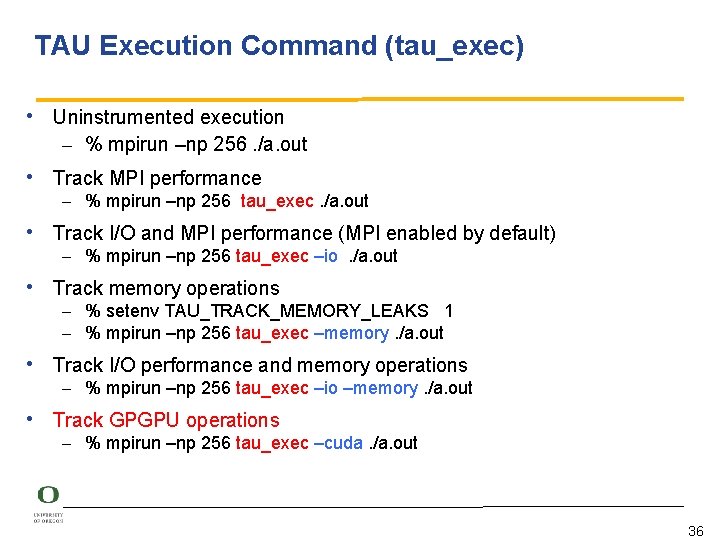
TAU Execution Command (tau_exec) • Uninstrumented execution – % mpirun –np 256. /a. out • Track MPI performance – % mpirun –np 256 tau_exec. /a. out • Track I/O and MPI performance (MPI enabled by default) – % mpirun –np 256 tau_exec –io. /a. out • Track memory operations – % setenv TAU_TRACK_MEMORY_LEAKS 1 – % mpirun –np 256 tau_exec –memory. /a. out • Track I/O performance and memory operations – % mpirun –np 256 tau_exec –io –memory. /a. out • Track GPGPU operations – % mpirun –np 256 tau_exec –cuda. /a. out 36

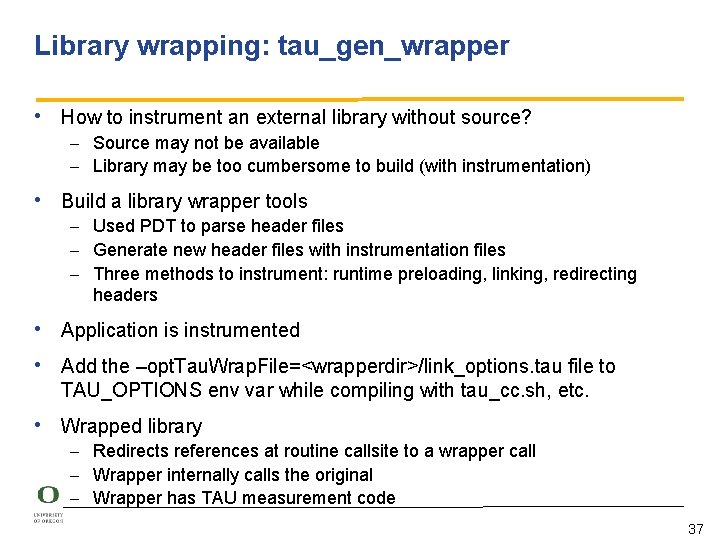
Library wrapping: tau_gen_wrapper • How to instrument an external library without source? – Source may not be available – Library may be too cumbersome to build (with instrumentation) • Build a library wrapper tools – Used PDT to parse header files – Generate new header files with instrumentation files – Three methods to instrument: runtime preloading, linking, redirecting headers • Application is instrumented • Add the –opt. Tau. Wrap. File=<wrapperdir>/link_options. tau file to TAU_OPTIONS env var while compiling with tau_cc. sh, etc. • Wrapped library – Redirects references at routine callsite to a wrapper call – Wrapper internally calls the original – Wrapper has TAU measurement code 37
![HDF 5 Library Wrapping sameerzorak taugenwrapper hdf 5 h usrlibhdf 5 a f select HDF 5 Library Wrapping [sameer@zorak]$ tau_gen_wrapper hdf 5. h /usr/libhdf 5. a -f select.](https://slidetodoc.com/presentation_image_h2/6a771bd80c74a93dfebab9d90c6bcdd4/image-38.jpg)
HDF 5 Library Wrapping [sameer@zorak]$ tau_gen_wrapper hdf 5. h /usr/libhdf 5. a -f select. tau Usage : tau_gen_wrapper <header> <library> [-r|-d|-w (default)] [-g groupname] [-i headerfile] [-c|-c++|-fortran] [ -f <instr_req_file> ] • instruments using runtime preloading (-r), or -Wl, -wrap linker (-w), redirection of header file to redefine the wrapped routine (-d) • instrumentation specification file (select. tau) • group (hdf 5) • tau_exec loads libhdf 5_wrap. so shared library using –loadlib=<libwrap_pkg. so> • creates the wrapper/ directory with -opt NODE 0; CONTEXT 0; THREAD 0: -------------------------------------------%Time Exclusive Inclusive #Call #Subrs Inclusive Name msec total msec usec/call -------------------------------------------100. 057 1 1 13 1236. TAU Application 70. 875 1 0 875 hid_t H 5 Fcreate() 9. 7 0. 12 1 0 120 herr_t H 5 Fclose() 6. 0 0. 074 1 0 74 hid_t H 5 Dcreate() 3. 1 0. 038 1 0 38 herr_t H 5 Dwrite() 2. 6 0. 032 1 0 32 herr_t H 5 Dclose() 2. 1 0. 026 1 0 26 herr_t H 5 check_version() 0. 6 0. 008 1 0 8 hid_t H 5 Screate_simple() 0. 2 0. 002 1 0 2 herr_t H 5 Tset_order() 0. 2 0. 002 1 0 2 hid_t H 5 Tcopy() 0. 1 0. 001 1 0 1 herr_t H 5 Sclose() 0. 1 0. 001 2 0 0 herr_t H 5 open() 0. 0 0 0 1 0 0 herr_t H 5 Tclose() 38

Profiling GPGPU Executions • GPGPU compilers (e. g. , CAPS hmpp and PGI) can now automatically generate GPGPU code using manual annotation of loop-level constructs and routines (hmpp) • The loops (and routines for HMPP) are transferred automatically to the GPGPU • TAU intercepts the runtime library routines and examines the arguments • Shows events as seen from the host • Profiles and traces GPGPU execution

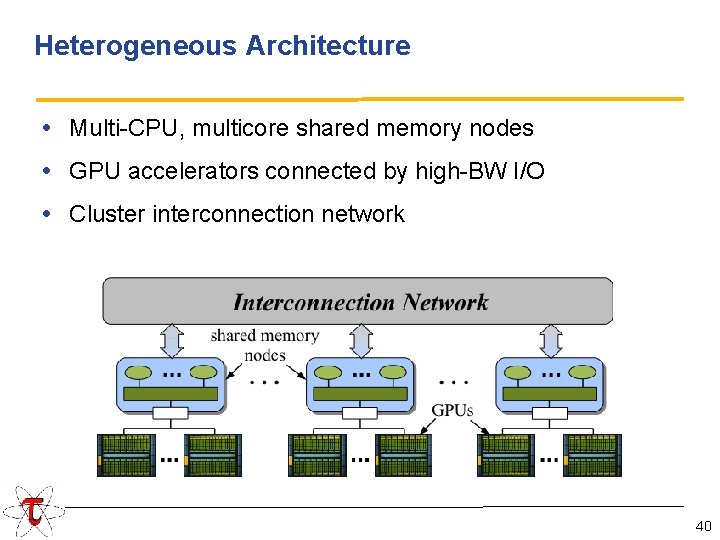
Heterogeneous Architecture • Multi-CPU, multicore shared memory nodes • GPU accelerators connected by high-BW I/O • Cluster interconnection network 40

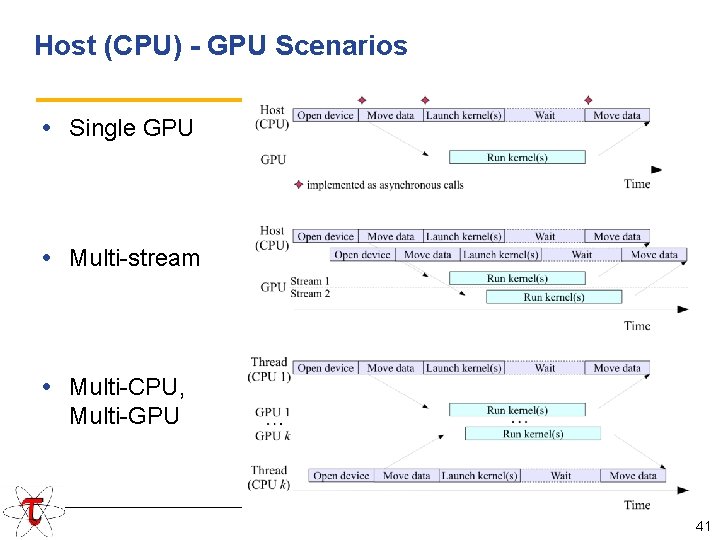
Host (CPU) - GPU Scenarios • Single GPU • Multi-stream • Multi-CPU, Multi-GPU 41

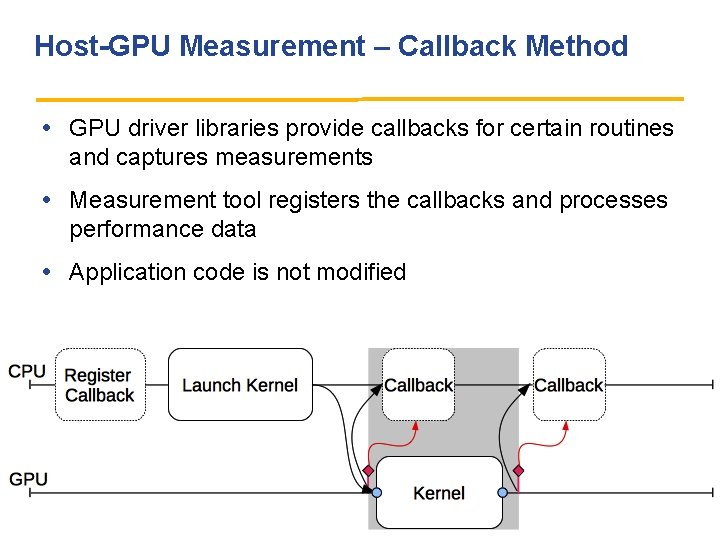
Host-GPU Measurement – Callback Method • GPU driver libraries provide callbacks for certain routines and captures measurements • Measurement tool registers the callbacks and processes performance data • Application code is not modified 42

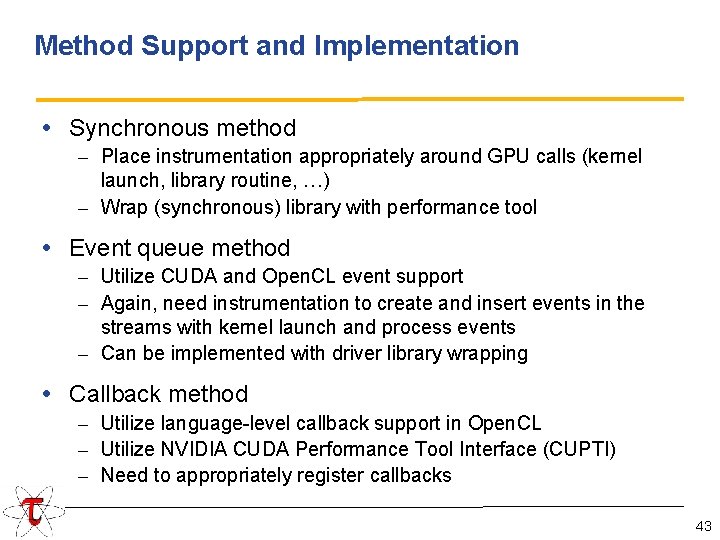
Method Support and Implementation • Synchronous method – Place instrumentation appropriately around GPU calls (kernel launch, library routine, …) – Wrap (synchronous) library with performance tool • Event queue method – Utilize CUDA and Open. CL event support – Again, need instrumentation to create and insert events in the streams with kernel launch and process events – Can be implemented with driver library wrapping • Callback method – Utilize language-level callback support in Open. CL – Utilize NVIDIA CUDA Performance Tool Interface (CUPTI) – Need to appropriately register callbacks 43

GPU Performance Measurement Tools • Support the Host-GPU performance perspective • Provide integration with existing measurement system to facilitate tool use • Utilize support in GPU driver library and device • Tools – – TAU performance system Vampir PAPI NVIDIA CUPTI 44

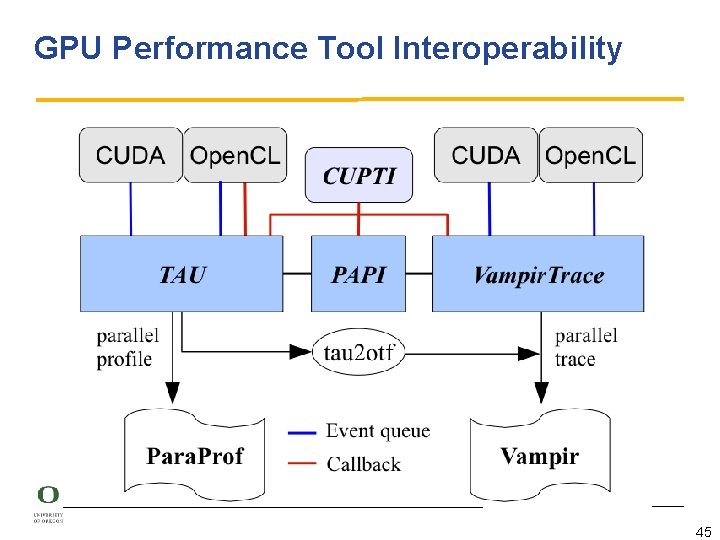
GPU Performance Tool Interoperability 45

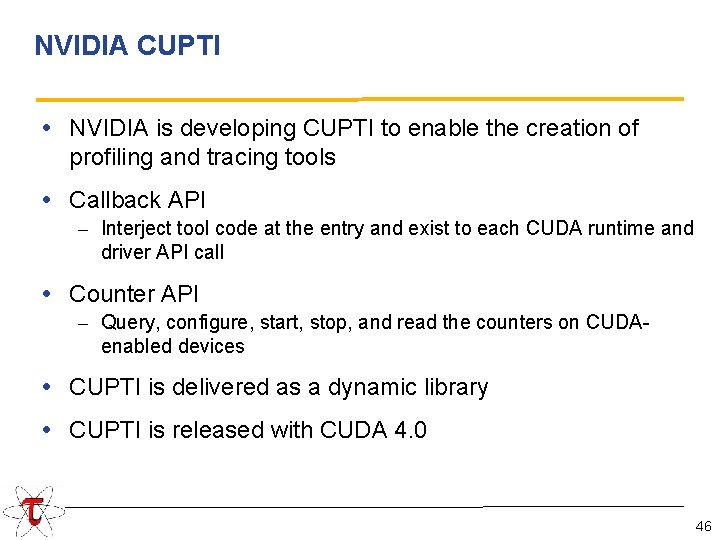
NVIDIA CUPTI • NVIDIA is developing CUPTI to enable the creation of profiling and tracing tools • Callback API – Interject tool code at the entry and exist to each CUDA runtime and driver API call • Counter API – Query, configure, start, stop, and read the counters on CUDAenabled devices • CUPTI is delivered as a dynamic library • CUPTI is released with CUDA 4. 0 46

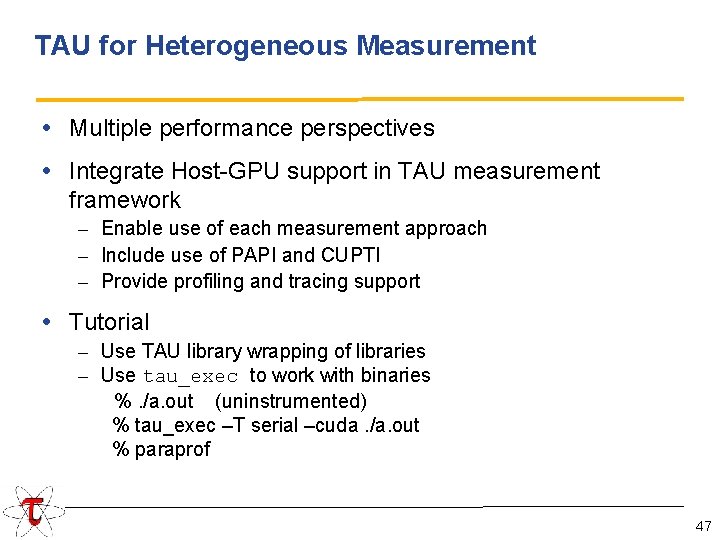
TAU for Heterogeneous Measurement • Multiple performance perspectives • Integrate Host-GPU support in TAU measurement framework – Enable use of each measurement approach – Include use of PAPI and CUPTI – Provide profiling and tracing support • Tutorial – Use TAU library wrapping of libraries – Use tau_exec to work with binaries %. /a. out (uninstrumented) % tau_exec –T serial –cuda. /a. out % paraprof 47

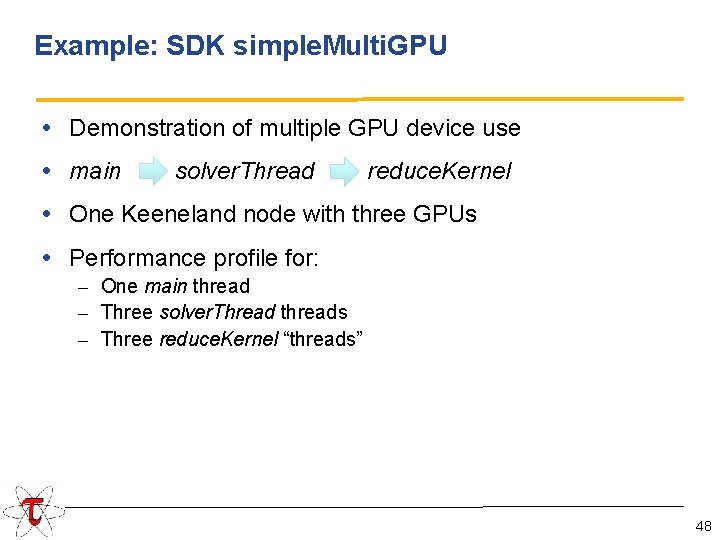
Example: SDK simple. Multi. GPU • Demonstration of multiple GPU device use • main solver. Thread reduce. Kernel • One Keeneland node with three GPUs • Performance profile for: – One main thread – Three solver. Thread threads – Three reduce. Kernel “threads” 48

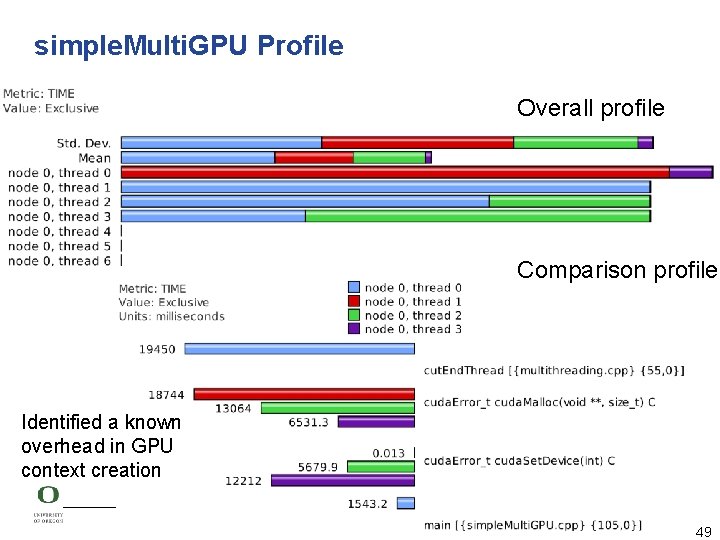
simple. Multi. GPU Profile Overall profile Comparison profile Identified a known overhead in GPU context creation 49

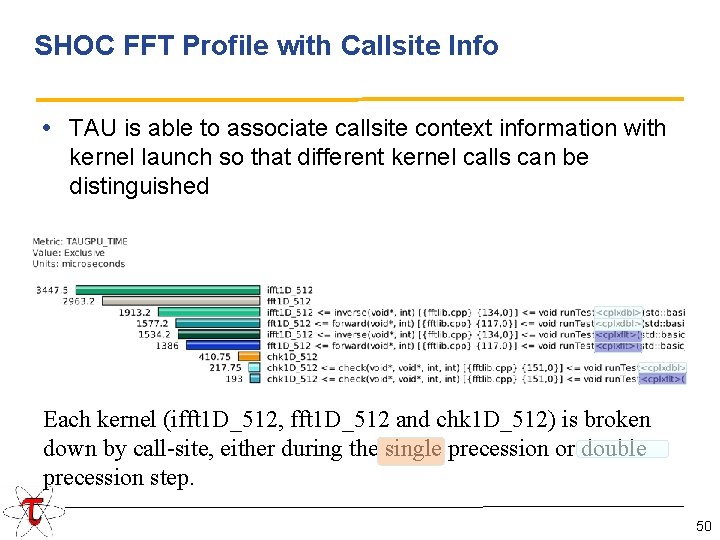
SHOC FFT Profile with Callsite Info • TAU is able to associate callsite context information with kernel launch so that different kernel calls can be distinguished Each kernel (ifft 1 D_512, fft 1 D_512 and chk 1 D_512) is broken down by call-site, either during the single precession or double precession step. 50

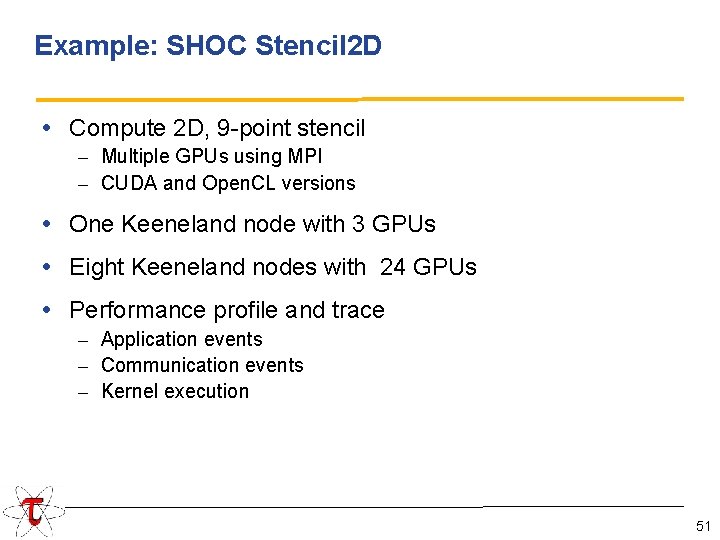
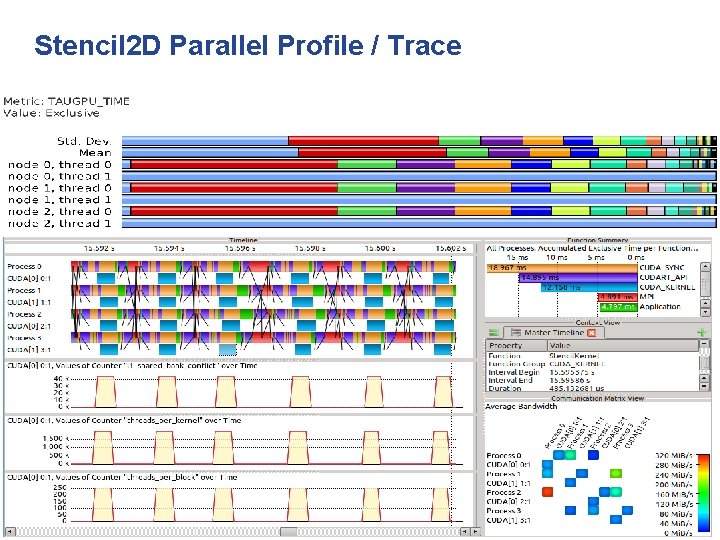
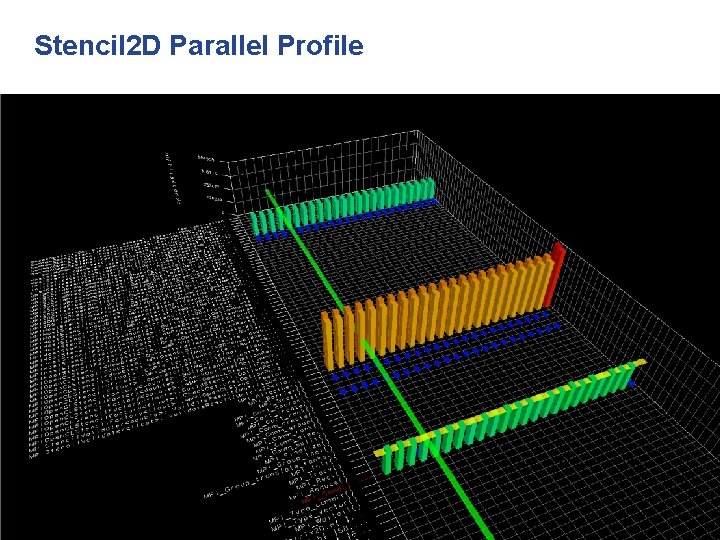
Example: SHOC Stencil 2 D • Compute 2 D, 9 -point stencil – Multiple GPUs using MPI – CUDA and Open. CL versions • One Keeneland node with 3 GPUs • Eight Keeneland nodes with 24 GPUs • Performance profile and trace – Application events – Communication events – Kernel execution 51

Stencil 2 D Parallel Profile / Trace 52

Stencil 2 D Parallel Profile 53

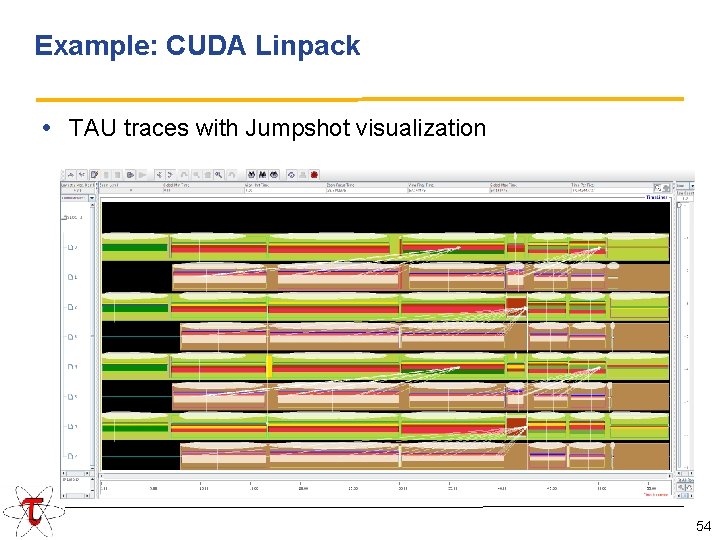
Example: CUDA Linpack • TAU traces with Jumpshot visualization 54

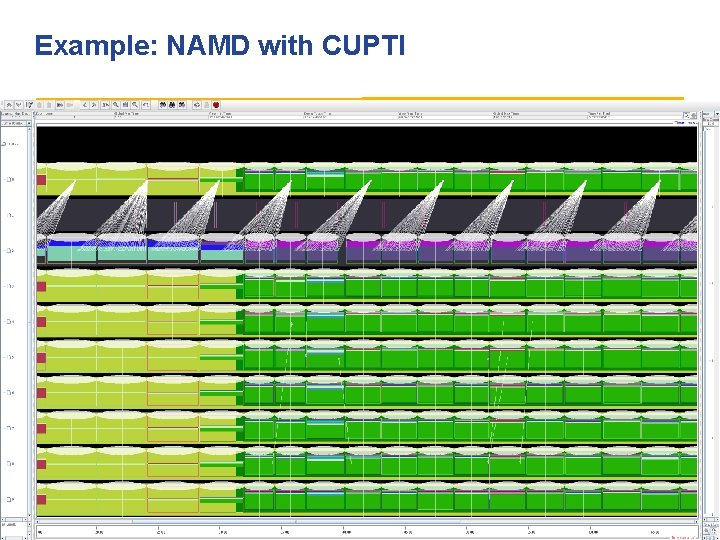
Example: NAMD with CUPTI 55

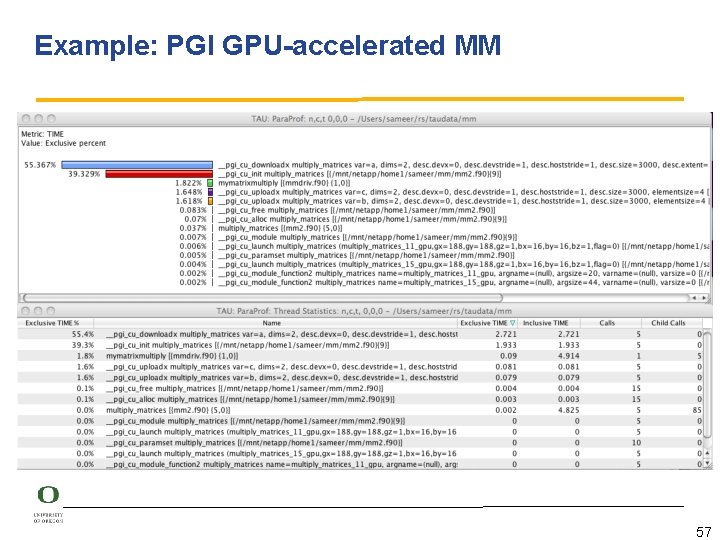
Profiling PGI Accelerator Primitives • PGI compiler allows users to annotate source code to identify loops that should be accelerated • When a program is compiled with TAU, its measurement library intercepts the PGI runtime library layer to measure time spent in the runtime library routines and data transfers • TAU also captures the arguments: – array data dimensions and sizes, strides, upload and download times, variable names, source file names, row and column information, and routines

Example: PGI GPU-accelerated MM 57

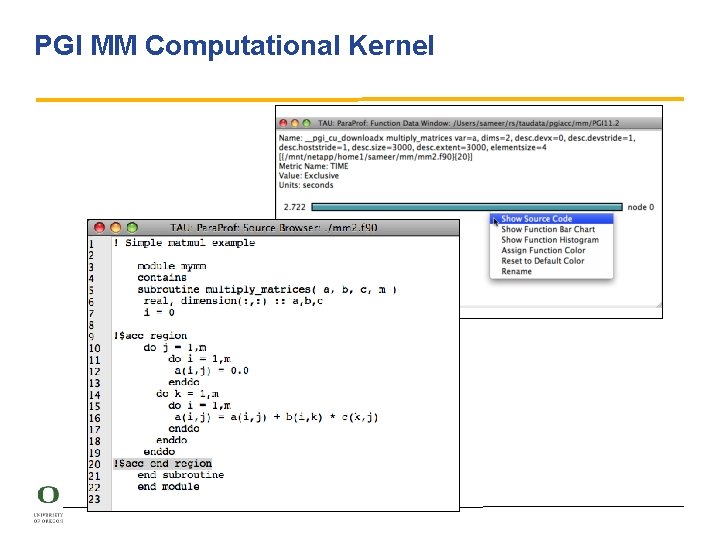
PGI MM Computational Kernel

Custom profiling 59

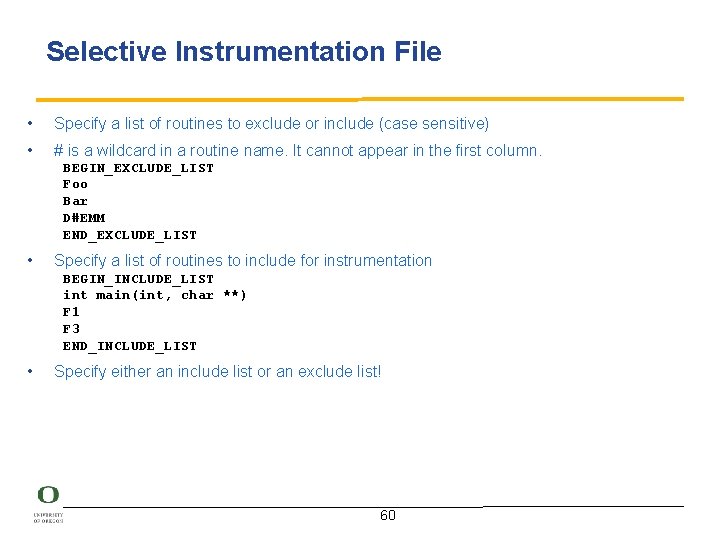
Selective Instrumentation File • • Specify a list of routines to exclude or include (case sensitive) # is a wildcard in a routine name. It cannot appear in the first column. BEGIN_EXCLUDE_LIST Foo Bar D#EMM END_EXCLUDE_LIST • Specify a list of routines to include for instrumentation BEGIN_INCLUDE_LIST int main(int, char **) F 1 F 3 END_INCLUDE_LIST • Specify either an include list or an exclude list! 60

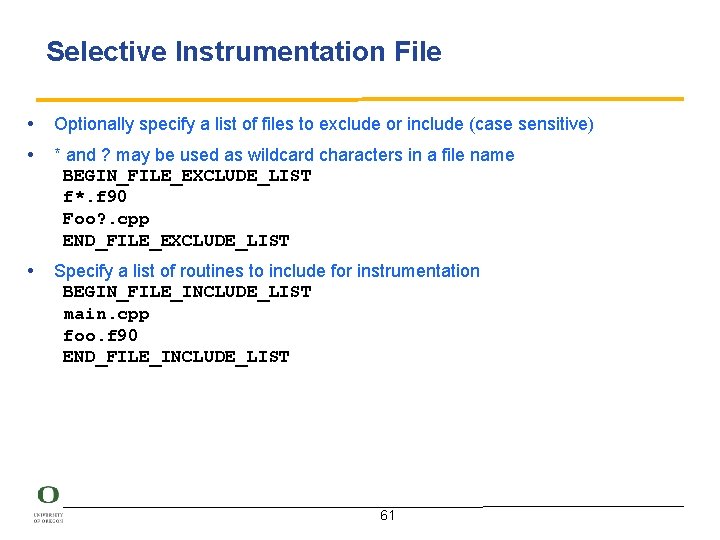
Selective Instrumentation File • Optionally specify a list of files to exclude or include (case sensitive) • * and ? may be used as wildcard characters in a file name BEGIN_FILE_EXCLUDE_LIST f*. f 90 Foo? . cpp END_FILE_EXCLUDE_LIST • Specify a list of routines to include for instrumentation BEGIN_FILE_INCLUDE_LIST main. cpp foo. f 90 END_FILE_INCLUDE_LIST 61

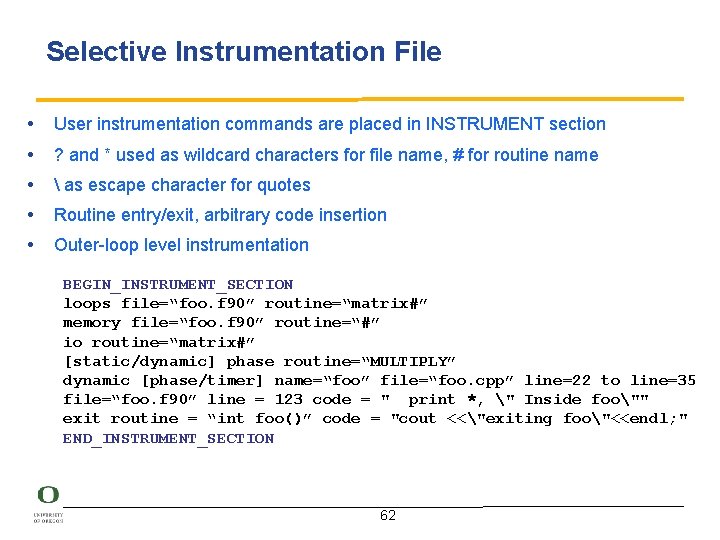
Selective Instrumentation File • • • User instrumentation commands are placed in INSTRUMENT section ? and * used as wildcard characters for file name, # for routine name as escape character for quotes Routine entry/exit, arbitrary code insertion Outer-loop level instrumentation BEGIN_INSTRUMENT_SECTION loops file=“foo. f 90” routine=“matrix#” memory file=“foo. f 90” routine=“#” io routine=“matrix#” [static/dynamic] phase routine=“MULTIPLY” dynamic [phase/timer] name=“foo” file=“foo. cpp” line=22 to line=35 file=“foo. f 90” line = 123 code = " print *, " Inside foo"" exit routine = “int foo()” code = "cout <<"exiting foo"<<endl; " END_INSTRUMENT_SECTION 62
![Instrumentation Specification tauinstrumentor Usage tauinstrumentor pdbfile sourcefile o outputfile noinline g Instrumentation Specification % tau_instrumentor Usage : tau_instrumentor <pdbfile> <sourcefile> [-o <outputfile>] [-noinline] [ -g](https://slidetodoc.com/presentation_image_h2/6a771bd80c74a93dfebab9d90c6bcdd4/image-63.jpg)
Instrumentation Specification % tau_instrumentor Usage : tau_instrumentor <pdbfile> <sourcefile> [-o <outputfile>] [-noinline] [ -g groupname] [-i headerfile] [-c|-c++|-fortran] [-f <instr_req_file> ] For selective instrumentation, use –f option % tau_instrumentor foo. pdb foo. cpp –o foo. inst. cpp –f selective. dat % cat selective. dat # Selective instrumentation: Specify an exclude/include list of routines/files. BEGIN_EXCLUDE_LIST void quicksort(int *, int) void sort_5 elements(int *) void interchange(int *, int *) END_EXCLUDE_LIST BEGIN_FILE_INCLUDE_LIST Main. cpp Foo? . c *. C END_FILE_INCLUDE_LIST # Instruments routines in Main. cpp, Foo? . c and *. C files only # Use BEGIN_[FILE]_INCLUDE_LIST with END_[FILE]_INCLUDE_LIST 63

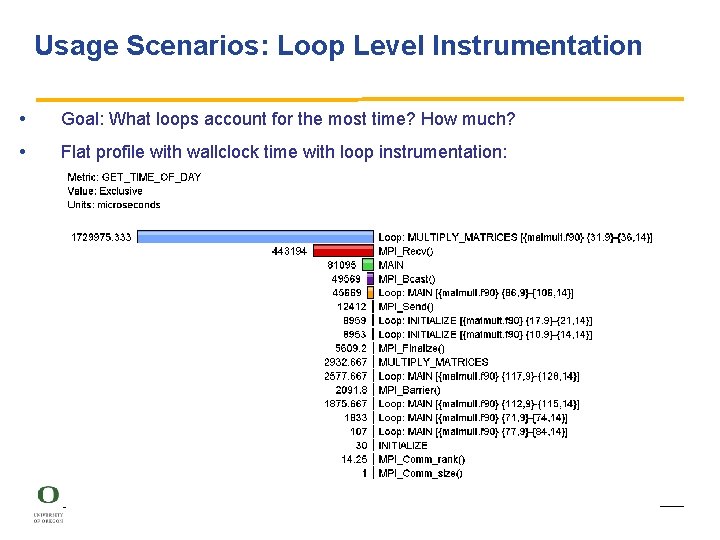
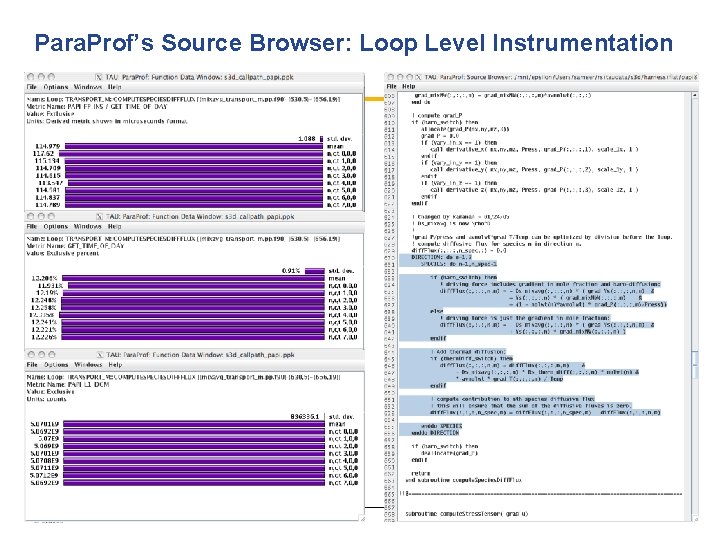
Usage Scenarios: Loop Level Instrumentation • Goal: What loops account for the most time? How much? • Flat profile with wallclock time with loop instrumentation: 64

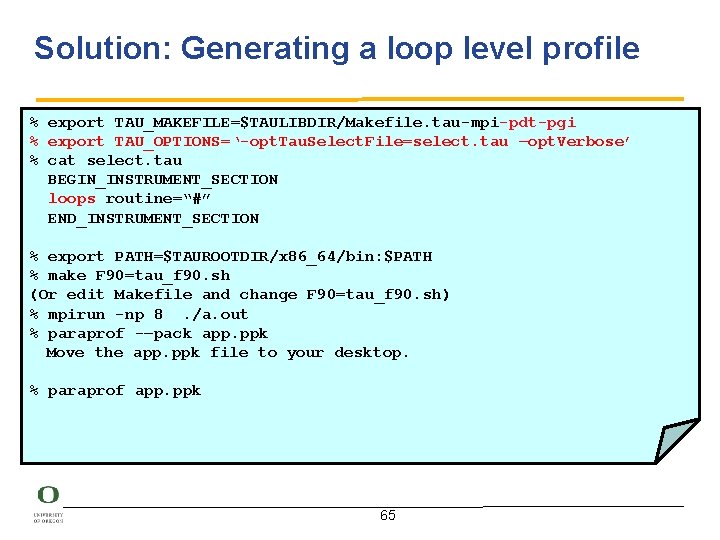
Solution: Generating a loop level profile % export TAU_MAKEFILE=$TAULIBDIR/Makefile. tau-mpi-pdt-pgi % export TAU_OPTIONS=‘-opt. Tau. Select. File=select. tau –opt. Verbose’ % cat select. tau BEGIN_INSTRUMENT_SECTION loops routine=“#” END_INSTRUMENT_SECTION % export PATH=$TAUROOTDIR/x 86_64/bin: $PATH % make F 90=tau_f 90. sh (Or edit Makefile and change F 90=tau_f 90. sh) % mpirun -np 8. /a. out % paraprof -–pack app. ppk Move the app. ppk file to your desktop. % paraprof app. ppk 65

Para. Prof’s Source Browser: Loop Level Instrumentation

Techniques for manual instrumentation of individual routines 67

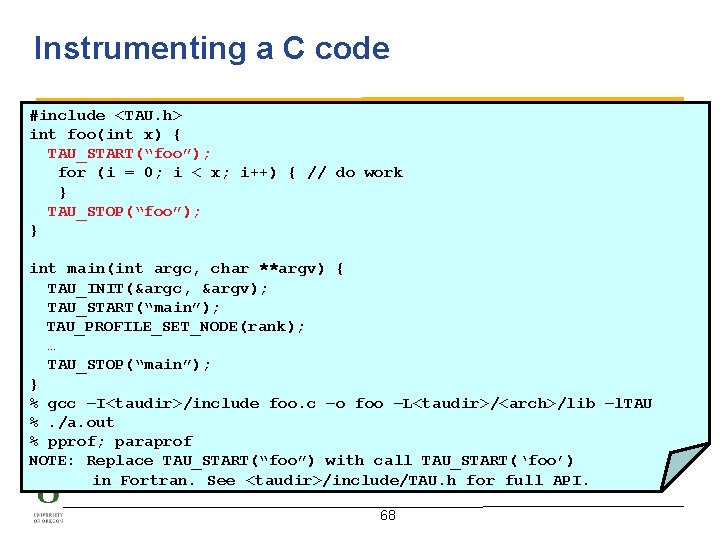
Instrumenting a C code #include <TAU. h> int foo(int x) { TAU_START(“foo”); for (i = 0; i < x; i++) { // do work } TAU_STOP(“foo”); } int main(int argc, char **argv) { TAU_INIT(&argc, &argv); TAU_START(“main”); TAU_PROFILE_SET_NODE(rank); … TAU_STOP(“main”); } % gcc –I<taudir>/include foo. c –o foo –L<taudir>/<arch>/lib –l. TAU %. /a. out % pprof; paraprof NOTE: Replace TAU_START(“foo”) with call TAU_START(‘foo’) in Fortran. See <taudir>/include/TAU. h for full API. 68

Generating event traces 69

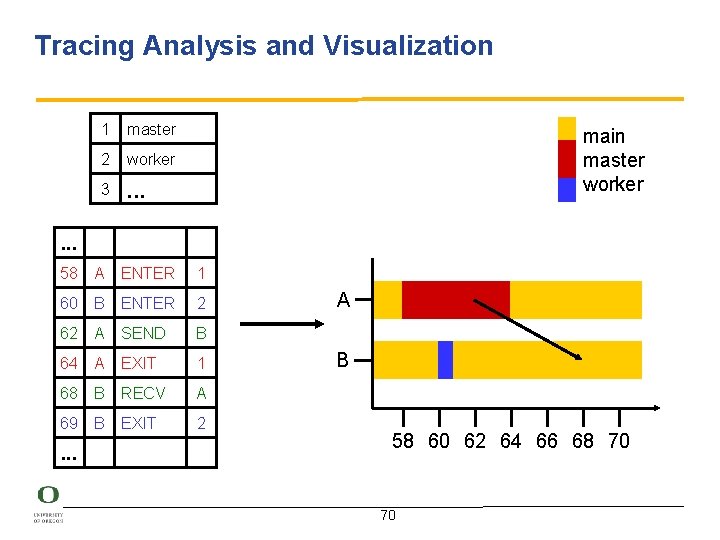
Tracing Analysis and Visualization 1 master 2 worker 3 . . . main master worker . . . 58 A ENTER 1 60 B ENTER 2 62 A SEND B 64 A EXIT 1 68 B RECV A 69 B EXIT 2 . . . A B 58 60 62 64 66 68 70 70

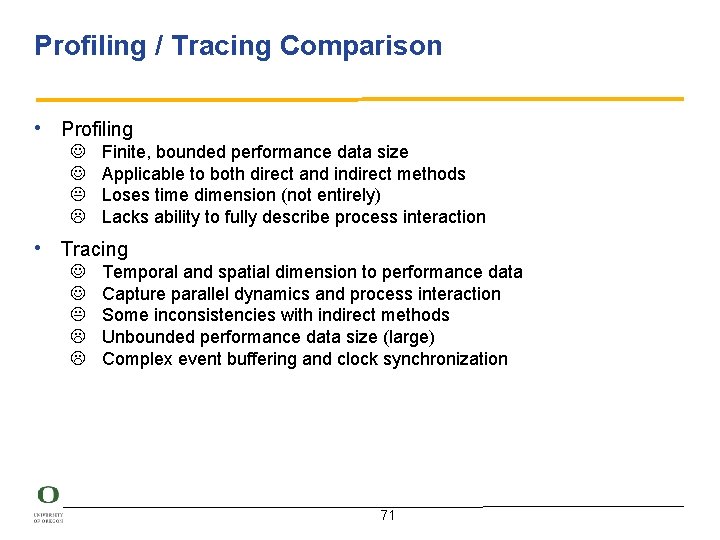
Profiling / Tracing Comparison • Profiling Finite, bounded performance data size Applicable to both direct and indirect methods Loses time dimension (not entirely) Lacks ability to fully describe process interaction • Tracing Temporal and spatial dimension to performance data Capture parallel dynamics and process interaction Some inconsistencies with indirect methods Unbounded performance data size (large) Complex event buffering and clock synchronization 71

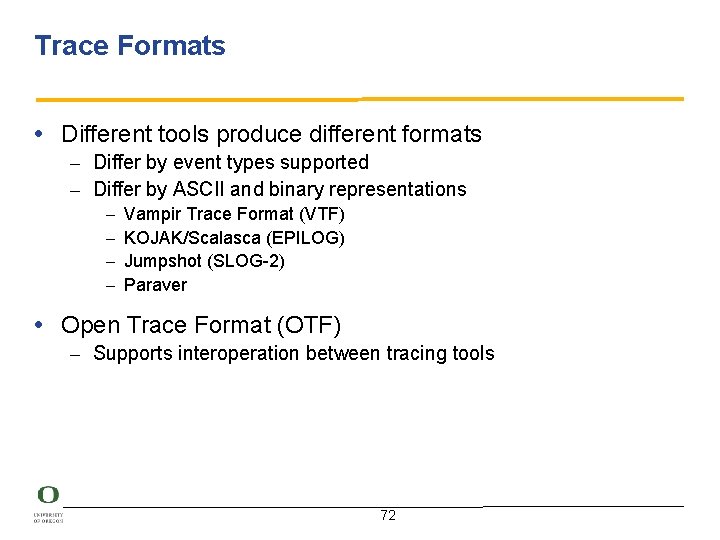
Trace Formats • Different tools produce different formats – Differ by event types supported – Differ by ASCII and binary representations – – Vampir Trace Format (VTF) KOJAK/Scalasca (EPILOG) Jumpshot (SLOG-2) Paraver • Open Trace Format (OTF) – Supports interoperation between tracing tools 72

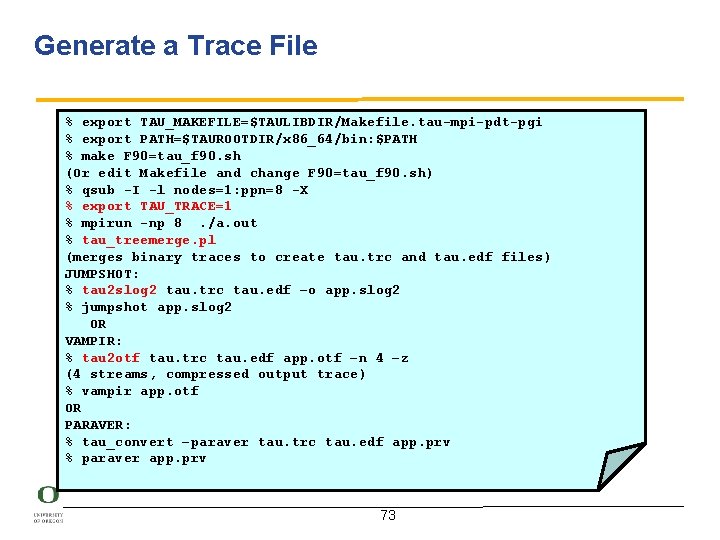
Generate a Trace File % export TAU_MAKEFILE=$TAULIBDIR/Makefile. tau-mpi-pdt-pgi % export PATH=$TAUROOTDIR/x 86_64/bin: $PATH % make F 90=tau_f 90. sh (Or edit Makefile and change F 90=tau_f 90. sh) % qsub -I -l nodes=1: ppn=8 -X % export TAU_TRACE=1 % mpirun -np 8. /a. out % tau_treemerge. pl (merges binary traces to create tau. trc and tau. edf files) JUMPSHOT: % tau 2 slog 2 tau. trc tau. edf –o app. slog 2 % jumpshot app. slog 2 OR VAMPIR: % tau 2 otf tau. trc tau. edf app. otf –n 4 –z (4 streams, compressed output trace) % vampir app. otf OR PARAVER: % tau_convert –paraver tau. trc tau. edf app. prv % paraver app. prv 73

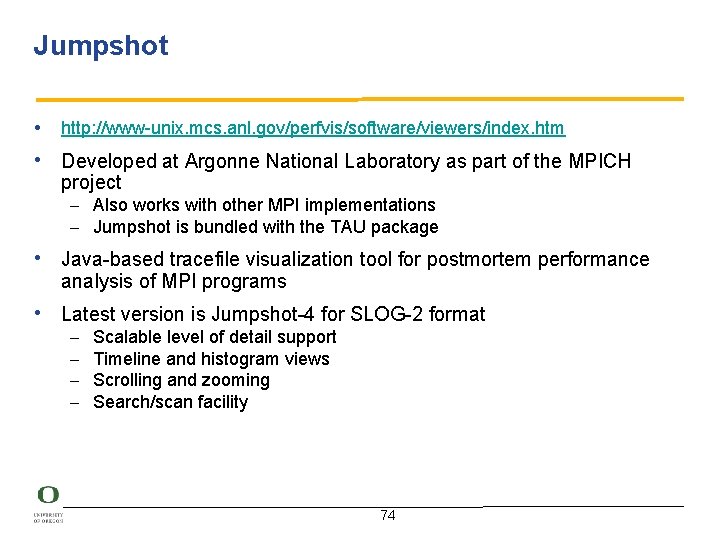
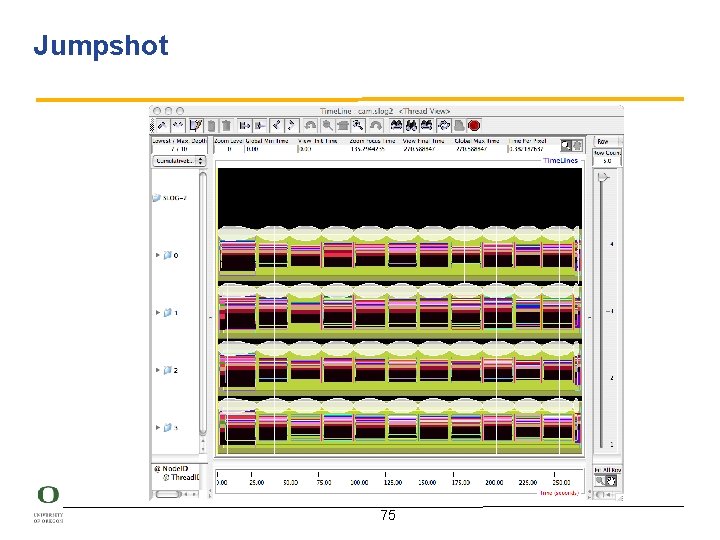
Jumpshot • http: //www-unix. mcs. anl. gov/perfvis/software/viewers/index. htm • Developed at Argonne National Laboratory as part of the MPICH project – Also works with other MPI implementations – Jumpshot is bundled with the TAU package • Java-based tracefile visualization tool for postmortem performance analysis of MPI programs • Latest version is Jumpshot-4 for SLOG-2 format – – Scalable level of detail support Timeline and histogram views Scrolling and zooming Search/scan facility 74

Jumpshot 75
![Para Ver http www bsc esparaver Para. Ver [http: //www. bsc. es/paraver]](https://slidetodoc.com/presentation_image_h2/6a771bd80c74a93dfebab9d90c6bcdd4/image-76.jpg)
Para. Ver [http: //www. bsc. es/paraver]

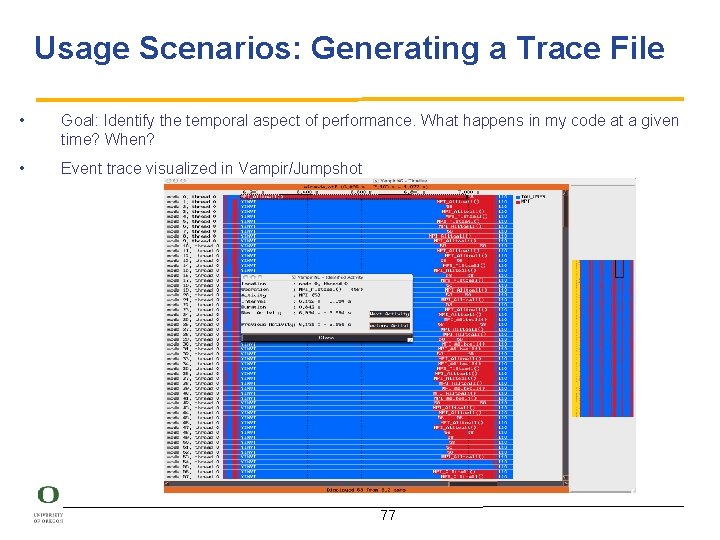
Usage Scenarios: Generating a Trace File • Goal: Identify the temporal aspect of performance. What happens in my code at a given time? When? • Event trace visualized in Vampir/Jumpshot 77

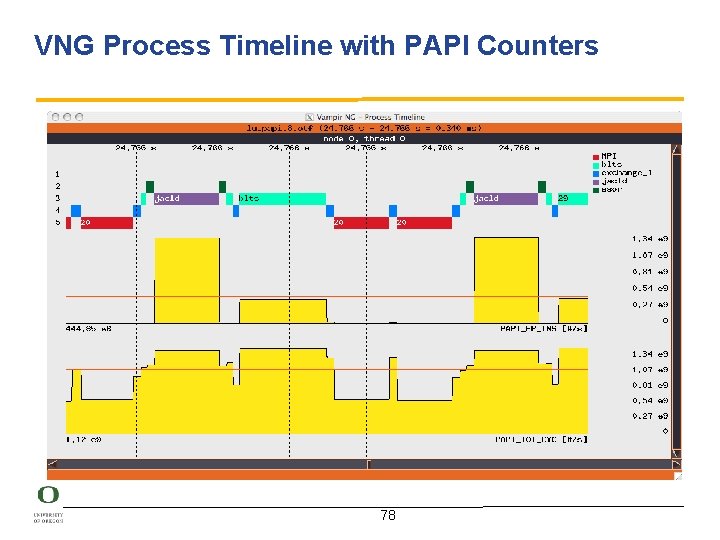
VNG Process Timeline with PAPI Counters 78

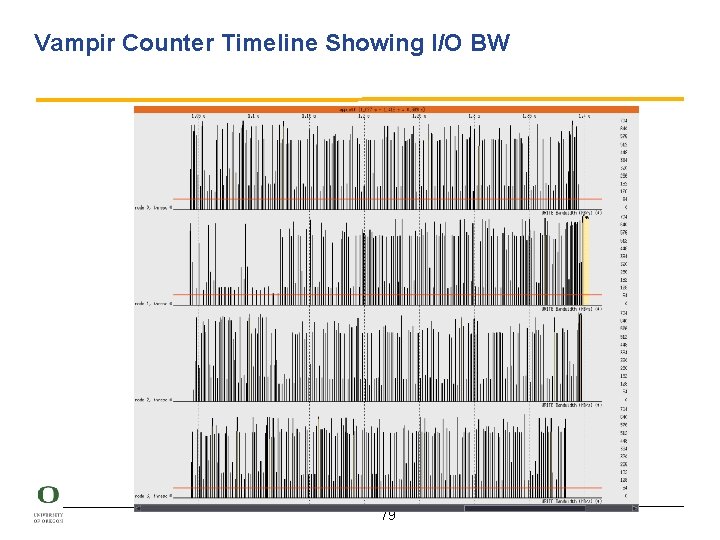
Vampir Counter Timeline Showing I/O BW 79

Running the application, generation of performance data 80

Environment Variables in TAU Environment Variable Default Description TAU_TRACE 0 Setting to 1 turns on tracing TAU_CALLPATH 0 Setting to 1 turns on callpath profiling TAU_TRACK_MEMORY_LEAKS 0 Setting to 1 turns on leak detection TAU_TRACK_HEAP or TAU_TRACK_HEADROOM 0 Setting to 1 turns on tracking heap memory/headroom at routine entry & exit using context events (e. g. , Heap at Entry: main=>foo=>bar) TAU_CALLPATH_DEPTH 2 Specifies depth of callpath. Setting to 0 generates no callpath or routine information, setting to 1 generates flat profile and context events have just parent information (e. g. , Heap Entry: foo) TAU_SYNCHRONIZE_CLOCKS 1 Synchronize clocks across nodes to correct timestamps in traces TAU_COMM_MATRIX 0 Setting to 1 generates communication matrix display using context events TAU_THROTTLE 1 Setting to 0 turns off throttling. Enabled by default to remove instrumentation in lightweight routines that are called frequently TAU_THROTTLE_NUMCALLS 100000 Specifies the number of calls before testing for throttling TAU_THROTTLE_PERCALL 10 Specifies value in microseconds. Throttle a routine if it is called over 100000 times and takes less than 10 usec of inclusive time per call TAU_COMPENSATE 0 Setting to 1 enables runtime compensation of instrumentation overhead TAU_PROFILE_FORMAT Profile Setting to “merged” generates a single file. “snapshot” generates xml format TAU_METRICS TIME Setting to a comma separted list generates other metrics. (e. g. , TIME: linuxtimers: PAPI_FP_OPS: PAPI_NATIVE_<event>)

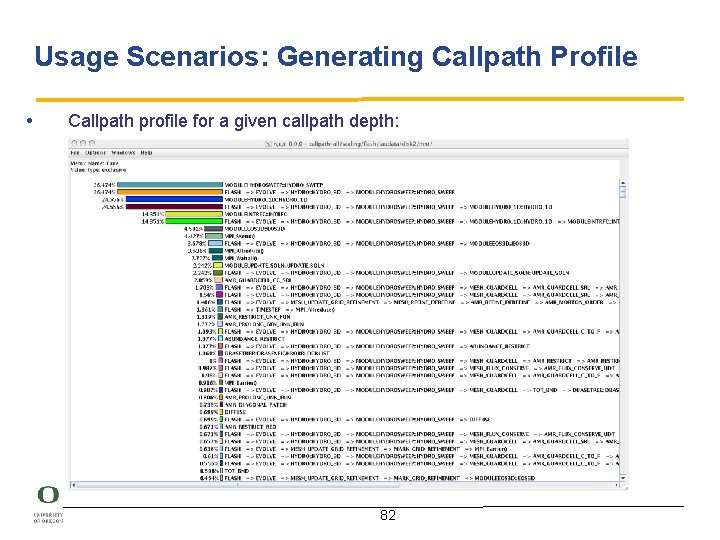
Usage Scenarios: Generating Callpath Profile • Callpath profile for a given callpath depth: 82

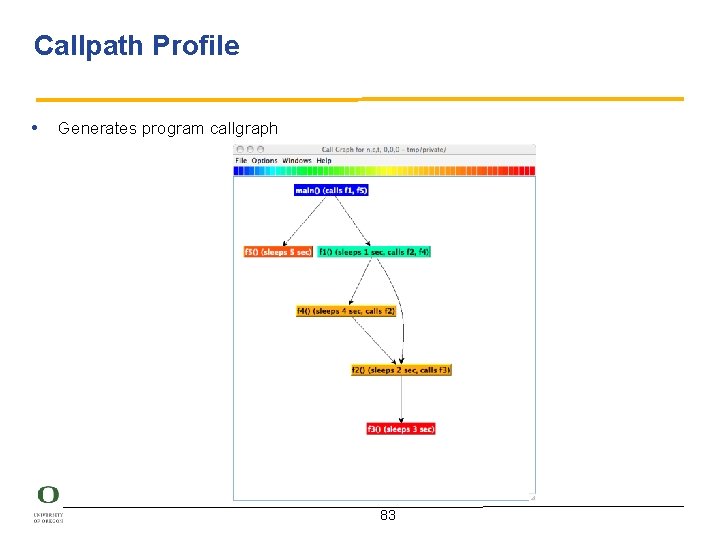
Callpath Profile • Generates program callgraph 83

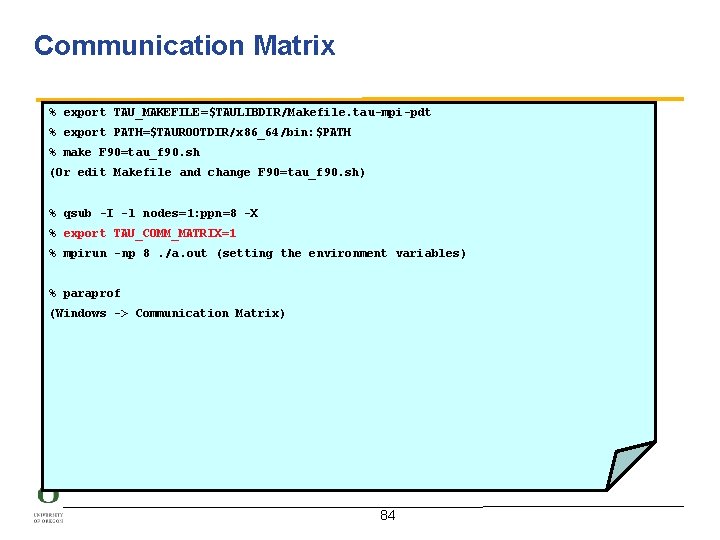
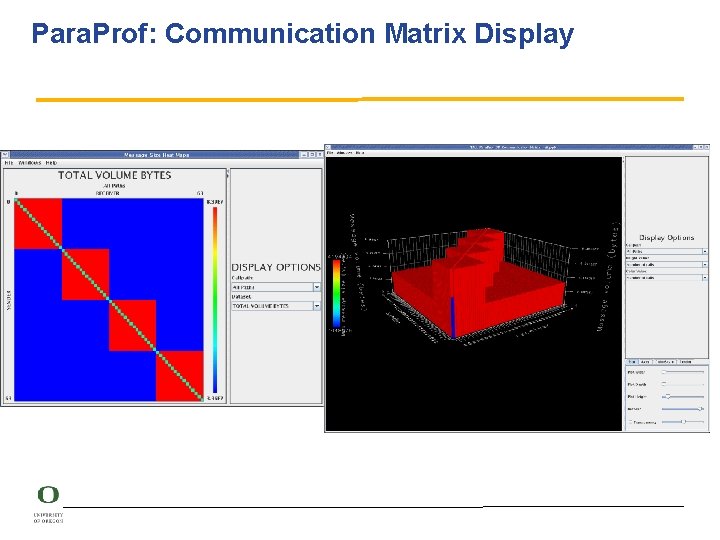
Communication Matrix % export TAU_MAKEFILE=$TAULIBDIR/Makefile. tau-mpi-pdt % export PATH=$TAUROOTDIR/x 86_64/bin: $PATH % make F 90=tau_f 90. sh (Or edit Makefile and change F 90=tau_f 90. sh) % qsub -I -l nodes=1: ppn=8 -X % export TAU_COMM_MATRIX=1 % mpirun -np 8. /a. out (setting the environment variables) % paraprof (Windows -> Communication Matrix) 84

Para. Prof: Communication Matrix Display

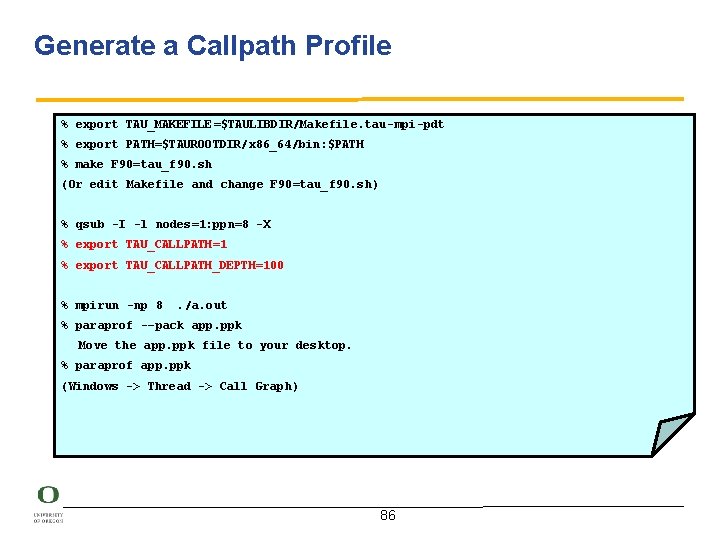
Generate a Callpath Profile % export TAU_MAKEFILE=$TAULIBDIR/Makefile. tau-mpi-pdt % export PATH=$TAUROOTDIR/x 86_64/bin: $PATH % make F 90=tau_f 90. sh (Or edit Makefile and change F 90=tau_f 90. sh ) % qsub -I -l nodes=1: ppn=8 -X % export TAU_CALLPATH=1 % export TAU_CALLPATH_DEPTH=100 % mpirun -np 8 . /a. out % paraprof -–pack app. ppk Move the app. ppk file to your desktop. % paraprof app. ppk (Windows -> Thread -> Call Graph ) 86

Analyzing performance data with Para. Prof, Perf. Explorer 87

TAU Performance System Architecture 88

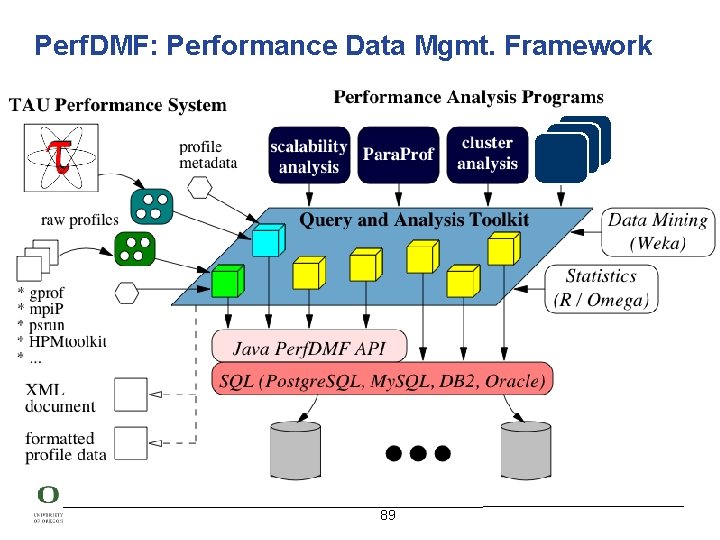
Perf. DMF: Performance Data Mgmt. Framework 89

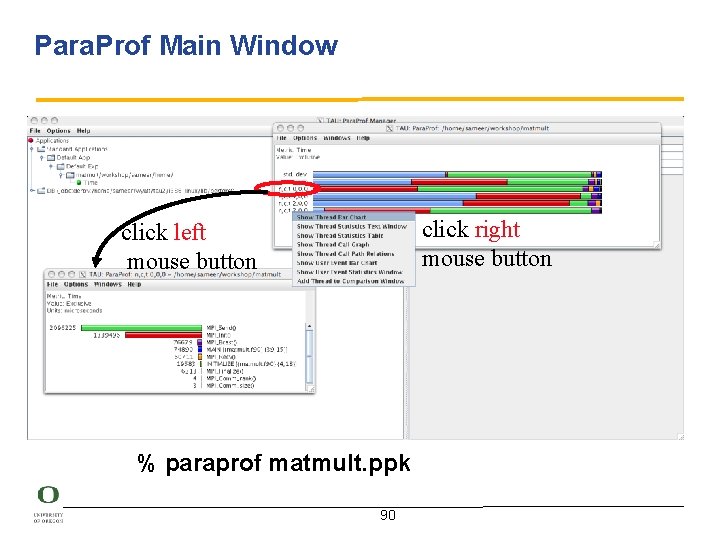
Para. Prof Main Window click right mouse button click left mouse button % paraprof matmult. ppk 90

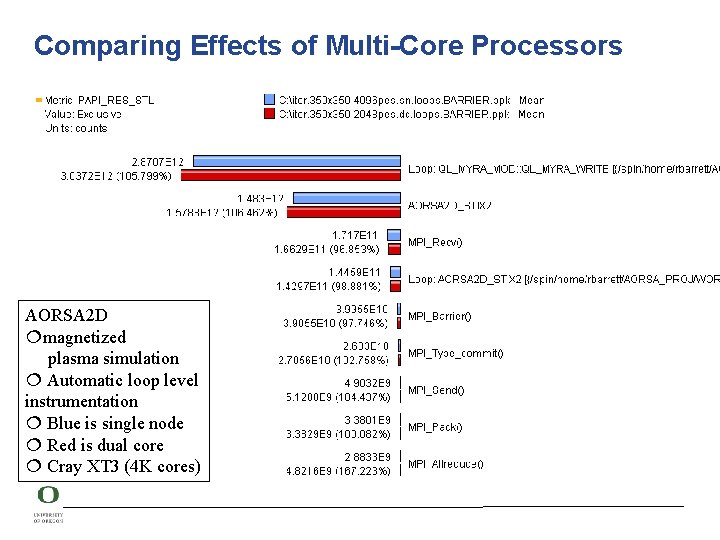
Comparing Effects of Multi-Core Processors AORSA 2 D magnetized plasma simulation Automatic loop level instrumentation Blue is single node Red is dual core Cray XT 3 (4 K cores)

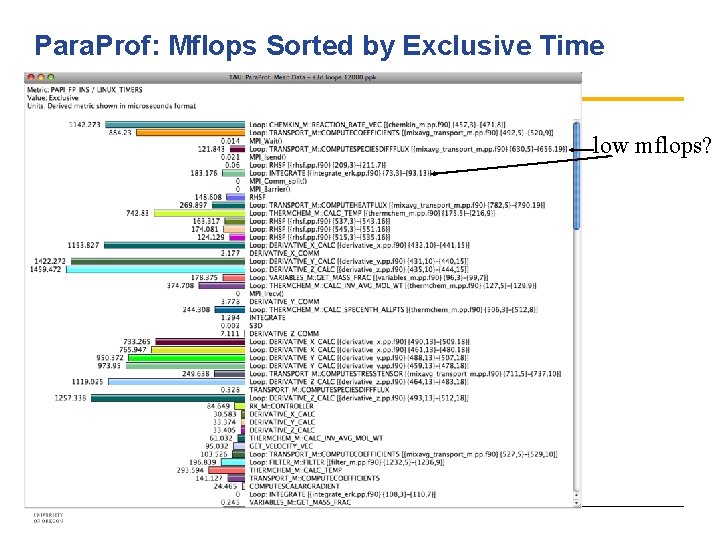
Para. Prof: Mflops Sorted by Exclusive Time low mflops?

Parallel Profile Visualization: Para. Prof

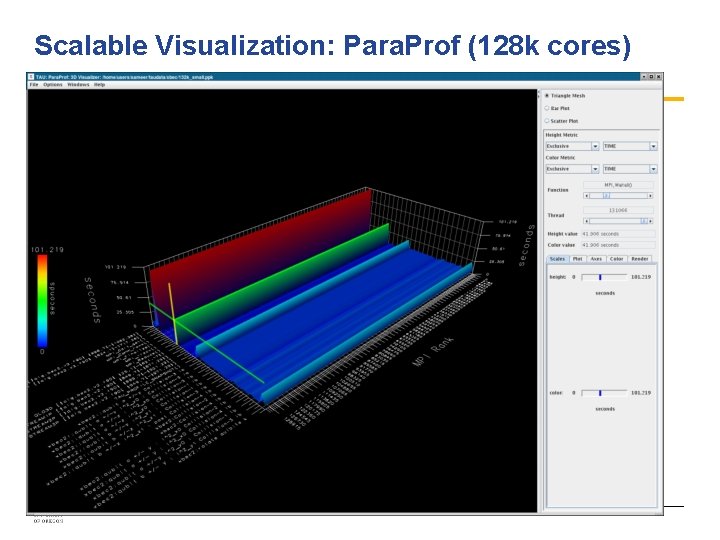
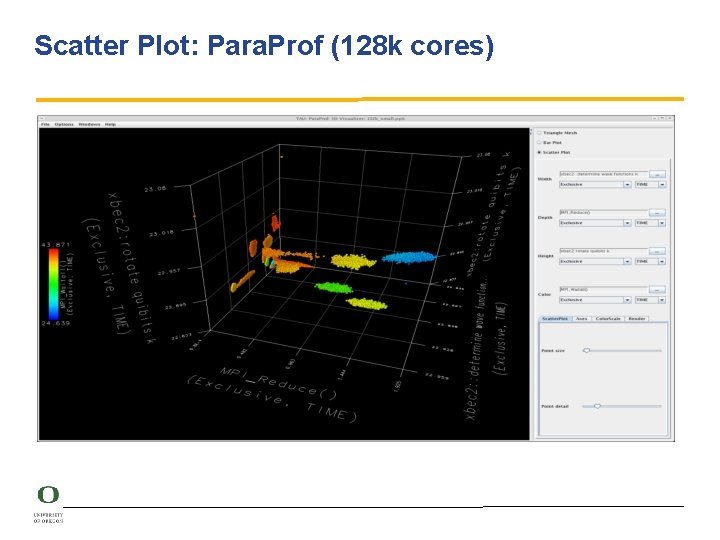
Scalable Visualization: Para. Prof (128 k cores)

Scatter Plot: Para. Prof (128 k cores)

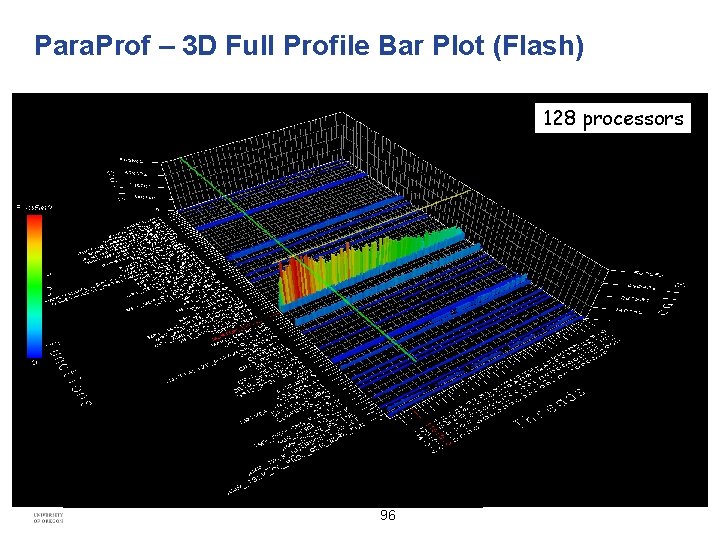
Para. Prof – 3 D Full Profile Bar Plot (Flash) 128 processors 96

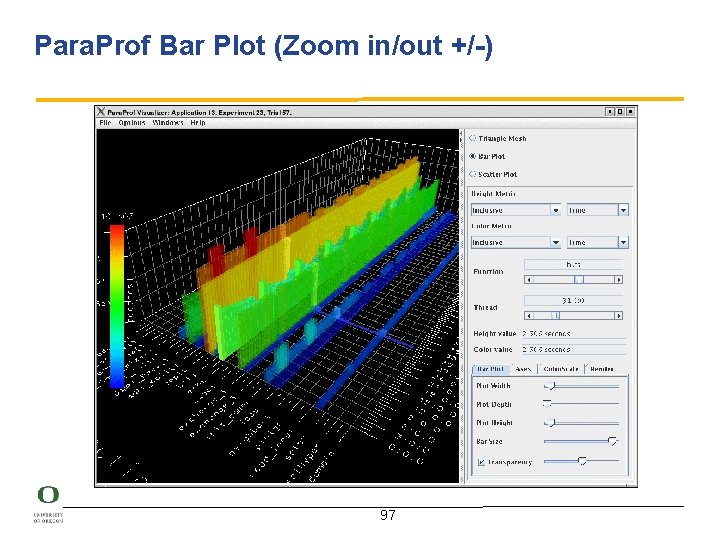
Para. Prof Bar Plot (Zoom in/out +/-) 97

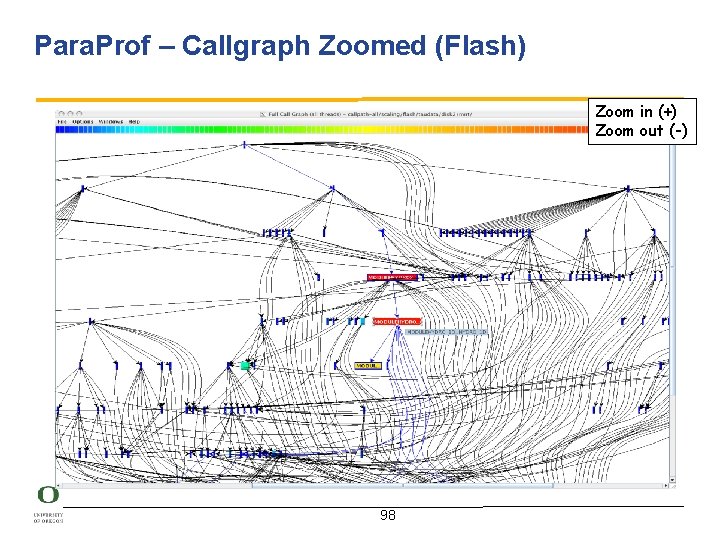
Para. Prof – Callgraph Zoomed (Flash) Zoom in (+) Zoom out (-) 98

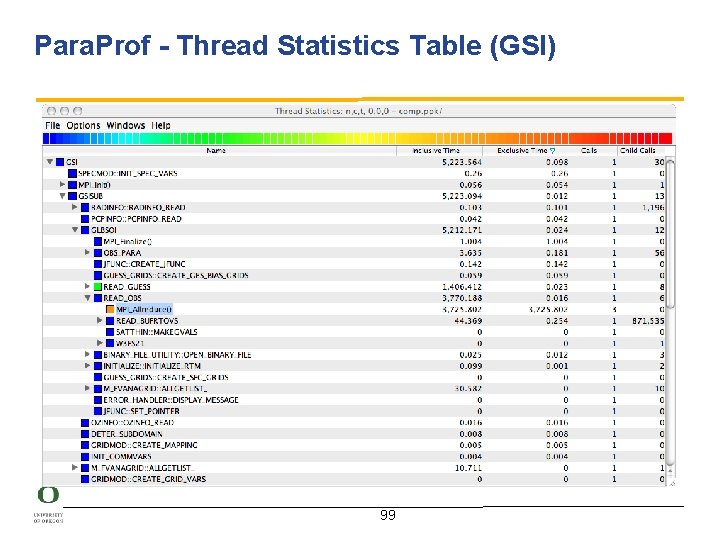
Para. Prof - Thread Statistics Table (GSI) 99

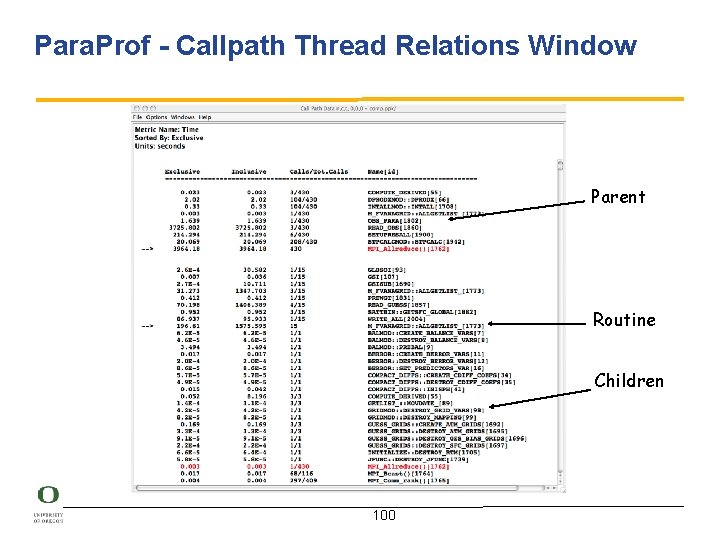
Para. Prof - Callpath Thread Relations Window Parent Routine Children 100

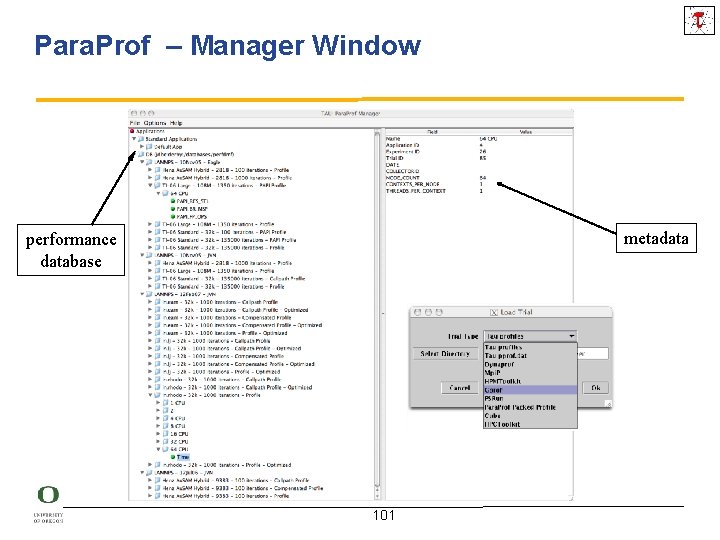
Para. Prof – Manager Window metadata performance database 101

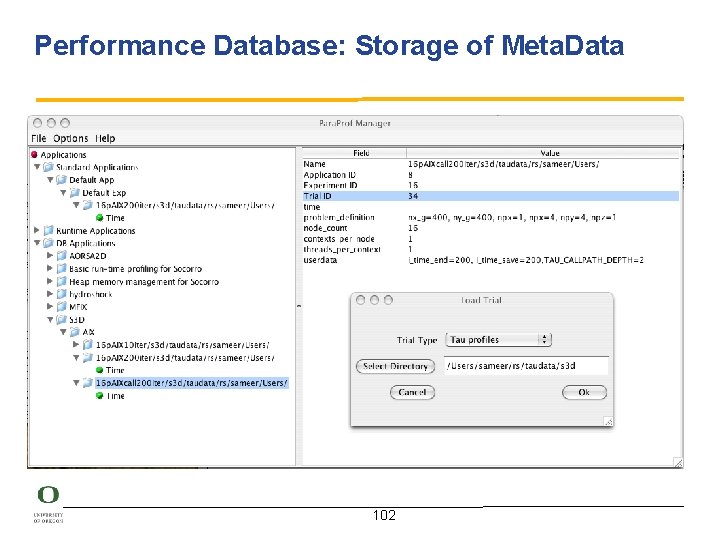
Performance Database: Storage of Meta. Data 102

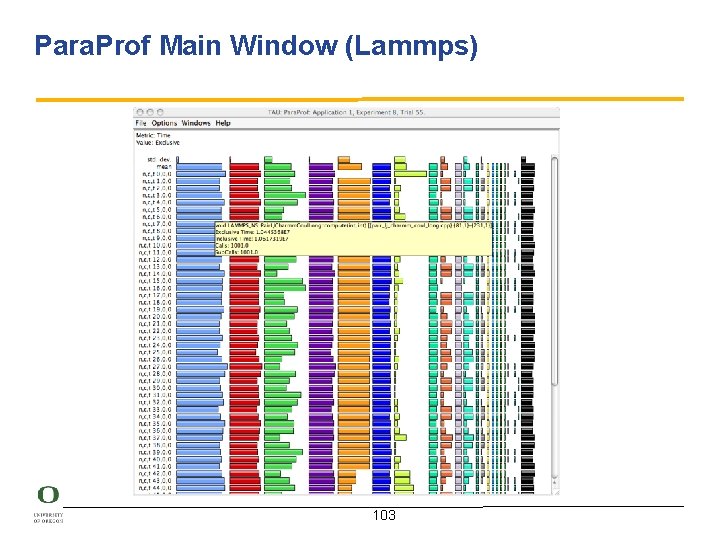
Para. Prof Main Window (Lammps) 103

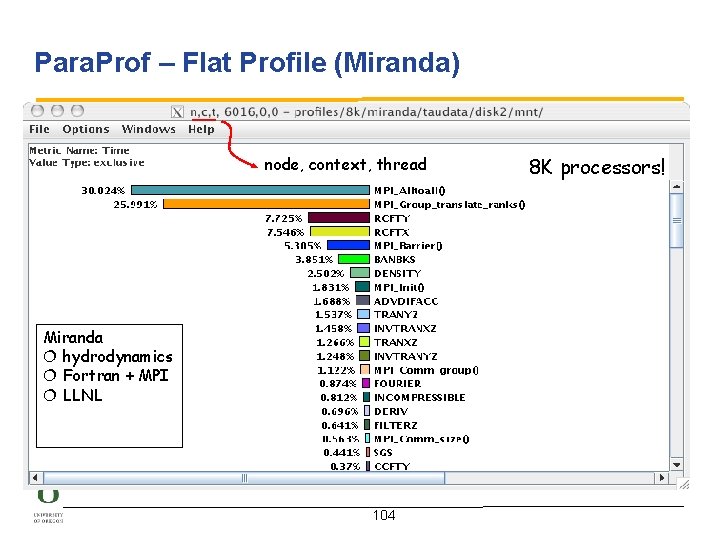
Para. Prof – Flat Profile (Miranda) node, context, thread Miranda hydrodynamics Fortran + MPI LLNL 104 8 K processors!

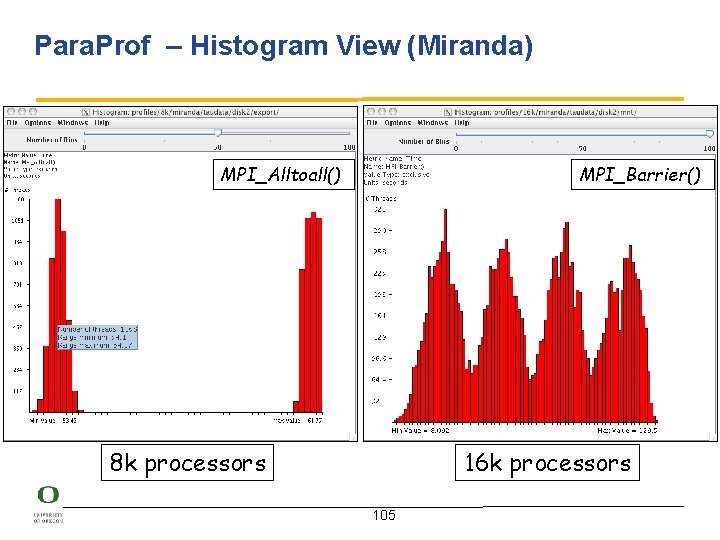
Para. Prof – Histogram View (Miranda) MPI_Alltoall() MPI_Barrier() 8 k processors 16 k processors 105

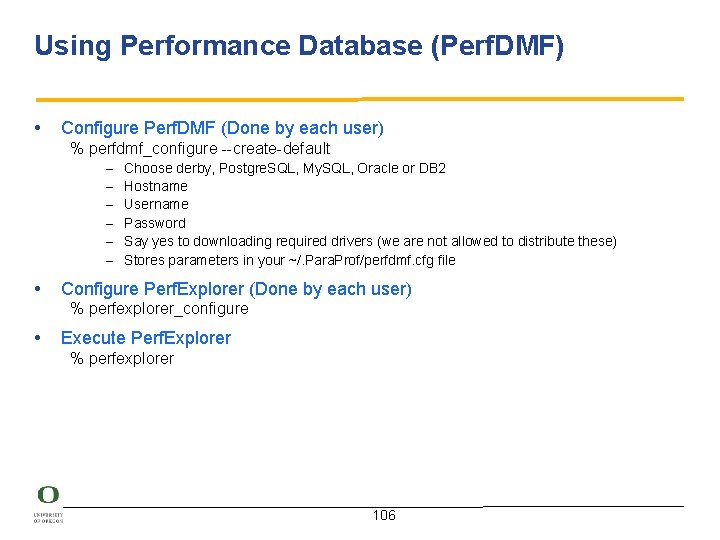
Using Performance Database (Perf. DMF) • Configure Perf. DMF (Done by each user) % perfdmf_configure --create-default – – – Choose derby, Postgre. SQL, My. SQL, Oracle or DB 2 Hostname Username Password Say yes to downloading required drivers (we are not allowed to distribute these) Stores parameters in your ~/. Para. Prof/perfdmf. cfg file • Configure Perf. Explorer (Done by each user) % perfexplorer_configure • Execute Perf. Explorer % perfexplorer 106

Perf. DMF and the TAU Portal • Development of the TAU portal – Common repository for collaborative data sharing – Profile uploading, downloading, user management – Paraprof, Perf. Explorer can be launched from the portal using Java Web Start (no TAU installation required) • Portal URL http: //tau. nic. uoregon. edu 107

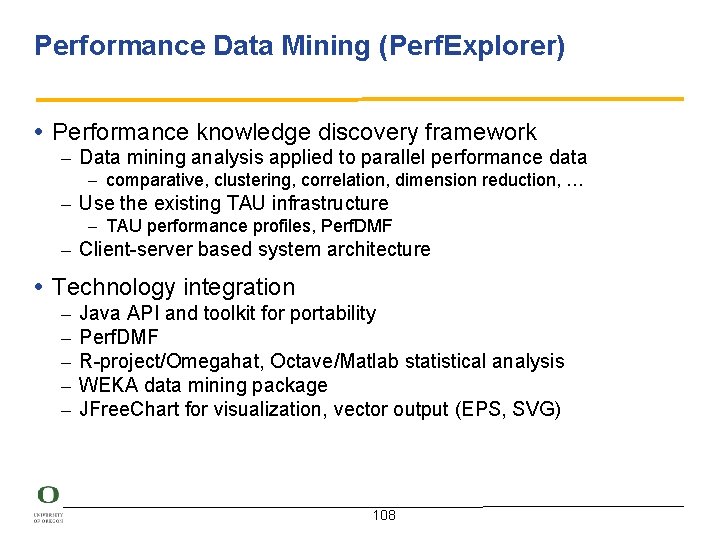
Performance Data Mining (Perf. Explorer) • Performance knowledge discovery framework – Data mining analysis applied to parallel performance data – comparative, clustering, correlation, dimension reduction, … – Use the existing TAU infrastructure – TAU performance profiles, Perf. DMF – Client-server based system architecture • Technology integration – – – Java API and toolkit for portability Perf. DMF R-project/Omegahat, Octave/Matlab statistical analysis WEKA data mining package JFree. Chart for visualization, vector output (EPS, SVG) 108

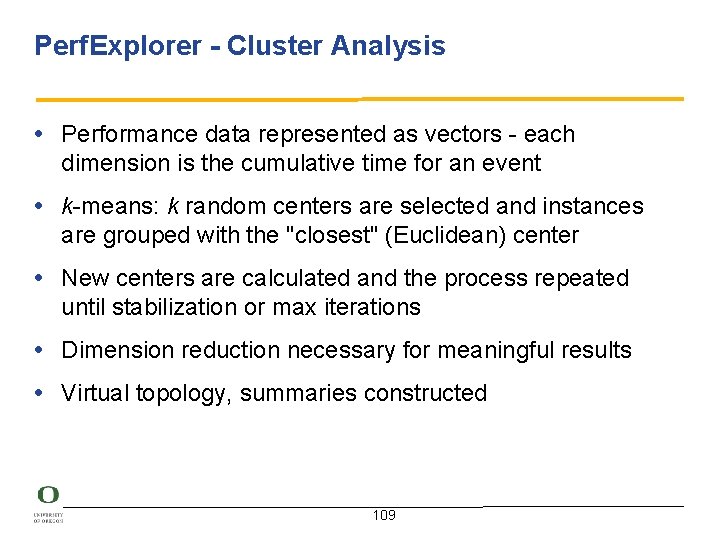
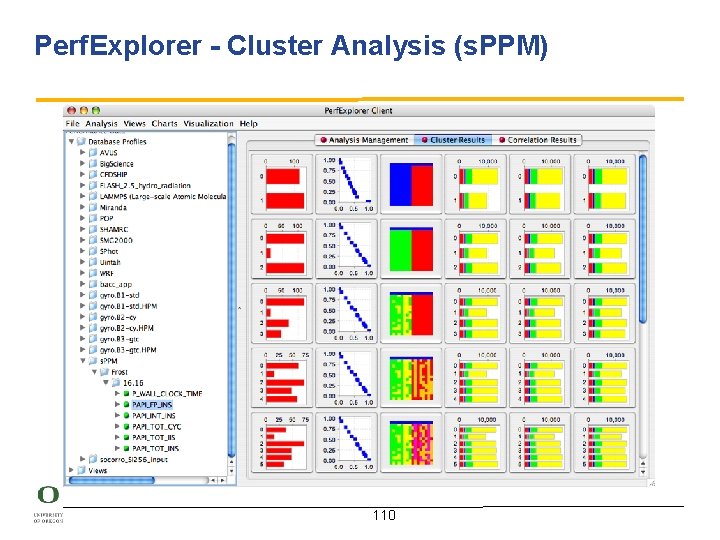
Perf. Explorer - Cluster Analysis • Performance data represented as vectors - each dimension is the cumulative time for an event • k-means: k random centers are selected and instances are grouped with the "closest" (Euclidean) center • New centers are calculated and the process repeated until stabilization or max iterations • Dimension reduction necessary for meaningful results • Virtual topology, summaries constructed 109

Perf. Explorer - Cluster Analysis (s. PPM) 110

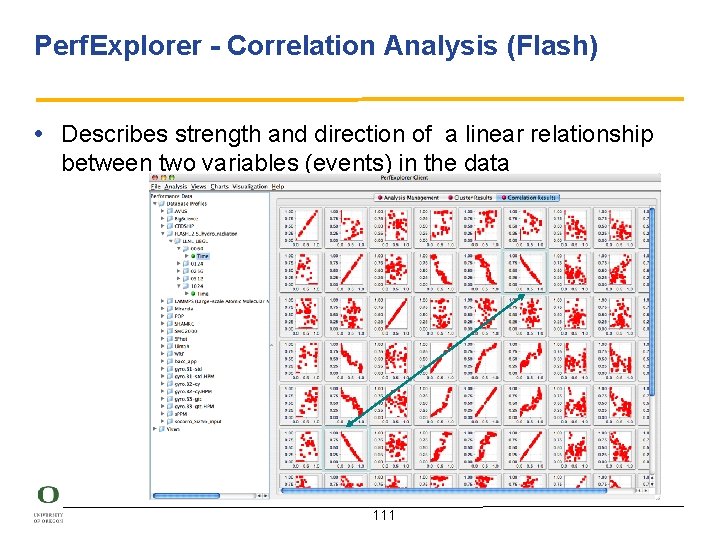
Perf. Explorer - Correlation Analysis (Flash) • Describes strength and direction of a linear relationship between two variables (events) in the data 111

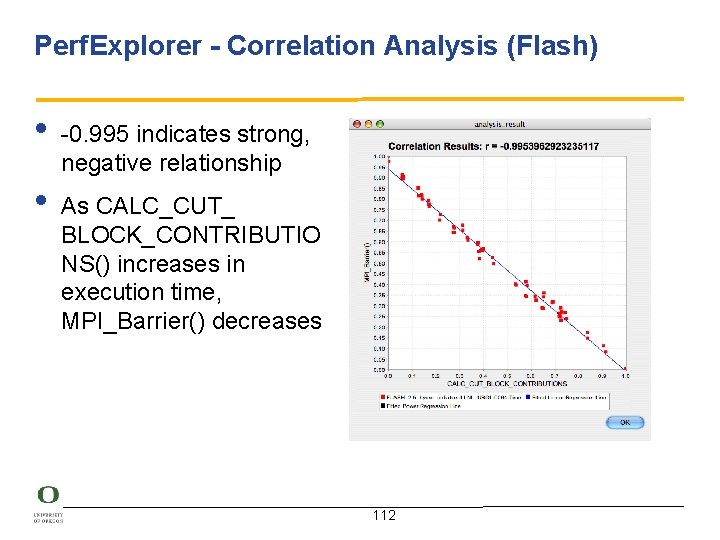
Perf. Explorer - Correlation Analysis (Flash) • -0. 995 indicates strong, negative relationship • As CALC_CUT_ BLOCK_CONTRIBUTIO NS() increases in execution time, MPI_Barrier() decreases 112

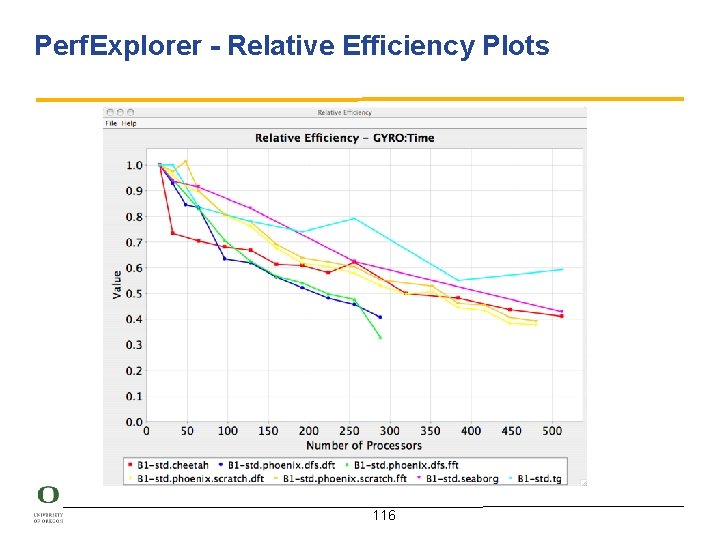
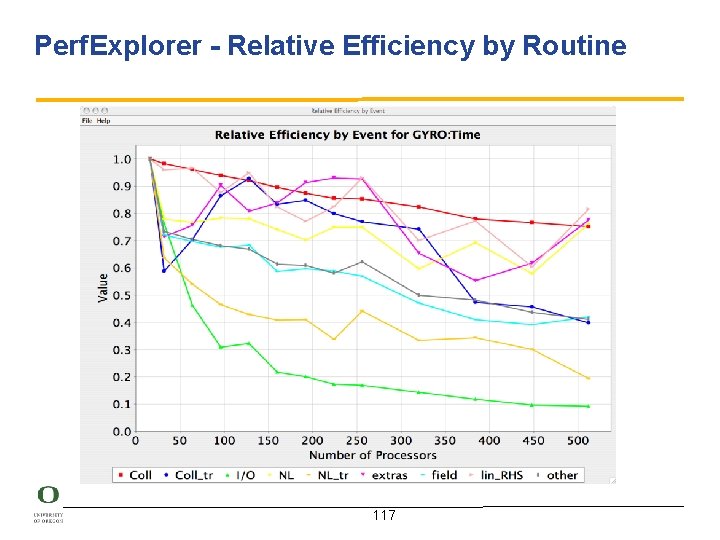
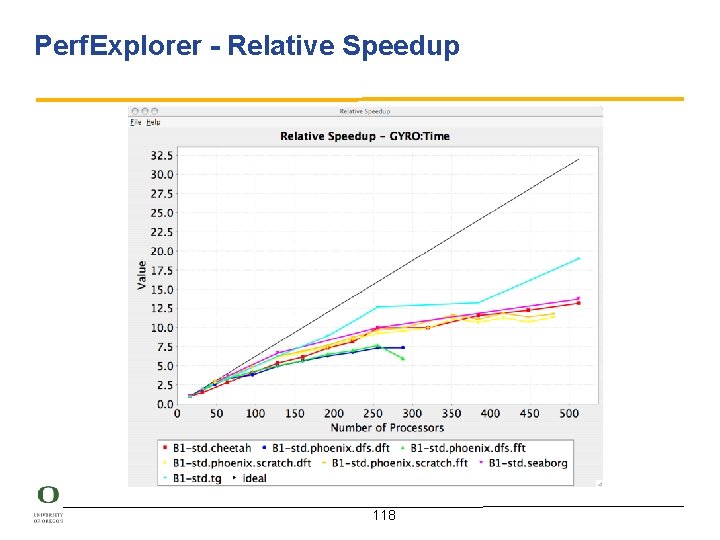
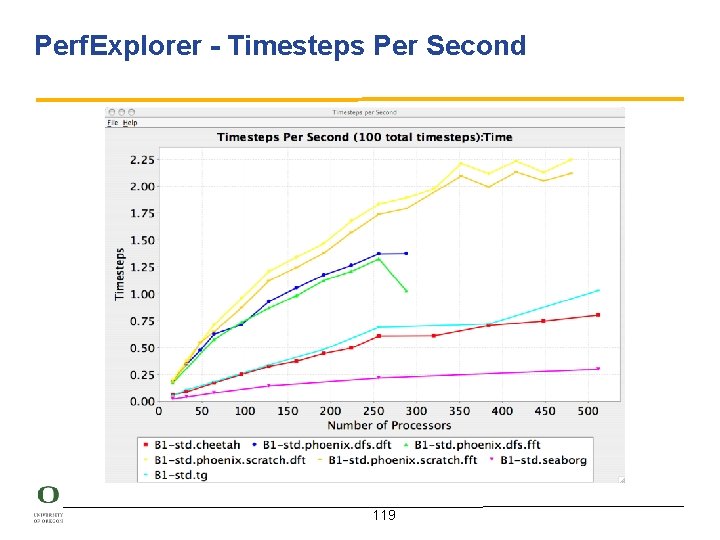
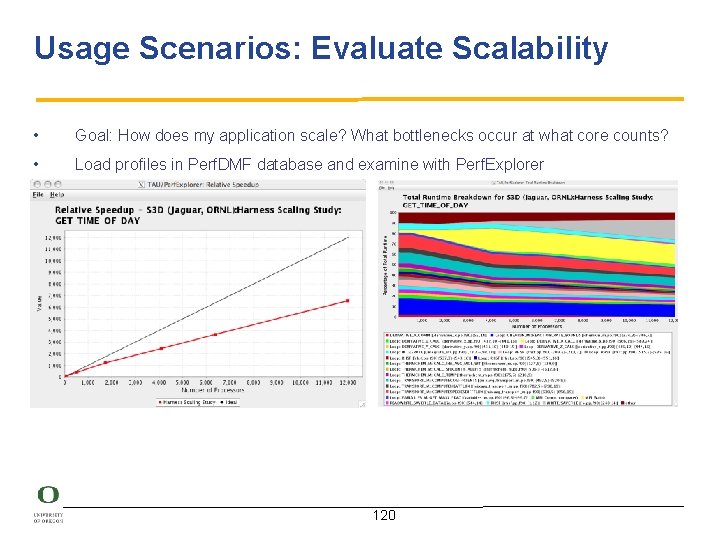
Perf. Explorer - Comparative Analysis • Relative speedup, efficiency – total runtime, by event, one event, by phase • • • Breakdown of total runtime Group fraction of total runtime Correlating events to total runtime Timesteps per second Performance Evaluation Research Center (PERC) – – PERC tools study (led by ORNL, Pat Worley) In-depth performance analysis of select applications Evaluation performance analysis requirements Test tool functionality and ease of use 113

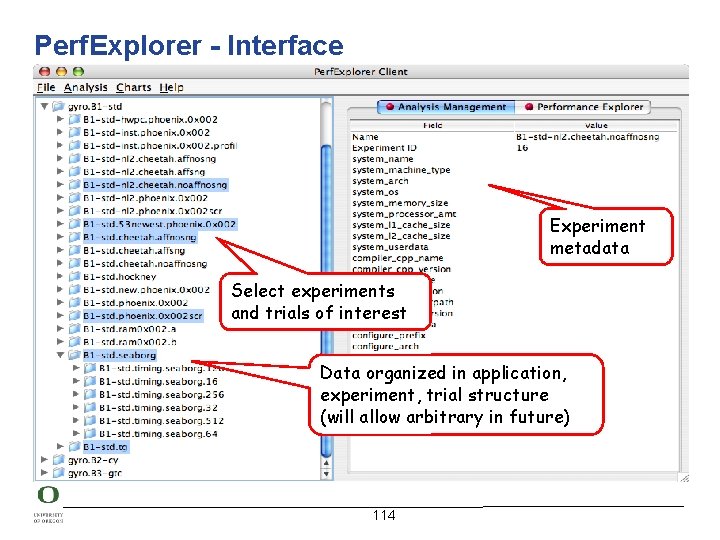
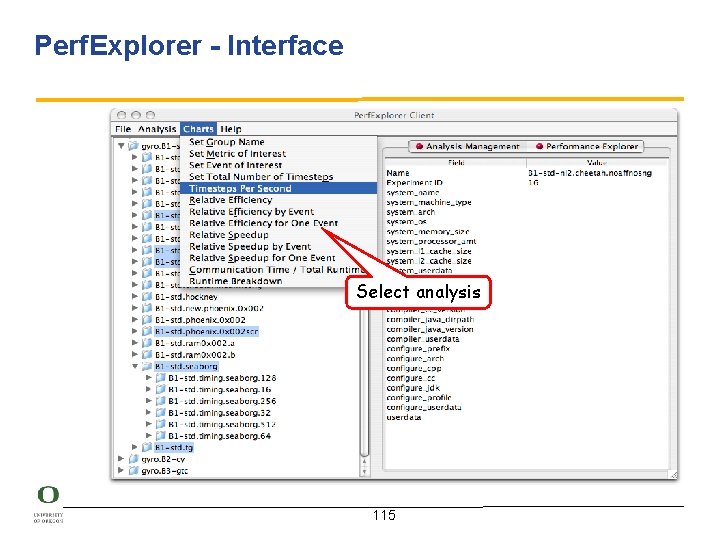
Perf. Explorer - Interface Experiment metadata Select experiments and trials of interest Data organized in application, experiment, trial structure (will allow arbitrary in future) 114

Perf. Explorer - Interface Select analysis 115

Perf. Explorer - Relative Efficiency Plots 116

Perf. Explorer - Relative Efficiency by Routine 117

Perf. Explorer - Relative Speedup 118

Perf. Explorer - Timesteps Per Second 119

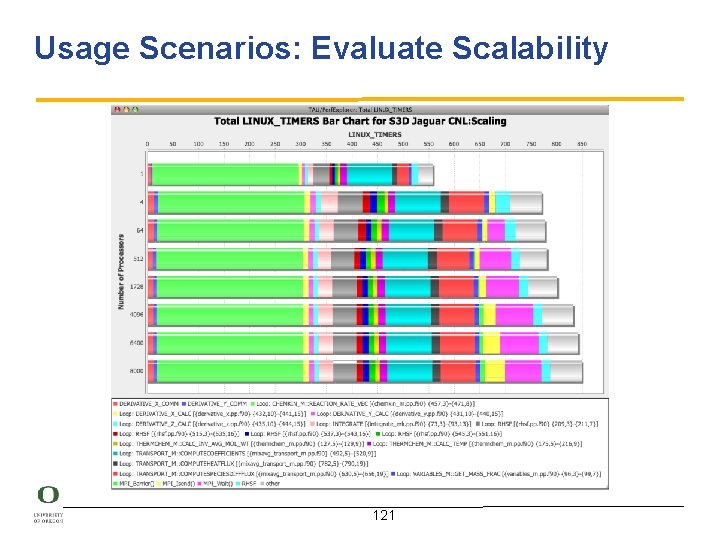
Usage Scenarios: Evaluate Scalability • Goal: How does my application scale? What bottlenecks occur at what core counts? • Load profiles in Perf. DMF database and examine with Perf. Explorer 120

Usage Scenarios: Evaluate Scalability 121

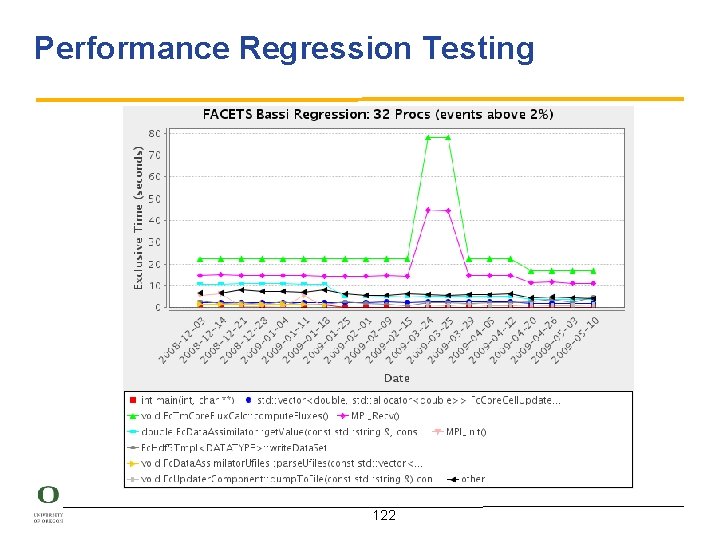
Performance Regression Testing 122

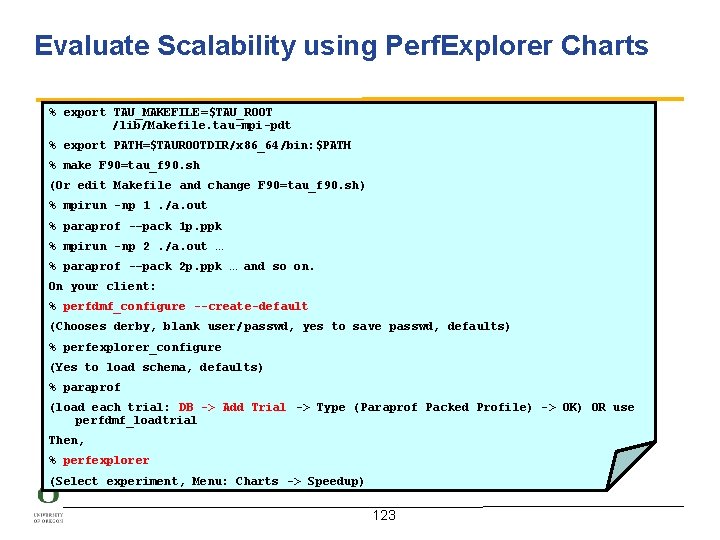
Evaluate Scalability using Perf. Explorer Charts % export TAU_MAKEFILE=$TAU_ROOT /lib/Makefile. tau-mpi-pdt % export PATH=$TAUROOTDIR/x 86_64/bin: $PATH % make F 90=tau_f 90. sh (Or edit Makefile and change F 90=tau_f 90. sh) % mpirun -np 1. /a. out % paraprof -–pack 1 p. ppk % mpirun -np 2. /a. out … % paraprof -–pack 2 p. ppk … and so on. On your client: % perfdmf_configure --create-default (Chooses derby, blank user/ passwd, yes to save passwd, defaults) % perfexplorer_configure (Yes to load schema, defaults) % paraprof (load each trial: DB -> Add Trial -> Type (Paraprof Packed Profile) -> OK) OR use perfdmf_loadtrial Then, % perfexplorer (Select experiment, Menu: Charts -> Speedup) 123

Throttling effect of frequently called small routines 124

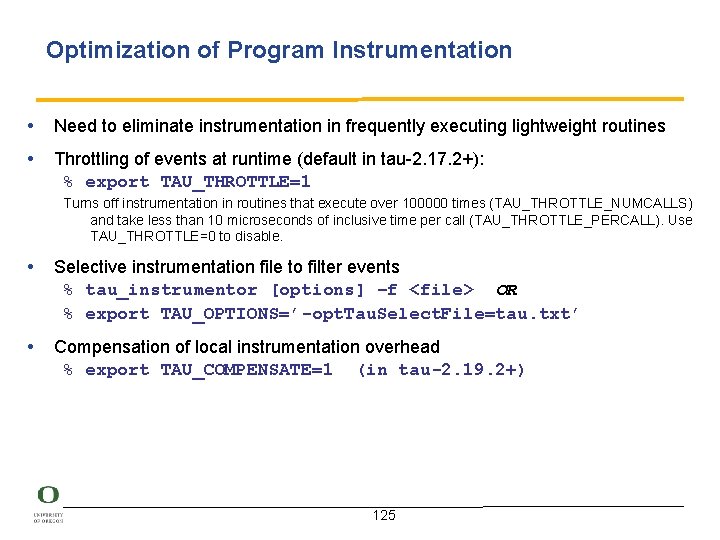
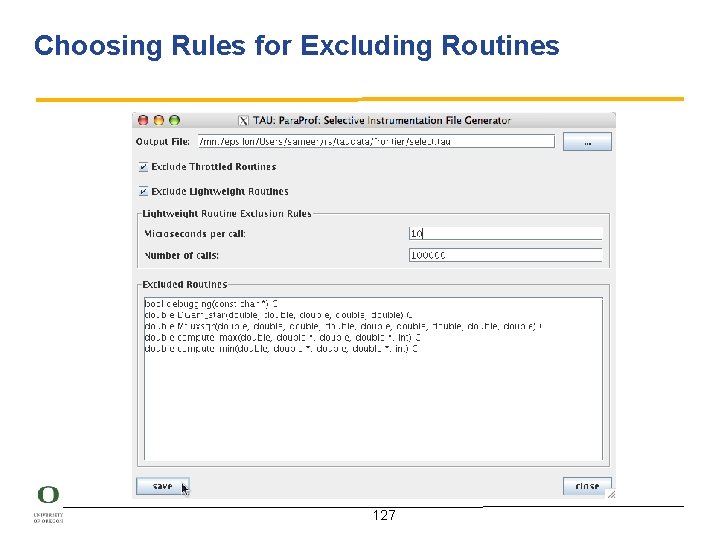
Optimization of Program Instrumentation • Need to eliminate instrumentation in frequently executing lightweight routines • Throttling of events at runtime (default in tau-2. 17. 2+): % export TAU_THROTTLE=1 Turns off instrumentation in routines that execute over 100000 times (TAU_THROTTLE_NUMCALLS) and take less than 10 microseconds of inclusive time per call (TAU_THROTTLE_PERCALL). Use TAU_THROTTLE=0 to disable. • Selective instrumentation file to filter events % tau_instrumentor [options] –f <file> OR % export TAU_OPTIONS=’-opt. Tau. Select. File=tau. txt’ • Compensation of local instrumentation overhead % export TAU_COMPENSATE=1 (in tau-2. 19. 2+) 125

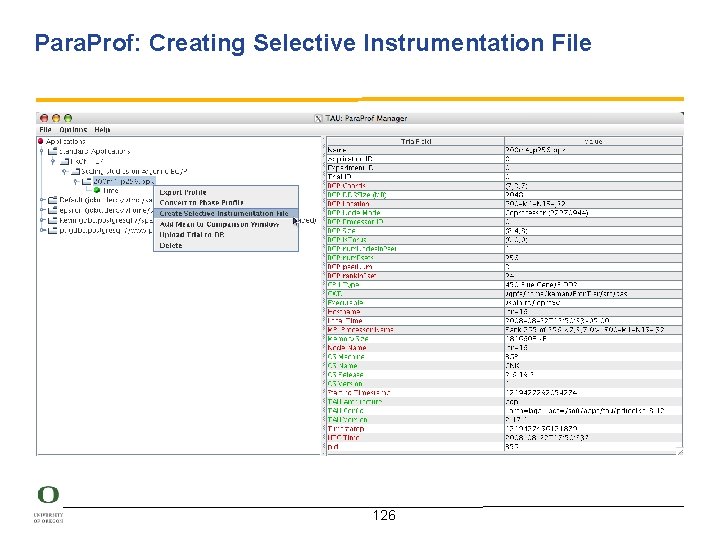
Para. Prof: Creating Selective Instrumentation File 126

Choosing Rules for Excluding Routines 127

Observing I/O bandwidth and volume 128

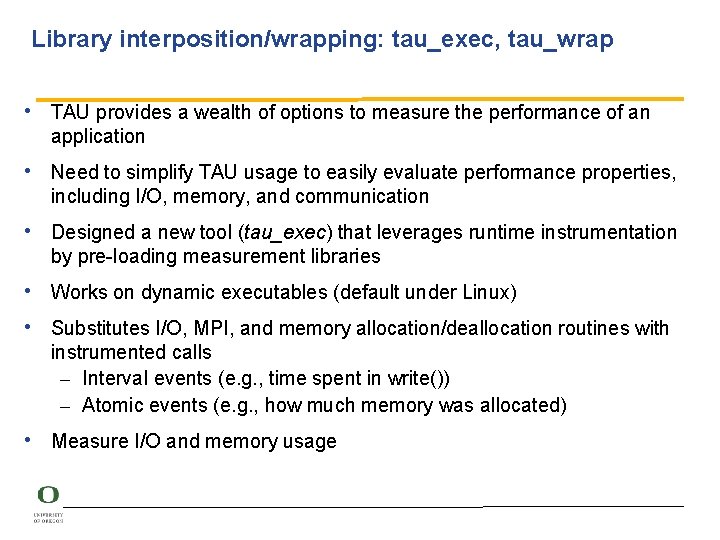
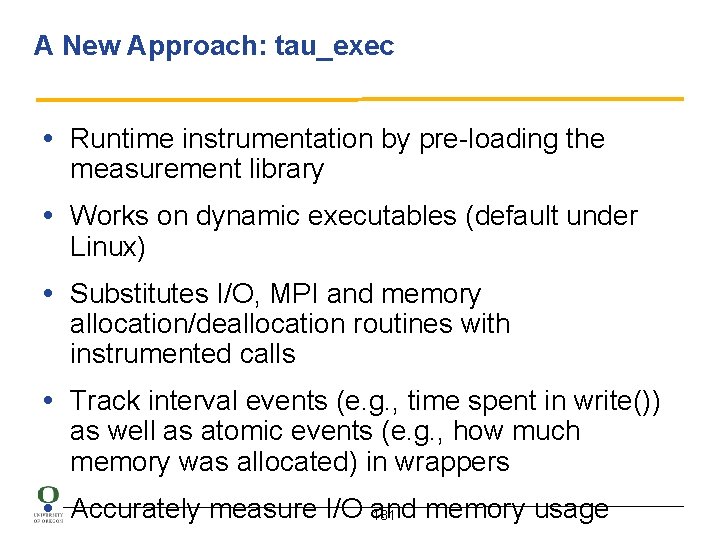
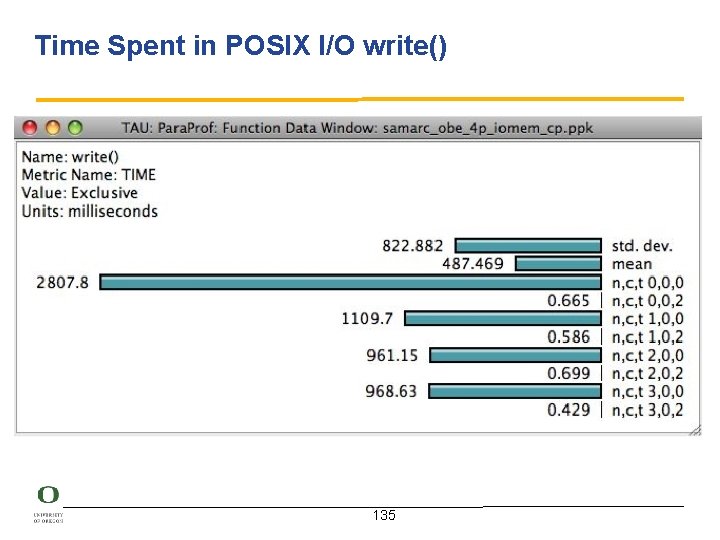
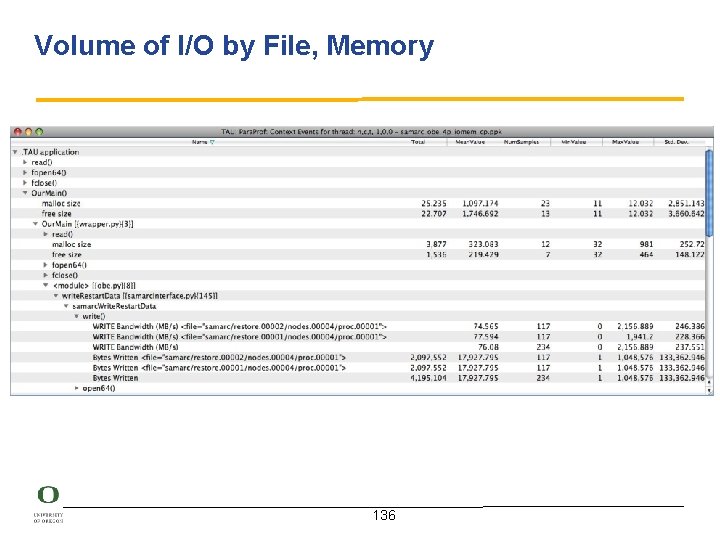
Library interposition/wrapping: tau_exec, tau_wrap • TAU provides a wealth of options to measure the performance of an application • Need to simplify TAU usage to easily evaluate performance properties, including I/O, memory, and communication • Designed a new tool (tau_exec) that leverages runtime instrumentation by pre-loading measurement libraries • Works on dynamic executables (default under Linux) • Substitutes I/O, MPI, and memory allocation/deallocation routines with instrumented calls – Interval events (e. g. , time spent in write()) – Atomic events (e. g. , how much memory was allocated) • Measure I/O and memory usage

TAU Execution Command (tau_exec) • Configure TAU with –iowrapper configuration option • Uninstrumented execution – % mpirun –np 256. /a. out • Track MPI performance – % mpirun –np 256 tau_exec. /a. out • Track I/O and MPI performance (MPI enabled by default) – % mpirun –np 256 tau_exec –io. /a. out • Track memory operations – % setenv TAU_TRACK_MEMORY_LEAKS 1 – % mpirun –np 256 tau_exec –memory. /a. out • Track I/O performance and memory operations – % mpirun –np 256 tau_exec –io –memory. /a. out • Track GPGPU operations – % mpirun –np 256 tau_exec –cuda. /a. out 1

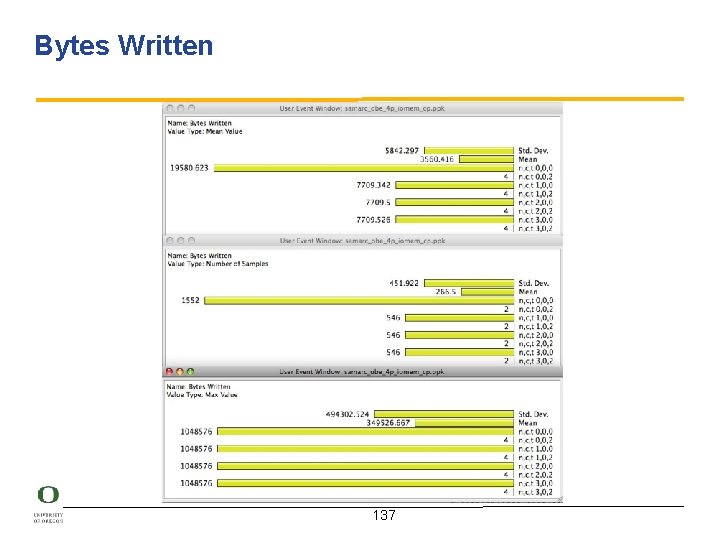
A New Approach: tau_exec • Runtime instrumentation by pre-loading the measurement library • Works on dynamic executables (default under Linux) • Substitutes I/O, MPI and memory allocation/deallocation routines with instrumented calls • Track interval events (e. g. , time spent in write()) as well as atomic events (e. g. , how much memory was allocated) in wrappers • Accurately measure I/O and memory usage 131

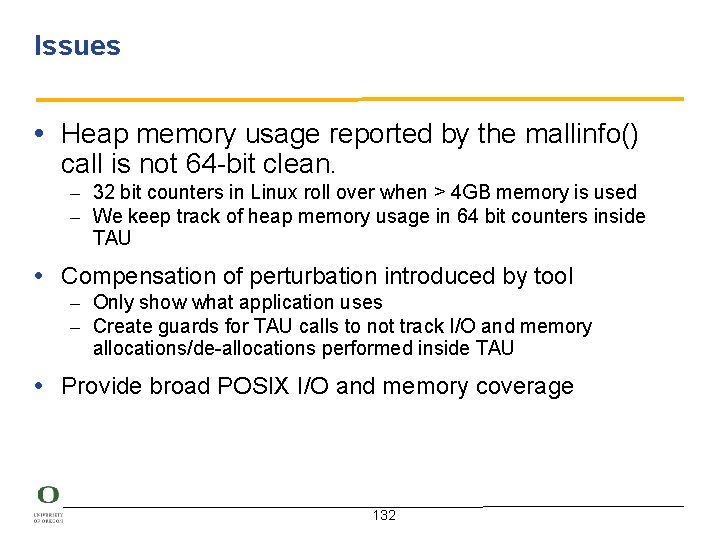
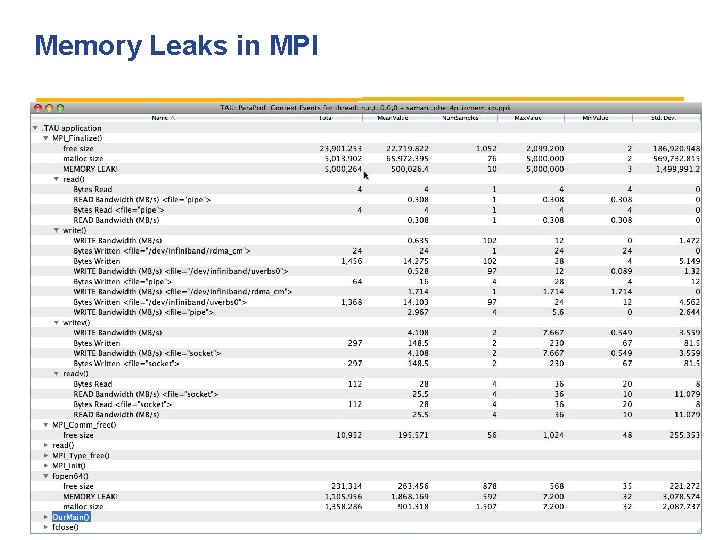
Issues • Heap memory usage reported by the mallinfo() call is not 64 -bit clean. – 32 bit counters in Linux roll over when > 4 GB memory is used – We keep track of heap memory usage in 64 bit counters inside TAU • Compensation of perturbation introduced by tool – Only show what application uses – Create guards for TAU calls to not track I/O and memory allocations/de-allocations performed inside TAU • Provide broad POSIX I/O and memory coverage 132

I/O Calls Supported 133

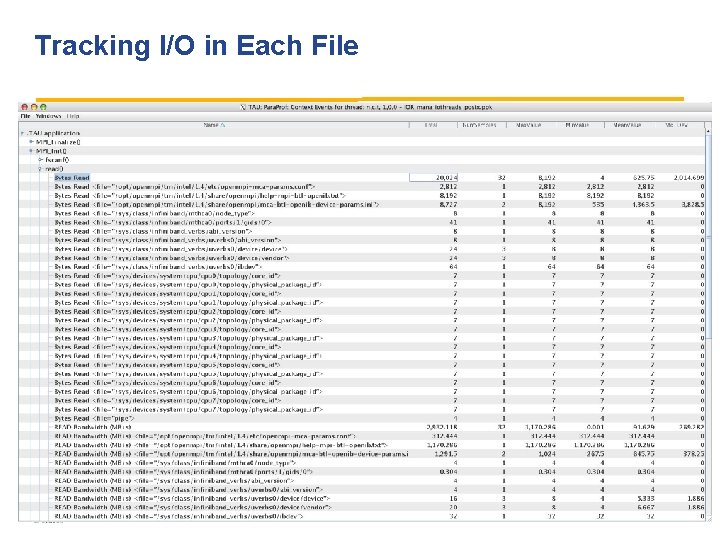
Tracking I/O in Each File 134

Time Spent in POSIX I/O write() 135

Volume of I/O by File, Memory 136

Bytes Written 137

Memory Leaks in MPI 138

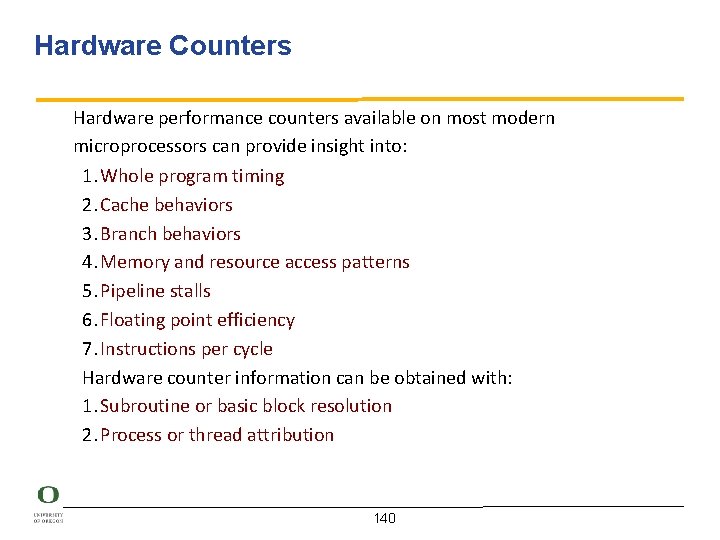
PAPI hardware counters 139

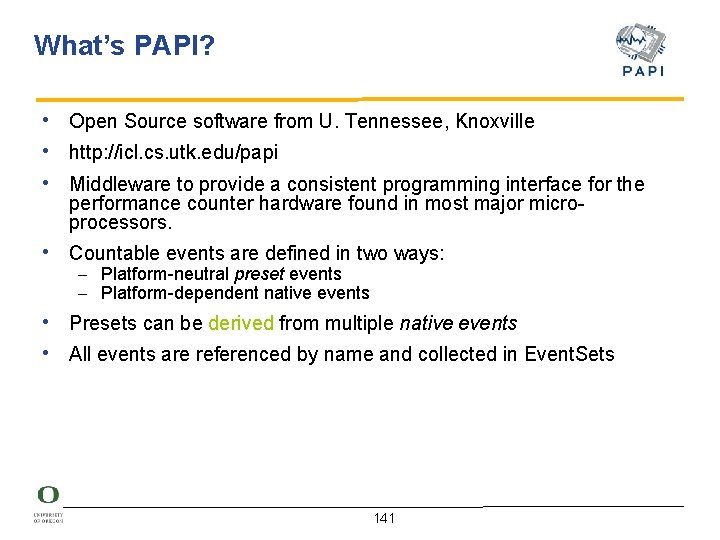
Hardware Counters Hardware performance counters available on most modern microprocessors can provide insight into: 1. Whole program timing 2. Cache behaviors 3. Branch behaviors 4. Memory and resource access patterns 5. Pipeline stalls 6. Floating point efficiency 7. Instructions per cycle Hardware counter information can be obtained with: 1. Subroutine or basic block resolution 2. Process or thread attribution 140

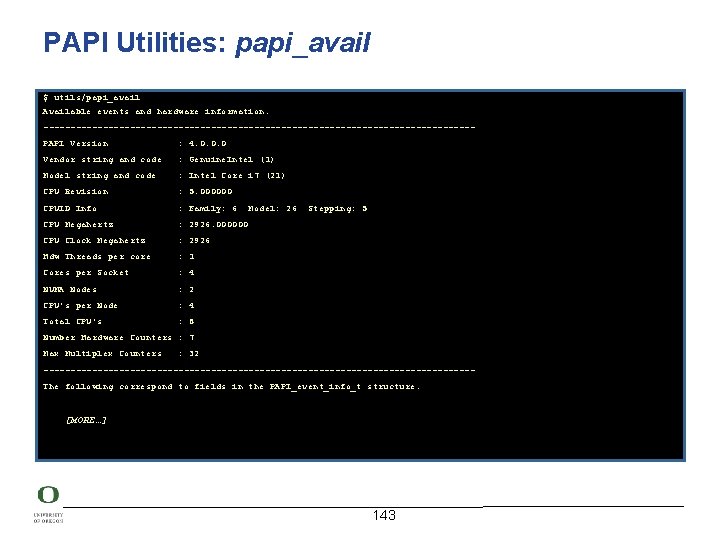
What’s PAPI? • Open Source software from U. Tennessee, Knoxville • http: //icl. cs. utk. edu/papi • Middleware to provide a consistent programming interface for the performance counter hardware found in most major microprocessors. • Countable events are defined in two ways: – Platform-neutral preset events – Platform-dependent native events • Presets can be derived from multiple native events • All events are referenced by name and collected in Event. Sets 141
![PAPI Utilities papiavail utilspapiavail h Usage utilspapiavail options Options General command options a PAPI Utilities: papi_avail $ utils/papi_avail -h Usage: utils/papi_avail [options] Options: General command options: -a,](https://slidetodoc.com/presentation_image_h2/6a771bd80c74a93dfebab9d90c6bcdd4/image-142.jpg)
PAPI Utilities: papi_avail $ utils/papi_avail -h Usage: utils/papi_avail [options] Options: General command options: -a, --avail Display only available preset events -d, --detail Display detailed information about all preset events -e EVENTNAME Display detail information about specified preset or native event -h, --help Print this help message Event filtering options: --br Display branch related PAPI preset events --cache Display cache related PAPI preset events --cnd Display conditional PAPI preset events --fp Display Floating Point related PAPI preset events --ins Display instruction related PAPI preset events --idl Display Stalled or Idle PAPI preset events --l 1 Display level 1 cache related PAPI preset events --l 2 Display level 2 cache related PAPI preset events --l 3 Display level 3 cache related PAPI preset events --mem Display memory related PAPI preset events --msc Display miscellaneous PAPI preset events --tlb Display Translation Lookaside Buffer PAPI preset events This program provides information about PAPI preset and native events. PAPI preset event filters can be combined in a logical OR.

PAPI Utilities: papi_avail $ utils/papi_avail Available events and hardware information. ----------------------------------------PAPI Version : 4. 0. 0. 0 Vendor string and code : Genuine. Intel (1) Model string and code : Intel Core i 7 (21) CPU Revision : 5. 000000 CPUID Info : Family: 6 CPU Megahertz : 2926. 000000 CPU Clock Megahertz : 2926 Hdw Threads per core : 1 Cores per Socket : 4 NUMA Nodes : 2 CPU's per Node : 4 Total CPU's : 8 Model: 26 Stepping: 5 Number Hardware Counters : 7 Max Multiplex Counters : 32 ----------------------------------------The following correspond to fields in the PAPI_event_info_t structure. [MORE…] 143
![PAPI Utilities papiavail CONTINUED The following correspond to fields in the PAPIeventinfot structure Name PAPI Utilities: papi_avail [CONTINUED…] ----------------------------------------The following correspond to fields in the PAPI_event_info_t structure. Name](https://slidetodoc.com/presentation_image_h2/6a771bd80c74a93dfebab9d90c6bcdd4/image-144.jpg)
PAPI Utilities: papi_avail [CONTINUED…] ----------------------------------------The following correspond to fields in the PAPI_event_info_t structure. Name Code Avail Deriv Description (Note) PAPI_L 1_DCM 0 x 80000000 No No Level 1 data cache misses PAPI_L 1_ICM 0 x 80000001 Yes No Level 1 instruction cache misses PAPI_L 2_DCM 0 x 80000002 Yes Level 2 data cache misses PAPI_VEC_SP 0 x 80000069 Yes No Single precision vector/SIMD instructions PAPI_VEC_DP 0 x 8000006 a Yes No Double precision vector/SIMD instructions […] ------------------------------------Of 107 possible events, 34 are available, of which 9 are derived. avail. c PASSED 144
![PAPI Utilities papiavail utilspapiavail e PAPIFPOPS The following correspond to fields in PAPI Utilities: papi_avail $ utils/papi_avail -e PAPI_FP_OPS […] -------------------------------------The following correspond to fields in](https://slidetodoc.com/presentation_image_h2/6a771bd80c74a93dfebab9d90c6bcdd4/image-145.jpg)
PAPI Utilities: papi_avail $ utils/papi_avail -e PAPI_FP_OPS […] -------------------------------------The following correspond to fields in the PAPI_event_info_t structure. Event name: PAPI_FP_OPS Event Code: 0 x 80000066 Number of Native Events: 2 Short Description: |FP operations| Long Description: |Floating point operations| Developer's Notes: || Derived Type: |DERIVED_ADD| Postfix Processing String: || Native Code[0]: 0 x 4000801 b |FP_COMP_OPS_EXE: SSE_SINGLE_PRECISION| Number of Register Values: 2 Register[ 0]: 0 x 0000000 f |Event Selector| Register[ 1]: 0 x 00004010 |Event Code| Native Event Description: |Floating point computational micro-ops, masks: SSE* FP single precision Uops| Native Code[1]: 0 x 4000081 b |FP_COMP_OPS_EXE: SSE_DOUBLE_PRECISION| Number of Register Values: 2 Register[ 0]: 0 x 0000000 f |Event Selector| Register[ 1]: 0 x 00008010 |Event Code| Native Event Description: |Floating point computational micro-ops, masks: SSE* FP double precision Uops| ------------------------------------- 145
![PAPI Utilities papinativeavail UNIX utilspapinativeavail Available native events and hardware information Event Code PAPI Utilities: papi_native_avail UNIX> utils/papi_native_avail Available native events and hardware information. ----------------------------------------[…] Event Code](https://slidetodoc.com/presentation_image_h2/6a771bd80c74a93dfebab9d90c6bcdd4/image-146.jpg)
PAPI Utilities: papi_native_avail UNIX> utils/papi_native_avail Available native events and hardware information. ----------------------------------------[…] Event Code Symbol | Long Description | ----------------------------------------0 x 40000010 BR_INST_EXEC | Branch instructions executed | 40000410 : ANY | Branch instructions executed | 40000810 : COND | Conditional branch instructions executed | 40001010 : DIRECT | Unconditional branches executed | 40002010 : DIRECT_NEAR_CALL | Unconditional call branches executed | 40004010 : INDIRECT_NEAR_CALL | Indirect call branches executed | 40008010 : INDIRECT_NON_CALL | Indirect non call branches executed | 40010010 : NEAR_CALLS | Call branches executed | 40020010 : NON_CALLS | All non call branches executed | 40040010 : RETURN_NEAR | Indirect return branches executed | 40080010 : TAKEN | Taken branches executed | ----------------------------------------0 x 40000011 BR_INST_RETIRED | Retired branch instructions | 40000411 : ALL_BRANCHES | Retired branch instructions (Precise Event) | 40000811 : CONDITIONAL | Retired conditional branch instructions (Precise | | Event) | 40001011 : NEAR_CALL | Retired near call instructions (Precise Event) | ----------------------------------------[…]
![PAPI Utilities papinativeavail UNIX utilspapinativeavail e DATACACHEREFILLS Available native events and hardware information PAPI Utilities: papi_native_avail UNIX> utils/papi_native_avail -e DATA_CACHE_REFILLS Available native events and hardware information. ----------------------------------------[…]](https://slidetodoc.com/presentation_image_h2/6a771bd80c74a93dfebab9d90c6bcdd4/image-147.jpg)
PAPI Utilities: papi_native_avail UNIX> utils/papi_native_avail -e DATA_CACHE_REFILLS Available native events and hardware information. ----------------------------------------[…] ----------------------------------------The following correspond to fields in the PAPI_event_info_t structure. Event name: Event Code: Number of Register Values: Description: Register[ 0]: 0 x 0000000 f Register[ 1]: 0 x 00000042 DATA_CACHE_REFILLS 0 x 4000000 b 2 |Data Cache Refills from L 2 or System| |Event Selector| |Event Code| Unit Masks: Mask Info: Register[ Mask Info: Register[ |: SYSTEM|Refill from System| |Event Selector| |Event Code| |: L 2_SHARED|Shared-state line from L 2| |Event Selector| |Event Code| |: L 2_EXCLUSIVE|Exclusive-state line from L 2| |Event Selector| |Event Code| 0]: 1]: 0 x 0000000 f 0 x 00000142 0]: 1]: 0 x 0000000 f 0 x 00000242 0]: 1]: 0 x 0000000 f 0 x 00000442

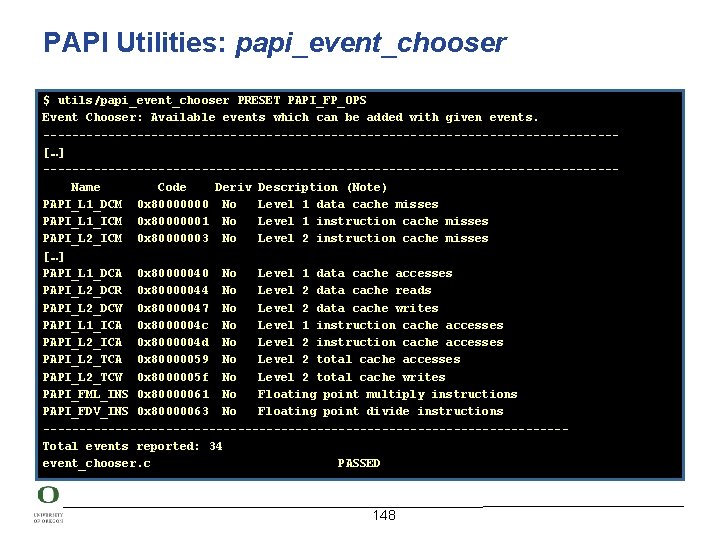
PAPI Utilities: papi_event_chooser $ utils/papi_event_chooser PRESET PAPI_FP_OPS Event Chooser: Available events which can be added with given events. ----------------------------------------[…] ----------------------------------------Name Code Deriv Description (Note) PAPI_L 1_DCM 0 x 80000000 No Level 1 data cache misses PAPI_L 1_ICM 0 x 80000001 No Level 1 instruction cache misses PAPI_L 2_ICM 0 x 80000003 No Level 2 instruction cache misses […] PAPI_L 1_DCA 0 x 80000040 No Level 1 data cache accesses PAPI_L 2_DCR 0 x 80000044 No Level 2 data cache reads PAPI_L 2_DCW 0 x 80000047 No Level 2 data cache writes PAPI_L 1_ICA 0 x 8000004 c No Level 1 instruction cache accesses PAPI_L 2_ICA 0 x 8000004 d No Level 2 instruction cache accesses PAPI_L 2_TCA 0 x 80000059 No Level 2 total cache accesses PAPI_L 2_TCW 0 x 8000005 f No Level 2 total cache writes PAPI_FML_INS 0 x 80000061 No Floating point multiply instructions PAPI_FDV_INS 0 x 80000063 No Floating point divide instructions ------------------------------------Total events reported: 34 event_chooser. c PASSED 148

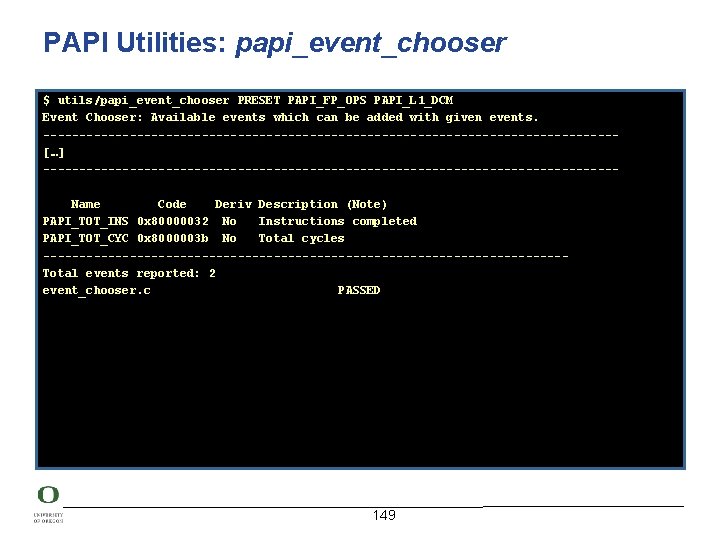
PAPI Utilities: papi_event_chooser $ utils/papi_event_chooser PRESET PAPI_FP_OPS PAPI_L 1_DCM Event Chooser: Available events which can be added with given events. ----------------------------------------[…] ----------------------------------------Name Code Deriv Description (Note) PAPI_TOT_INS 0 x 80000032 No Instructions completed PAPI_TOT_CYC 0 x 8000003 b No Total cycles ------------------------------------Total events reported: 2 event_chooser. c PASSED 149
![PAPI Utilities papieventchooser utilspapieventchooser NATIVE RESOURCESTALLS LDST X 87OPSRETIRED INSTRUCTIONSRETIRED UNHALTEDCORECYCLES 0 PAPI Utilities: papi_event_chooser $ utils/papi_event_chooser NATIVE RESOURCE_STALLS: LD_ST X 87_OPS_RETIRED INSTRUCTIONS_RETIRED […] ----------------------------------------UNHALTED_CORE_CYCLES 0](https://slidetodoc.com/presentation_image_h2/6a771bd80c74a93dfebab9d90c6bcdd4/image-150.jpg)
PAPI Utilities: papi_event_chooser $ utils/papi_event_chooser NATIVE RESOURCE_STALLS: LD_ST X 87_OPS_RETIRED INSTRUCTIONS_RETIRED […] ----------------------------------------UNHALTED_CORE_CYCLES 0 x 40000000 |count core clock cycles whenever the clock signal on the specific core is running (not halted). Alias to event CPU_CLK_UNHALTED: CORE_P| |Register Value[0]: 0 x 20003 Event Selector| |Register Value[1]: 0 x 3 c Event Code| ------------------------------------UNHALTED_REFERENCE_CYCLES 0 x 40000002 |Unhalted reference cycles. Alias to event CPU_CLK_UNHALTED: REF| |Register Value[0]: 0 x 40000 Event Selector| |Register Value[1]: 0 x 13 c Event Code| ------------------------------------CPU_CLK_UNHALTED 0 x 40000028 |Core cycles when core is not halted| |Register Value[0]: 0 x 60000 Event Selector| |Register Value[1]: 0 x 3 c Event Code| 0 x 40001028 : CORE_P |Core cycles when core is not halted| 0 x 40008028 : NO_OTHER |Bus cycles when core is active and the other is halted| ------------------------------------Total events reported: 3 event_chooser. c PASSED

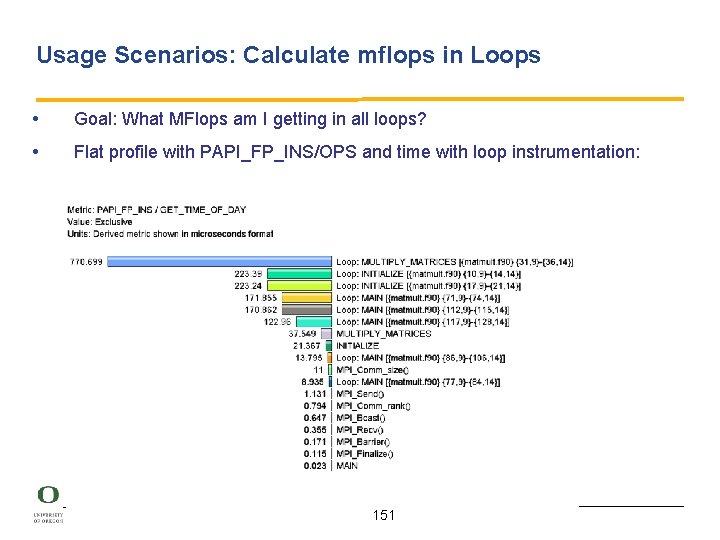
Usage Scenarios: Calculate mflops in Loops • Goal: What MFlops am I getting in all loops? • Flat profile with PAPI_FP_INS/OPS and time with loop instrumentation: 151

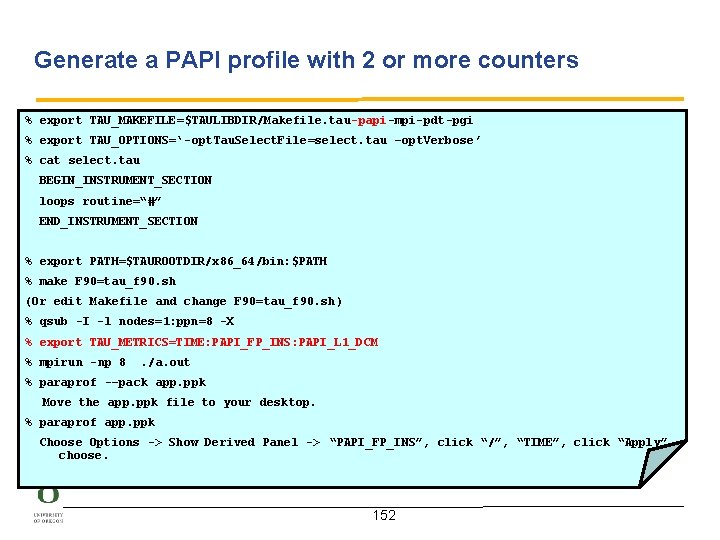
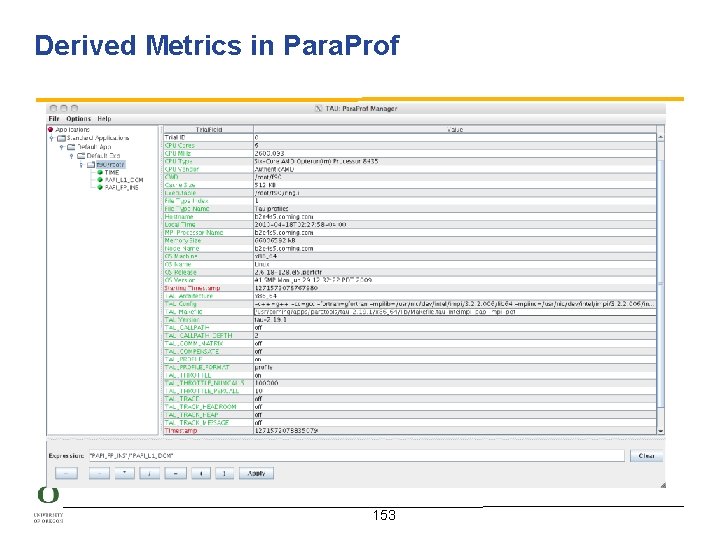
Generate a PAPI profile with 2 or more counters % export TAU_MAKEFILE=$TAULIBDIR/Makefile. tau-papi-mpi-pdt-pgi % export TAU_OPTIONS=‘-opt. Tau. Select. File=select. tau –opt. Verbose’ % cat select. tau BEGIN_INSTRUMENT_SECTION loops routine=“#” END_INSTRUMENT_SECTION % export PATH=$TAUROOTDIR/x 86_64/bin: $PATH % make F 90=tau_f 90. sh (Or edit Makefile and change F 90=tau_f 90. sh ) % qsub -I -l nodes=1: ppn=8 -X % export TAU_METRICS=TIME: PAPI_FP_INS: PAPI_L 1_DCM % mpirun -np 8 . /a. out % paraprof -–pack app. ppk Move the app. ppk file to your desktop. % paraprof app. ppk Choose Options -> Show Derived Panel -> “PAPI_FP_INS”, click “/”, “TIME”, click “Apply” choose. 152

Derived Metrics in Para. Prof 153

Para. Prof’s Source Browser: Loop Level Instrumentation

Hands-on training with sample codes 155

Labs! Lab: PAPI, TAU, and Scalasca 156

Lab Instructions (for OCF systems) Get workshop. tar. gz using: % wget http: //tau. uoregon. edu/workshop. tar. gz Or % tar zxf workshop. tar. gz And follow the instructions in the README file. For Live. DVD, see ~/workshop-point/README and follow. 157

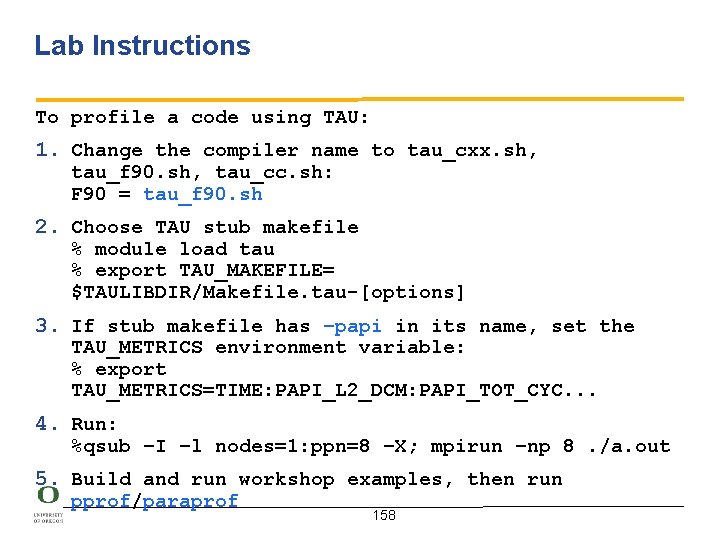
Lab Instructions To profile a code using TAU: 1. Change the compiler name to tau_cxx. sh, tau_f 90. sh, tau_cc. sh: F 90 = tau_f 90. sh 2. Choose TAU stub makefile % module load tau % export TAU_MAKEFILE= $TAULIBDIR/Makefile. tau-[options] 3. If stub makefile has –papi in its name, set the TAU_METRICS environment variable: % export TAU_METRICS=TIME: PAPI_L 2_DCM: PAPI_TOT_CYC. . . 4. Run: %qsub –I –l nodes=1: ppn=8 –X; mpirun –np 8. /a. out 5. Build and run workshop examples, then run pprof/paraprof 158

Support Acknowledgements • Department of Energy (DOE) – Office of Science contracts – Sci. DAC contracts, LBL – LLNL-LANL-SNL ASC/NNSA contract • Department of Defense (Do. D) – PETTT, HPTi • National Science Foundation (NSF) – POINT, SI-2 • University of Oregon – Dr. A. Malony, W. Spear, Dr, Lee, S. Biersdorff, S. Millstein, N. Chaimov • University of Tennessee, Knoxville – Dr. Shirley Moore • T. U. Dresden, GWT – Dr. Wolfgang Nagel and Dr. Andreas Knupfer • Research Centre Juelich – Dr. Bernd Mohr, Dr. Felix Wolf 159