Navigating TAU Visual Display Para Prof and TAU

- Slides: 18

Navigating TAU Visual Display Para. Prof and TAU Portal Mahin Mahmoodi Pittsburgh Supercomputing Center 2010

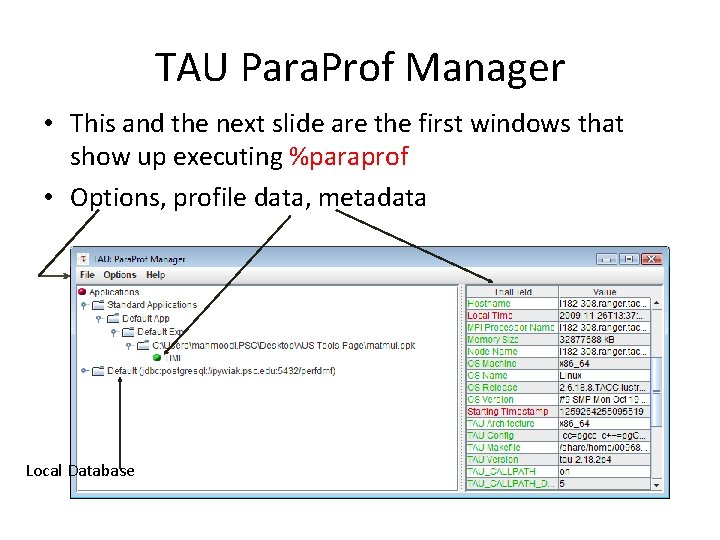
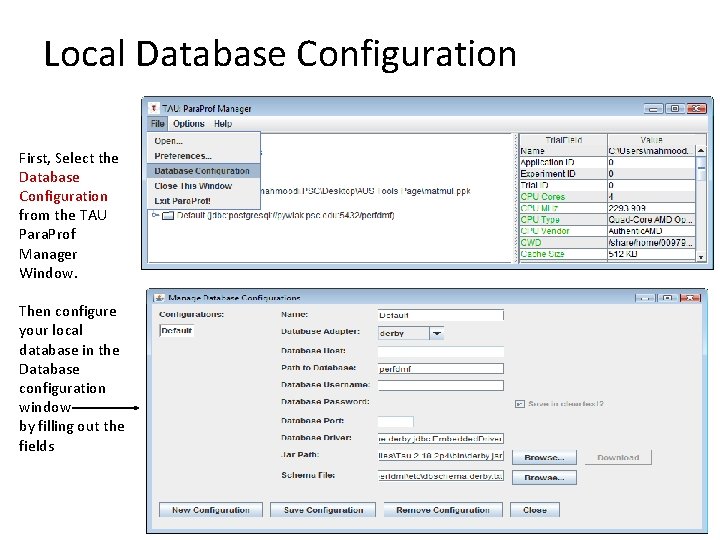
TAU Para. Prof Manager • This and the next slide are the first windows that show up executing %paraprof • Options, profile data, metadata Local Database

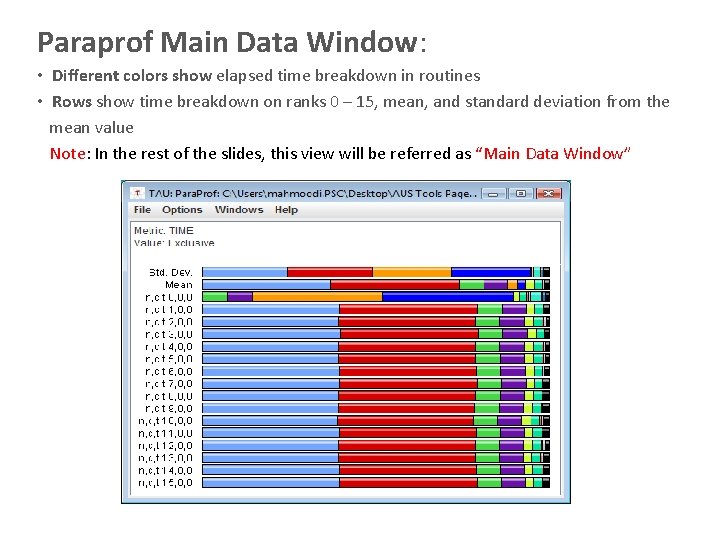
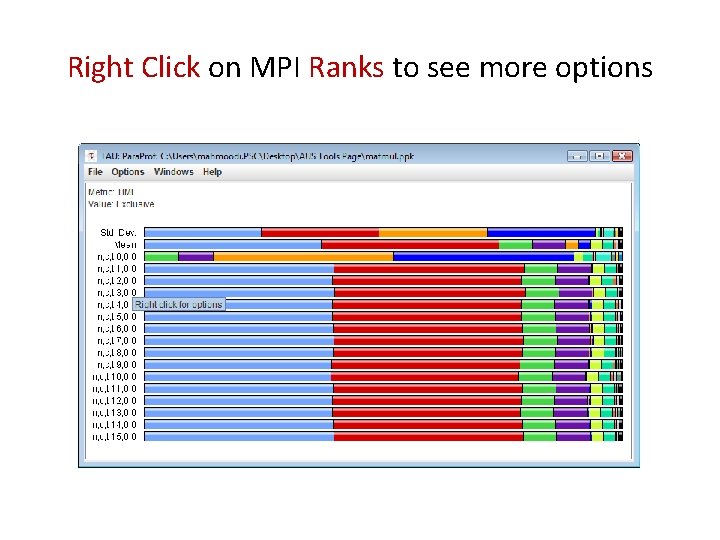
Paraprof Main Data Window: • Different colors show elapsed time breakdown in routines • Rows show time breakdown on ranks 0 – 15, mean, and standard deviation from the mean value Note: In the rest of the slides, this view will be referred as “Main Data Window”

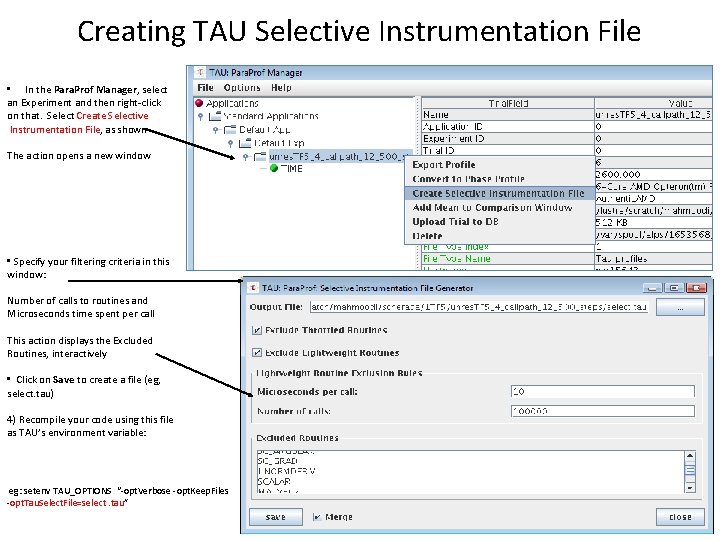
Creating TAU Selective Instrumentation File • In the Para. Prof Manager, select an Experiment and then right-click on that. Select Create Selective Instrumentation File, as shown The action opens a new window • Specify your filtering criteria in this window: Number of calls to routines and Microseconds time spent per call This action displays the Excluded Routines, interactively • Click on Save to create a file (eg, select. tau) 4) Recompile your code using this file as TAU’s environment variable: eg: setenv TAU_OPTIONS “-opt. Verbose -opt. Keep. Files -opt. Tau. Select. File=select. tau”

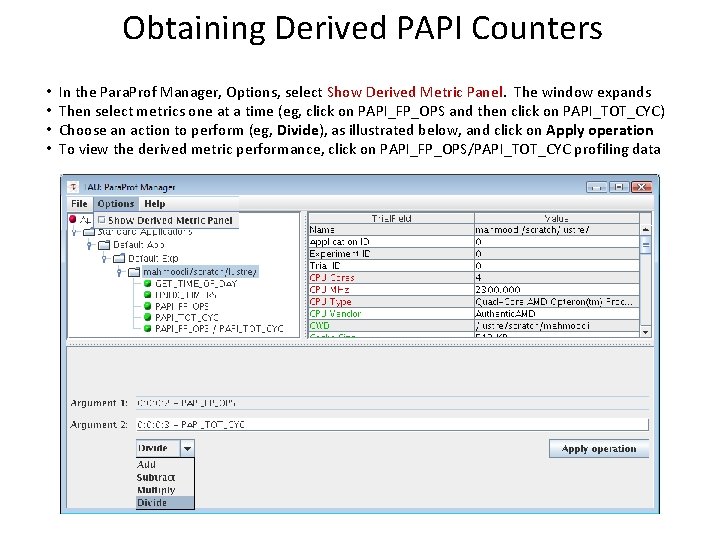
Obtaining Derived PAPI Counters • • In the Para. Prof Manager, Options, select Show Derived Metric Panel. The window expands Then select metrics one at a time (eg, click on PAPI_FP_OPS and then click on PAPI_TOT_CYC) Choose an action to perform (eg, Divide), as illustrated below, and click on Apply operation To view the derived metric performance, click on PAPI_FP_OPS/PAPI_TOT_CYC profiling data

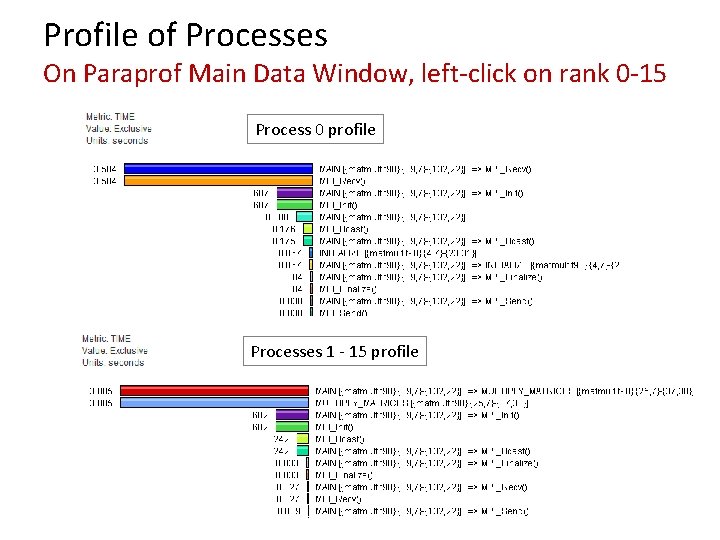
Profile of Processes On Paraprof Main Data Window, left-click on rank 0 -15 Process 0 profile Processes 1 - 15 profile

Right Click on MPI Ranks to see more options

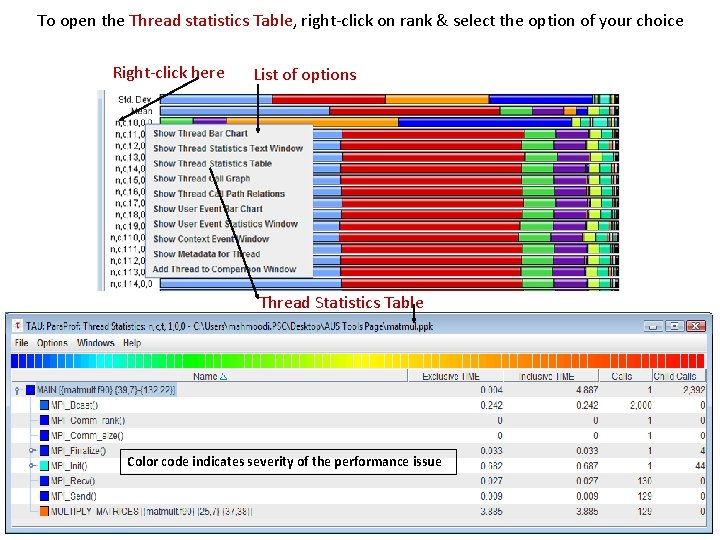
To open the Thread statistics Table, right-click on rank & select the option of your choice Right-click here List of options Thread Statistics Table Color code indicates severity of the performance issue

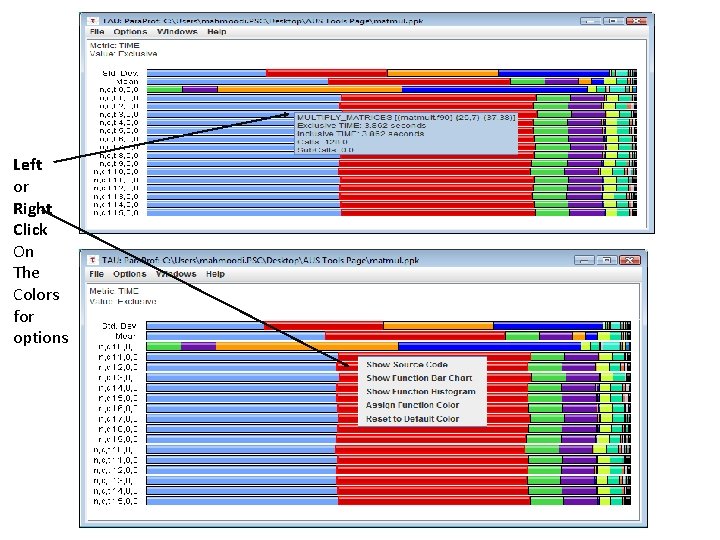
Left or Right Click On The Colors for options

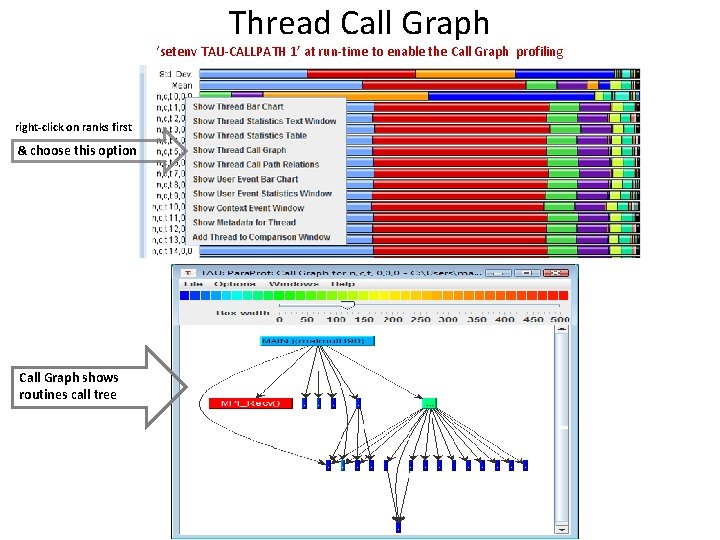
Thread Call Graph ‘setenv TAU-CALLPATH 1’ at run-time to enable the Call Graph profiling right-click on ranks first & choose this option Call Graph shows routines call tree

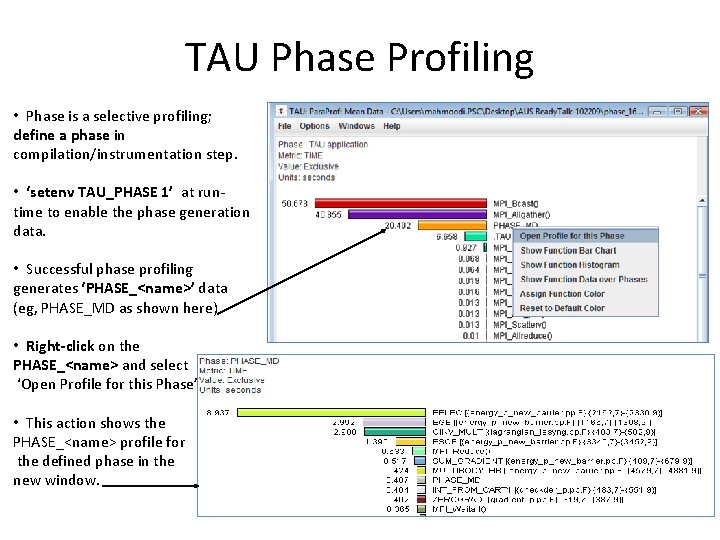
TAU Phase Profiling • Phase is a selective profiling; define a phase in compilation/instrumentation step. • ‘setenv TAU_PHASE 1’ at runtime to enable the phase generation data. • Successful phase profiling generates ‘PHASE_<name>’ data (eg, PHASE_MD as shown here) • Right-click on the PHASE_<name> and select ‘Open Profile for this Phase’ • This action shows the PHASE_<name> profile for the defined phase in the new window.

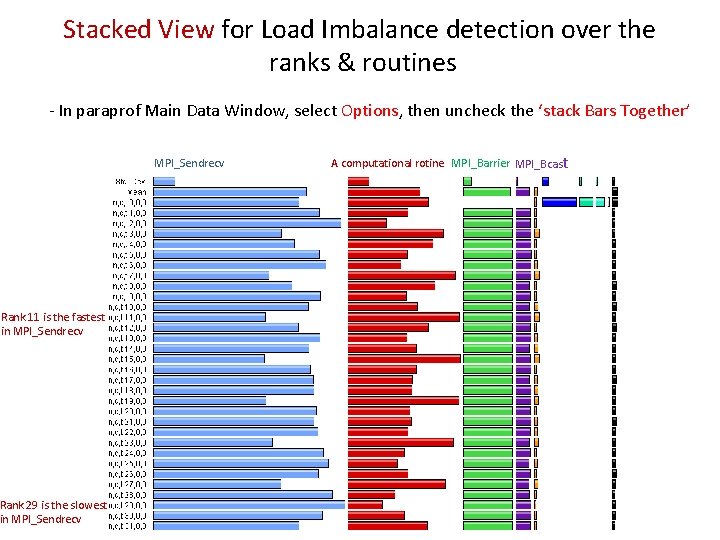
Stacked View for Load Imbalance detection over the ranks & routines - In paraprof Main Data Window, select Options, then uncheck the ‘stack Bars Together’ MPI_Sendrecv Rank 11 is the fastest in MPI_Sendrecv Rank 29 is the slowest in MPI_Sendrecv A computational rotine MPI_Barrier MPI_Bcast

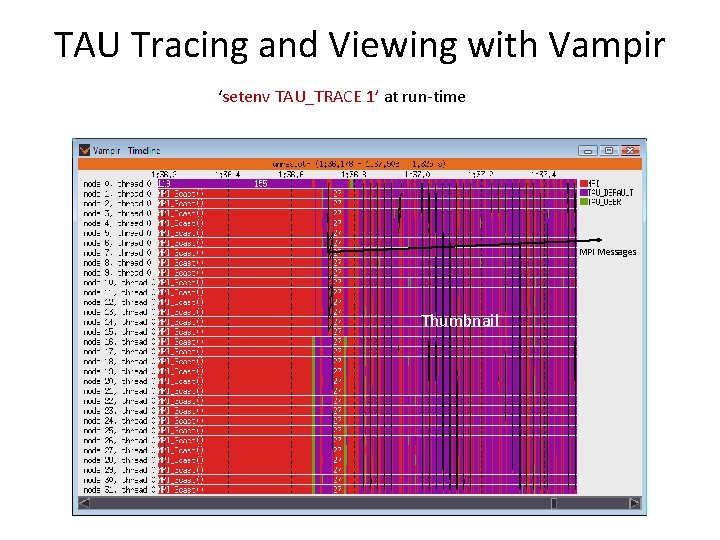
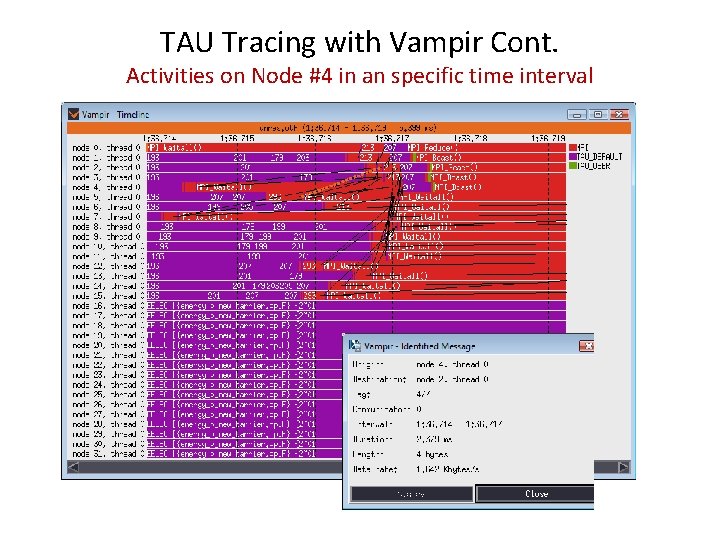
TAU Tracing and Viewing with Vampir ‘setenv TAU_TRACE 1’ at run-time MPI Messages Thumbnail

TAU Tracing with Vampir Cont. Activities on Node #4 in an specific time interval

Local Database Configuration First, Select the Database Configuration from the TAU Para. Prof Manager Window. Then configure your local database in the Database configuration window by filling out the fields

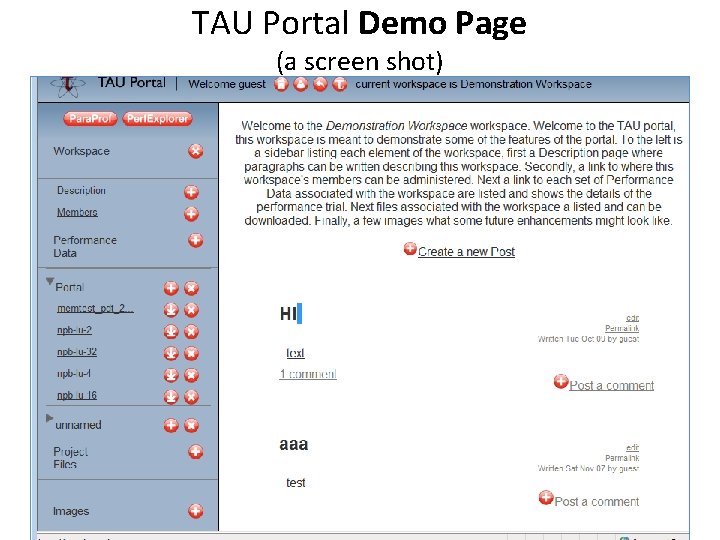
TAU Portal Collaborative environment Web-access Not need to install TAU to access TAU Portal Create an account here: https: //tau. nic. uoregon. edu/user/login • See domo page for an overview of Portal: • • http: //tau. nic. uoregon. edu/workspace/homepage? workspace=7 (a screen shot in the next slide)

TAU Portal Demo Page (a screen shot)

TAU Portal Continues Uploading & managing data in Portal • Pack your TAU profile data in remote system (paraprof – pack app. ppk) • After logged on, click on in ‘unnamed’ area to upload your data in ppk format to portal. • Once in the page, push Para. Prof or Perf. Explorer to start analyzing your data. • Then click on ‘open’ and ‘run’ to start paraprof/perfexplorer. Enter the Portal pass when asked • Select Portal(jdbc: mysql: //tau. nic. uoregon. edu: 3306/<app>) to access your data.