GPU get Display ListCPUget Display ListjavaViewdraw draw Display

CPU:get. Display. List的过程,java层View的draw方法。 红色(draw. Display. List)CPU&GPU:执行draw Display. List的过程。 黄色(dequeue. Buffer&egl.")


 Open. GL Trace")


- Slides: 38
发现掉帧 GPU呈现模式 蓝色(get. Display. List)CPU:get. Display. List的过程,java层View的draw方法。 红色(draw. Display. List)CPU&GPU:执行draw Display. List的过程。 黄色(dequeue. Buffer&egl. Swap. Buffers):将绘制好的Buffer交给Surface. Flinger。
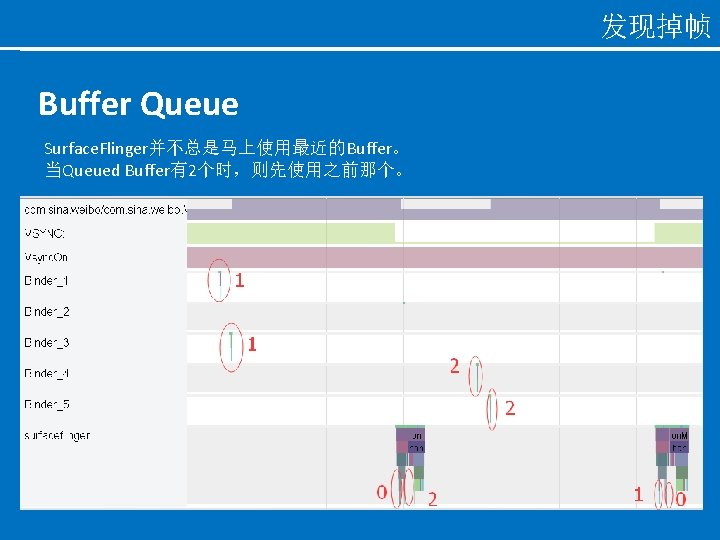
发现掉帧 Buffer Queue 3缓冲:对于每个Window,Buffer Queue中有3个Buffer。 1个Buffer的状态变化:Released -> Dequeued -> Queued -> Acquired ->. . . 可在Systrace上查看Buffer的流转情况
找出问题 Systrace Method Trace (仅辅助作用) Open. GL Trace
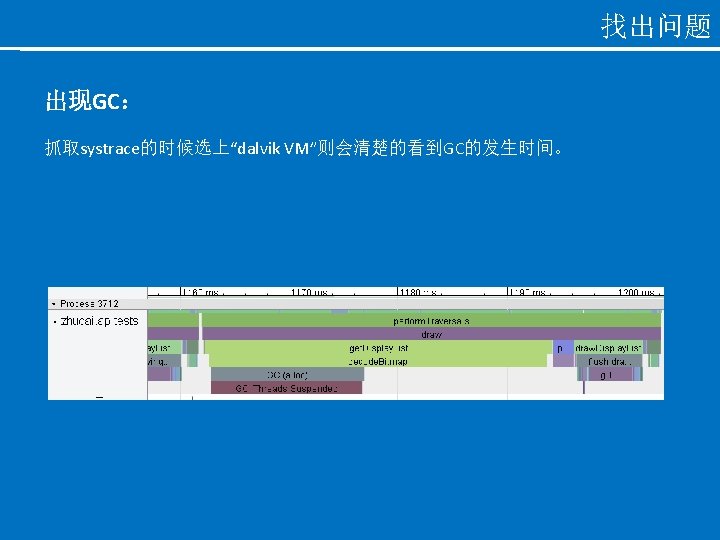
找出问题 Systrace 抓取systrace的时候除了选择Graphics, Input, View. System, 还建议选 上Resource Loading, Dalvik VM。
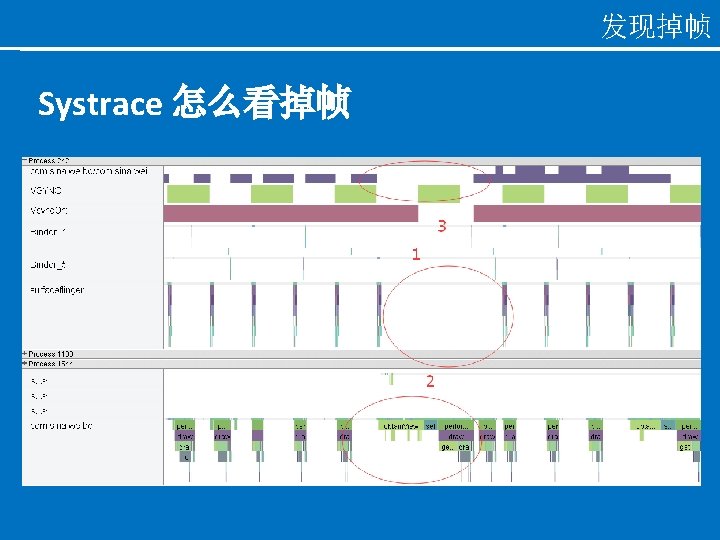
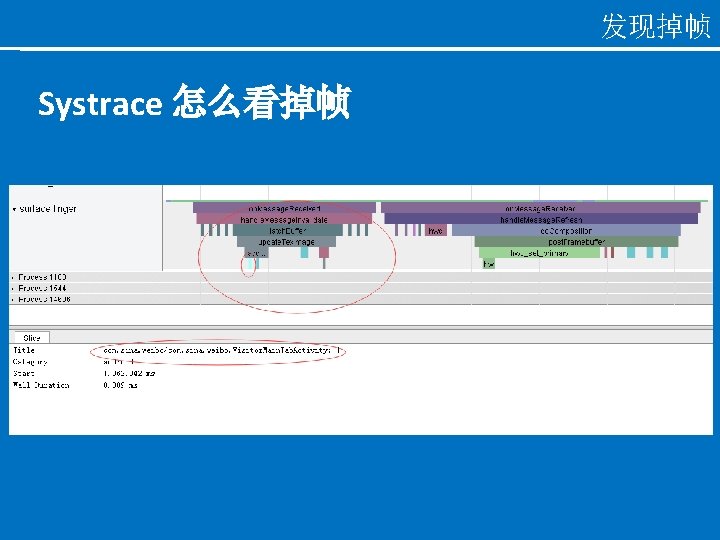
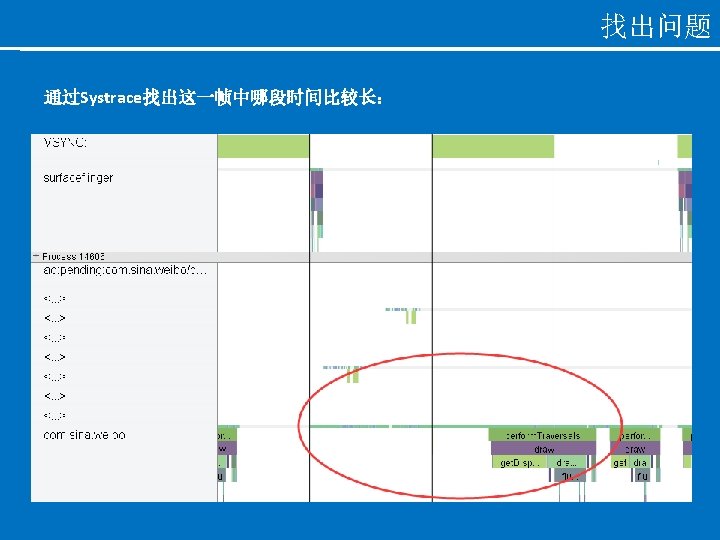
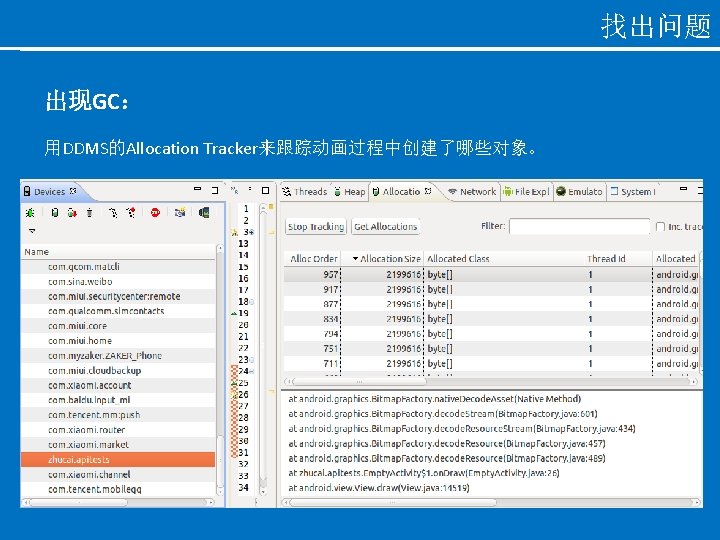
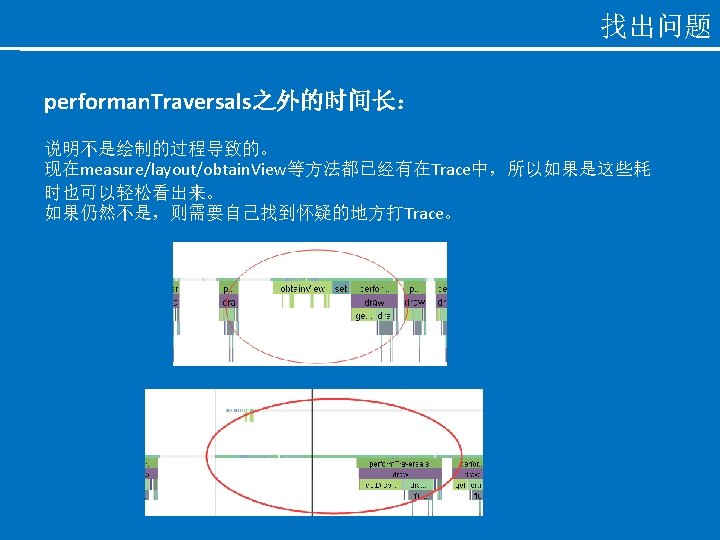
找出问题 通过Systrace找出这一帧中哪段时间比较长: 1. get. Display. List 2. draw. Display. List 3. dequeue. Buffer & egl. Swap. Buffers 4. 有GC 6. 上面的都不是,在perform. Traversals之外比较长 7. 其他
找出问题 draw. Display. List 时间长:Systrace
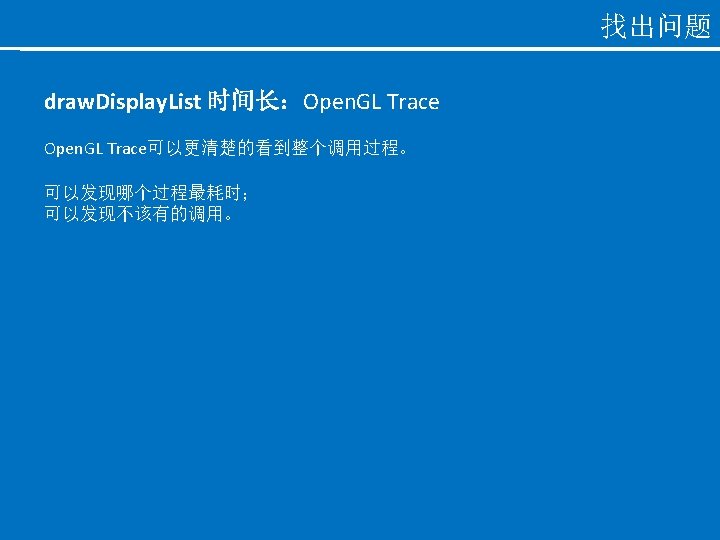
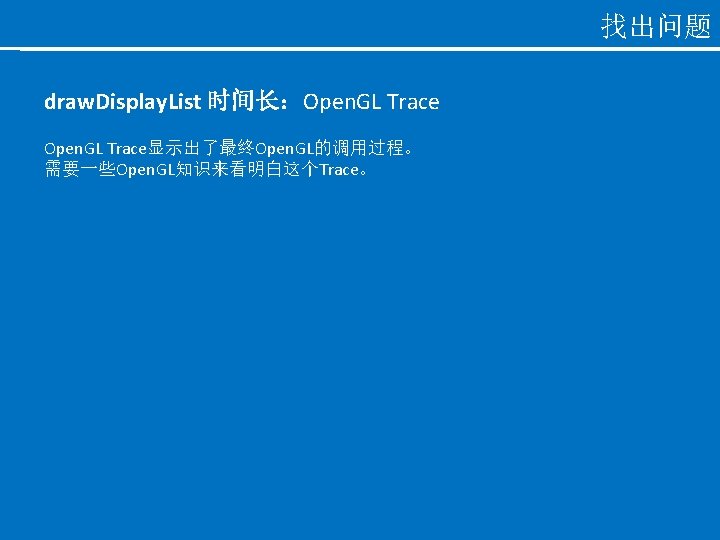
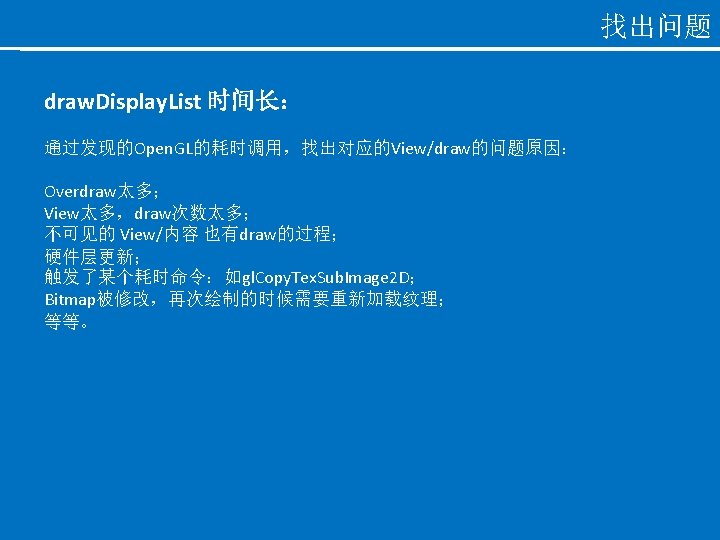
找出问题 draw. Display. List 时间长:Open. GL Trace
链接 Android Performance Case Study: http: //www. curious-creature. com/docs/android-performance-case-study-1. html 上文的译文:http: //www. importnew. com/3784. html Hardware Acceleration: http: //developer. android. com/guide/topics/graphics/hardware-accel. html Graphics: https: //source. android. com/devices/graphics/index. html Architecture: http: //source. android. com/devices/graphics/architecture. html Systrace: http: //developer. android. com/tools/help/systrace. html http: //developer. android. com/tools/debugging/systrace. html Tracer for Open. GL ES (Open. GL Trace): http: //developer. android. com/tools/help/gltracer. html
谢谢! 朱才 zhucai@xiaomi. com